Supported by:

Copyright © 2020
CDP Worldwide. All rights reserved.
CDP Water Security Questionnaire Preview and Reporting Guidance 2020 - Version Control
| Version number
|
Release/Revision date
|
Revision summary
|
| 1.0 |
Released: Dec 16, 2019
|
The 2020 water security questionnaire preview and the preliminary version of the reporting guidance was released.
|
| 1.1 |
Released: Feb 28, 2020 |
- W2.2b: Missing drop-down option added for "Type of incident".
- W4.2, W4.2a: Missing drop-down option added for "Timeframe".
- W6.4: Minor edits to "Requested content" for clarification.
|
| 2.0 |
Released: March 6, 2020 |
- W3.3a: Modified guidance to simplify selection of "Coverage".
- W4.2: Updated "Example response".
|
| 2.1 |
Released: April 14, 2020 |
- The Terms were added for the 2020 Investor and Supply Chain questionnaires.
- The Deadline for submission was updated to: August 26, 2020.
|
CDP disclosure cycle 2020
Accessing questionnaire previews, reporting guidance, and scoring methodologies
CDP’s corporate questionnaire previews, reporting guidance, and scoring methodologies for climate change, forests and water security can be accessed from the guidance for companies page of CDP's website.
Submitting a response to the questionnaire(s)
Responses to questionnaires must be submitted via CDP's Online Response System (ORS), which is part of CDP's online disclosure platform. Please refer to Using CDP's Online Disclosure Platform for more details. Please note that while the questions themselves are the same in the questionnaire preview as they are in the ORS, the display format of some questions may differ, particularly for drop-down options and tables.
Sector-specific questions
Companies in high-impact sectors, in addition to the general questions, will be presented with questions specific to that sector. The rationale for developing a refined questionnaire for each of these sectors is outlined in the relevant sector introduction.
The sector-specific questions to companies are defined by CDP's Activity Classification System (CDP-ACS). This system categorizes companies by focusing on the activities from which they derive revenue and associating these with the impacts to their business from climate change, water security and deforestation.
Please note that since each questionnaire includes sector-specific questions throughout, and not all questions will be applicable to your organization, some question numbers may skip.
Full and Minimum versions of the questionnaire
All organizations completing the climate change, forests and water security questionnaires are eligible to complete the full questionnaire.
In some cases, organizations may be eligible to complete a minimum version which contains fewer questions, and no sector-specific questions or data points. Organizations are eligible to complete the minimum version in the following circumstances:
- They are disclosing to that questionnaire for the first time; OR
- They are not disclosing to that questionnaire for the first time, but have an annual revenue of less than EUR/US $250 million*
Organizations opting to complete a minimum version will only be eligible for scoring if they are submitting a response to customers (CDP Supply chain members). For more information on scoring eligibility and implications, please see our Scoring Introduction.
* For previous responders to a questionnaire with an annual revenue of less than EUR/US$250 million, CDP reserves the right to remove the option of a minimum version questionnaire due to the organization’s potential or existing environmental impact.
Timeline:
December 2019
|
- Preview of 2020 questionnaires and preliminary version of reporting guidance released on CDP website.
|
| March 2020
|
- Final version of reporting guidance and scoring methodologies released on CDP website.
|
| April 2020
|
- Online Response System (ORS) opens in the week commencing 13 April 2020.
|
| August 2020
|
- Companies must submit their responses to investors and/or customers using the ORS by 26 August 2020 to be eligible for scoring and inclusion in reports (where applicable).
|
For any disclosure-related enquiries, please contact your regional CDP contact, or [email protected].
CDP water security questionnaire
This questionnaire is the property of CDP Worldwide, reproduction of all or part (including within software platforms) without permission of CDP Worldwide is prohibited. Please contact [email protected] for more information on this.
Introduction to CDP’s water security questionnaire
CDP uses transparency and accountability to drive corporations, financial markets, and governments to decouple growth from depletion of freshwater resources and allocate capital towards a water secure economy to achieve the Sustainable Development Goals.
We do this by collecting information for investors, customers and policy makers on a company’s management, governance, use and stewardship of water resources.
The CDP water security questionnaire provides data users and the companies themselves with an insight on current and future water-related risks and opportunities. Along with CDP's water scoring methodology, the water security questionnaire helps companies to drive improvements in water management and enables benchmarking against leading practice.
The water security program has grown significantly since it was established in 2010, in terms of the numbers of companies disclosing, the value of associated assets and the number of investors and customers requesting the data. CDP now holds the world’s largest corporate water dataset, with more companies reporting than ever before.
Commit to Action
CDP and its partners in the We Mean Business coalition have created a central platform for companies to take action on key climate issues. More than one thousand companies representing every economic sector and geography have taken action to date.
One initiative companies can commit to on the We Mean Business platform is to improve water security. This commitment can be tracked in CDP’s water security questionnaire:
- Analyzing water-related risks (W3.3a, W3.3b, W3.3c) and implementing collaborative response strategies (W1.4a, W4.1b, W4.2a, W4.3, W8.1, W8.1b);
- Measuring and reporting water use data (W1.2b, W1.2h, W1.2i, W8.1); and
- Reducing impacts on water availability and quality in direct operations and along the value chain (W1.4a, W8.1, W4.2, W4.2a, W4.3a).
General water security questionnaire structure
The structure and content of the water security questionnaire was revised in 2018 to reflect trends in corporate water reporting, the evolving needs of water data users, developments in public policy agendas, greater alignment with CDP’s climate change and forests questionnaires, and CDP’s introduction of sector questionnaires.
The modular structure broadly reflects the narrative of the CEO Water Mandate Guidelines, assisting companies on a water stewardship journey and providing relevant data to investors.
There are 10 water modules, including the Signoff, plus a module presented only to organizations that supply goods or services to the member companies of CDP’s supply chain program.
The journey through CDP’s general water questionnaire includes the following:
- Water dependence and water accounting metrics
- Value chain engagement activities
- Business impacts
- Risk assessment procedures
- Risks, opportunities and responses to them
- Facility water accounting
- Water governance and business strategy
Sector approach
- Companies in some sectors considered high-impact for water are presented with sector specific requests for information, either in addition to or instead of the general water data points.
- The rationale for developing a refined questionnaire for each of these sectors is outlined in each sector introduction.
- Questions that are unique to companies in a particular sector are labeled using a two-letter abbreviation within the question number (see below). Some general water questions, beginning with the letter W, may include sector-specific data requests. In the disclosure platform these will be presented only to companies in the relevant sector.
2020 water sectors:
- Agriculture: Food, beverage & tobacco (FB)
- Energy: Electric utilities (EU); Oil & gas (OG)
- Materials: Chemicals (CH); Metals & mining (MM)
Water security questionnaire changes for 2020
- The questionnaire is stabilized for 2020 so there are only minimal changes including minor revisions reflecting feedback or error correction.
- Modifications include:
- Five removed questions: W1.2j, W5.1c (recycling/reuse); W9.1, W9.1a, W9.1b (linkages and tradeoffs)
- One removed question each for metals & mining and oil & gas sectors: W-MM1.2j, W-OG1.2j (recycling/reuse)
- Two new questions: W6.4, W6.4a on C-suite employee and board member incentives (these questions were previously presented only to high impact sectors and have been modified)
- Three 2019 questions merged: W5.1a (columns 3-8), W5.1b (columns 3-6) have been merged into W5.1
- Two new questions for metals & mining sector: W-MM3.2a, W-MM3.2b on awareness and management of risks associated with hazardous and highly hazardous tailings dams
- Revisions and changes are also indicated within the questionnaire as: no change, minor change, modified question, new question, or modified guidance. 'Minor change' indicates wording edits and revisions to drop-down options or a simple clarification, while a modification indicates where the data requested has been revised.
- A detailed document on water security question changes from 2019 to 2020 can be found on the Guidance page of the website.
Preparing your CDP response
CDP disclosure support
CDP provides a variety of support materials to help organizations disclosing to our questionnaires. Before completing the corporate questionnaires, we strongly recommend you read the relevant Reporting Guidance, Scoring Introduction document, and relevant Scoring Methodology. Please also see our Frequently Asked Questions.
Reporting guidance
CDP's reporting guidance includes the following sections:
- Module-level guidance: for select modules this guidance provides an overview, key changes, sector-specific content for the module, and important disclosure notes. This section also presents question pathway diagrams showing the flow of questions through each module.
- Question-level guidance: at the question level, guidance is separated into the following components, to provide clarity around questions, terminology and requirements.
- Rationale: provides reasoning behind the inclusion of each question;
- Connections to other frameworks: notes connections to the Sustainable Development Goals (SDGs) and The CEO Water Mandate for each relevant question in the water security questionnaire;
- Requested content: offers context around each question and requested criteria;
- Explanation of terms: provides detailed definitions for specific terminology;
- Example responses: for select questions, this provides an example of a response that would include all information requested; and
- Additional information: for select questions, this provides optional contextual information and sources related to the subject of the disclosure request.
- Glossary: viewable at the end of the reporting guidance, the glossary contains a subset of 'Explanation of terms'
- Appendix: River basin list — and South African Water Management Areas — by country
If you have any questions that are not answered in the reporting guidance, the additional guidance noted below, or our Frequently Asked Questions, please contact your local CDP office or [email protected].
Additional CDP guidance
In addition to the reporting guidance, scoring methodologies and a selection of technical notes can be found on the guidance for companies page of CDP's website. The full suite of technical notes and guidance materials are accessible from the guidance tool after signing in.
Webinars and workshops
CDP hosts live webinars and workshops designed to aid you with environmental reporting.
Please visit the workshops and webinars and water security pages of CDP's website for more details.
CDP Reporter Services
CDP Reporter Services program offers tailored support, enhanced data access and thought leadership on managing and reporting environmental risk to your business. Access the tools you need to move from disclosure to leadership on integrating climate, forests management, and water security into your wider business strategy. For year-round, personalized disclosure support from a dedicated CDP account manager, a gap analysis of your previous response, final review before submission, and analytics tools to benchmark yourself against peers and understand best practice contact [email protected]. Visit the Reporter Services page of CDP's website for more information.
CDP water consultancy solutions providers
CDP accredited water consultancy solutions providers support companies looking to engage with and improve their water management. Partners are subject to strict selection criteria and once approved are able to work closely with companies to provide expertise on critical topics including: water accounting, water risk assessment, the development of water strategies and development and implementation of corporate water stewardship plans. Visit the accredited solutions providers page of CDP's website or contact [email protected] to learn more.
Notes for completing your disclosure
Acronyms
Avoid using bespoke internal acronyms unless required for your organization’s response, in which case please provide their meaning to enable correct analysis and scoring.
Blank responses
Leaving a response blank is interpreted as non-disclosure. For numeric fields, values of zero (0) imply a measurement has been made, and the value is zero (0). For numeric fields where no measurement has been made, please leave the field blank and provide an explanation in an open text field for that same question (e.g. 'Comment' or 'Please explain'). If there is no open text field for the question, you may provide an explanation in the 'Further information' field in the ORS at the end of your disclosure. Leaving a response blank and entering a value of zero (0) have different scoring implications. Please see the scoring methodology for more details.
Character limits
Limits noted in the guidance and the ORS include spaces.
'Comment' column
Some questions include a column labelled as 'Comment'. Note that providing information in these columns is optional.
Company-specific information
Some questions request company-specific information. Be sure to include company-specific detail, such as references to activities, programs, products, services, methodologies, or operating locations unique to your company’s business or operations. A company-specific explanation should include details that make the answer true for the responding company and are distinct from other companies in the same industry and/or geography. This level of detail gives data users confidence that the issue at hand has been thoroughly considered in the context of the responder’s own business and not simply assessed in general terms.
Consistency
CDP encourages a comprehensive and consistent response. Please ensure there is no conflicting information in your responses, both within a question and across the questionnaire.
Copy from last year
The ‘copy from last year’ functionality will be available in the ORS for companies that disclosed to CDP in the previous reporting year.
Note that this functionality may have been disabled for modified data points. The reporting guidance will indicate which questions have been modified. The Questionnaire Changes document on the guidance section of the CDP website lists all revisions. Your responses should always be checked before submission.
Data accuracy
CDP recognizes that there may be uncertainty linked to data – this can arise from data gaps, assumptions, metering/measurement constraints including equipment accuracy etc. CDP allows estimated data to be submitted. However, an emphasis is placed on reporting transparently and this means that a company should always provide an explanation when its reported data is not accurate and detail the uncertainty (use the 'Please explain' or 'Comment' columns provided in the question).
Drop-down options ('Other, please specify')
Please select from the options provided whenever possible, and only select 'Other, please specify' when none of the listed options is appropriate. This greatly assists data analysis. If selecting 'Other, please specify', you must add a label that describes the option you are providing data for.
'Further information' field
At the end of the questionnaire, there is an opportunity to provide additional information or context that you feel is relevant to your organization’s response. This field is optional and not scored.
Mergers and acquisitions (M&As)
All disclosure should be defined by the organizational boundary applicable at the time of the stated reporting period. (Note that for CDP disclosure, organizations are encouraged to align their reporting period and organizational boundaries with their financial reporting).
Regarding forward-looking disclosure, organizations should include information that was correct at the time of the stated reporting period (for example, for data points referring to the future or 'the next two years'). Organizations undergoing (or that have undergone) M&As need to consider the timing of the M&As and reporting period as follows:
- Organizations that were acquired after the end of the current reporting period: these should respond with what was planned (strategy, targets, etc.) before being acquired (i.e., during the reporting period). For transparency, where possible they may state where they consider that the forward-looking information may be subject to change due to the very recent acquisition.
- Organizations that were acquired during the reporting period: these should provide information that was applicable and correct to the best of their knowledge at the end of the reporting period. At the time of submitting their response to CDP, this information may not be the most up to date due changes underway following the acquisition. For transparency, the company may state this in their disclosure where possible.
Personal data
It is important that you do not include the name of any individual or any other personal data in your response. For questions that ask for the positions of staff, out of respect for personal data privacy we are asking only for the position and not for the individual’s name or any other information relating to them.
Providing feedback to CDP
You can provide feedback to CDP on the content of our questionnaires and supporting documents through our online technical feedback form.
We are unable to respond individually to all feedback, but please be assured that all form submissions are reviewed and contribute towards our continuous improvement. However, if you represent a responding organization and would like to request a response, please email [email protected] or your local CDP contact.
Introduction to CDP water security reporting guidance
Water reporting
Water presents a unique set of measurement and reporting challenges on both the local and global scales.
- First and foremost, water management is a local or regional issue. Local contexts matter. Challenges and opportunities depend on patterns of local precipitation, watersheds and aquifers, as well as the degree and nature of local use, and the extent and efficacy of water governance and regulation. Unlike a ton of carbon dioxide that will have the same impact whether emitted in Stockholm or Sydney, the geographical scale, location and timing of water use is critical. A cubic meter of water used in Sydney has very different consequences from a cubic meter used in Stockholm. This creates complexities in managing water use in a way that progresses water security for all, as well as in creating meaningful corporate water indicators.
- Standards for water reporting are not yet as consistently or universally established as those for GHG emissions.
- While GHG emissions which can be expressed in tons of CO2e, there is no single or interchangeable quantitative unit of measurement for tracking the risks and impacts associated with water. Factors that must be considered include available volumes, water quality, the degree of competition in the region concerned, as well as future scenarios for physical, regulatory, market and technological changes.
- Compounding this complexity, the global nature of business and supply chains mean that water use is linked across multiple geographies. Even when their own operations or assets are not affected, many businesses may be exposed to and significantly affected by changing patterns of water availability. For large companies with complex supply chains containing potentially thousands of suppliers, assessing water use and related product or supply chain issues can be highly complex.
CDP’s approach to water reporting
Alignment
To support the development of standards that are both valuable for companies and provide investors, policy makers and other data-users with meaningful information, CDP works with a range of organizations; such as the CEO Water Mandate, the World Resources Institute, WWF, World Business Council for Sustainable Development, the Global Reporting Initiative, the Alliance for Water Stewardship, Ceres, Sustainability Accounting Standards Board (SASB) and similar organizations. Standardization is needed to facilitate transparency and reporting as well as to support consistency and comparability for data users.
CDP’s water security request and our reporting guidance draw on reporting principles, frameworks definitions and standards from these and other organizations and align wherever possible. Where differences remain, they reflect each organization’s particular approach and aims.
Note on alignment with the GRI 303: Water and Effluents 2018: organizations using the GRI standards for their corporate reporting will find it useful to refer to Linking GRI and CDP. It sets out the linkages between the information required for the GRI 303 standard and that requested for CDP’s 2018 water security questionnaire. As there have been very few revisions, it remains useful for 2020 disclosure to CDP.
Journey to water security
Our water security questionnaire is structured from start to finish as a framework to assist organizations to progress the maturity of their water management and corporate reporting. It presents a journey to water stewardship and water security.
Collecting and disclosing information on management and governance responses to risk and opportunities, as well as the integration of water into long term strategic objectives, provides data for decision making and catalyzes corporate action. This is the value of disclosure.
Water accounting
To progress water security for all and to minimize water-related risks, organizations must eliminate any detrimental impact on water ecosystems and resources. Impact and risk exposure occur as water flows into and out of a company’s boundaries, so CDP’s collects information to determine how well a company understands this flow. Companies are encouraged to account for all their interaction with water, and to minimize that interaction (e.g. through reduced withdrawals, efficiency improvements, or by changing their business activities). This means that CDP seeks more nuanced information than volumetric reductions in freshwater removal or consumption. Most important is that companies have robust monitoring and accounting in place for all aspects of their corporate hydrology, and that they demonstrate an understanding of their dependence on water.
Measurements of withdrawal, discharge and consumption take place as water crosses the company boundary, at either the corporate level or facility level. This makes the concept of the organizational boundary central to our disclosure request at the corporate and the facility level.
Context and geographic scale
Water presents local issues which need to be understood and managed at a local level; typically at river basin, or at least a country level, rather than the corporate level. Investors are increasingly interested in this type of granularity when it comes to assessing the water risk within their portfolios.
Some CDP data users wish to assess an organization’s ability to access the granular data needed for mature water management and sound risk management across all its operations and locations. This is deemed to be best practice. A separate module (W5) requests water accounting data for any facilities exposing the company to substantive water-related risk (note that we do not ask for data for all facilities).
In addition, CDP invites companies to report their risks at the river basin level and several questions include a column so that companies can indicate the location associated with their data. An organization will not have a comprehensive understanding of its risk exposure and the most appropriate response unless it is able to take account of local basin context and conditions. River basin level risk assessment is particularly relevant to a water stewardship approach to securing water resources as collaboration with other basin users and external stakeholders is central to understanding and managing risk.
Reporting risk
CDP provides its data users with information about the inherent risks faced by organizations. This allows them to independently assess the appropriateness and adequacy of the organization's response, and thus the residual risk and resilience of the business.
To provide data users with confidence in their disclosure, responding organizations are encouraged to give a full picture of their approach to risk assessment and how water-related issues have been integrated into their business strategy.
Reporting impacts
When referring to ‘impacts’, some frameworks and standards use the term to mean the effects of a business on communities and ecosystems, such as the CEO Water Mandate Guidelines and the GRI standards. For CDP, this term refers to the effects of water challenges on the business, i.e. ‘business impacts’, be they due to physical, regulatory or market drivers.
CDP asks for information about past water-related impacts on the business and responses to them (in module W2 ‘Business Impacts’). Data users may judge a company’s potential future performance using this data.
Principles of true and fair reporting
The GHG Protocol outlines five principles to ensure a true and fair account of a company’s GHG emissions (see The Greenhouse Gas Protocol: A Corporate Accounting and Reporting Standard developed by the World Resources Institute and the World Business Council for Sustainable Development). CDP suggests that all of these principles be adopted for the purpose of water reporting. These principles are as follows:
- Relevance: Ensure the water use inventory appropriately reflects actual water use and serves the decision-making needs of users – both internal and external to the company.
- Completeness: Account for and report on all water activities within the chosen inventory boundary. Disclose and justify any specific exclusion(s).
- Consistency: Use consistent methodologies to allow for meaningful comparisons of company’s use of water over time.
- Transparency: Address all relevant issues in a factual and coherent manner, based on a clear audit trail. Disclose any relevant assumptions and make appropriate references to the accounting and calculation methodologies and data sources used. Transparently document any changes to the data, inventory boundary, methods, or any other relevant factors in the time series.
- Accuracy: Ensure the quantification of water use is sufficiently accurate to enable users to make decisions with reasonable assurance as to the integrity of the reported information.
Information is considered relevant if it contains the detail that users, both internal and external to the company, need for their decision-making. When considering what to disclose, please identify and report information that is likely to be of use and benefit to the audience requesting it (for example, the investment community and your customers).
Instructions for responding to the water security questionnaire
1. Units: Volumes must be reported in megaliters per year (1 megaliter = 1 million liters or 1,000 m3) in all questions, unless otherwise stated.
2. Values of zero: Entering a 0 (zero) figure implies that a measurement has been made, and the value being disclosed is 0 (zero). Do not enter a zero where you have no data to disclose.
3. River basins: From the drop-down list in specific questions, select the river basin associated with the disclosure, or select “Other, please specify” and provide the name of the river basin. (See CDP’s Appendix: River basin list — and South African Water Management Areas — by country).
CDP’s drop-down list of river basins aligns with the CEO Water Mandate’s Interactive Database of the World’s River Basins. For companies operating in South Africa, the list also includes the nine Water Management Areas for South Africa. You may wish to enter a sub-basin of a listed river basin. In this case use the “Other, please specify” option in the following format: “Putumayo, Amazon”.
For companies withdrawing water from large confined aquifers that do not discharge to the river basin they are located in, e.g. Ogallala aquifer in the United States, please select “Other, please specify” and type in the name of the local aquifer source.
If you do not know the river basin associated with the data you are disclosing, the following tools have the functionality to identify the river basin locations of facilities by typing in geolocation coordinates, for example:
- The CEO Water Mandate Interactive Database of the World’s River Basins
- The Water Footprint Assessment Tool - Water Footprint Network
- The Water Risk Filter - WWF
- The WRI Aqueduct Water Risk Atlas Tool - the World Resources Institute
Sector introduction: Chemicals (CH)
Chemical production is frequently water-intensive and feedstocks, wastes, or products in this sector may pose particular water pollution risks. Water is used primarily for cooling purposes, but also as a raw material in cleaning and transport, as a solvent, and as part of final products. Hazardous chemicals pose a significant threat to water ecosystems.
The activities which define this sector for the CDP water security chemical questionnaire are the production, processing and trading of chemical products.
Two sector-specific topics are included:
- Water intensity metrics; and
- Management approach and procedures for potential water pollutants at different stages of the value chain.
Sector introduction: Electric utilities (EU)
Activities in the electric utilities sector include electricity generation, transmission, distribution and retailing. However, most significant for water risks and impacts is power generation, and this is the focus of the CDP water security questionnaire for this sector. Only organizations with generation activities will be presented with these sector-specific questions.
This sector is heavily dependent on water for cooling; and for electricity generation itself in the case of hydropower. For this reason, plants are often located near bodies of water and organizations rely on access to these resources for the success of their business. The most pressing issues for the sector relate to the impacts of business activities on the hydrological cycle and thermal pollution. Specific forms of water pollution for some fuel types also expose organizations to risks, such as radiation or hydrocarbon contamination. Robust water risk assessment procedures are critical given the long-term nature of investments in the sector.
These data points enable the disclosure of information that is more specific to water-related issues, water efficiency, and pollution management in this sector. Four sector-specific topics are included in the CDP water security questionnaire:
- Organizations are asked to disclose their nameplate capacity by primary power generation source;
- Questions specific for hydropower operations on whether they monitor, the fulfillment of environmental flows and the sediment loadings;
- Water intensity metrics; and
- Management approach and procedures for potential water pollutants.
Sector introduction: Food, beverage & tobacco (FB)
This sector can include a broad range of activities from the production of agricultural products to food retail, and, amongst others, the processing of raw commodities into ingredients, the manufacturing of packaged consumer or industrial food, beverage, or tobacco products (including packaging processes), and the trade and distribution of food products.
Agricultural production and food processing are the most significant activities in terms of water impacts, risks, and opportunities. Water availability, water quality and water pollution due to chemical use and management of animal wastes are issues that can affect an organization’s performance. In addition, the agricultural and manufacturing supply chains for this sector are considered high impact for water.
The CDP water security FB questionnaire is currently targeted at organizations with processing and manufacturing activities, but it also requests information related to any agricultural production activities engaged in directly or within their supply chain. The questions provide information to data users about an organization’s awareness and management of its water dependency related to its direct production and processing activities as well as the commodities it sources.
The sector-specific topics include:
- Production or sourcing of agricultural products in areas of high water stress;
- Water intensity of agricultural products; and
- Management approach and procedures for potential water pollutants at different stages of the value chain.
Note that the manufacturing of personal care and household goods using agricultural commodities is excluded from CDP’s framing of this sector.
Sector introduction: Metals & mining (MM)
Water is used by metals and mining organizations during the in-situ extraction process from the ground, mineral processing, transport of minerals and tailings, storage of tailings, and for other processes such as dust suppression, cooling, and employee requirements on site. Tailings dams are a key environmental risk for this sector requiring strong management procedures.
The CDP water security metals & mining questionnaire focuses on the impacts and risks associated with the principal business activities of the sector, which include the mining and processing of chemical elements and compounds from minerals.
Two sector-specific topics are included:
- Details on water intensity metric; and
- Location and management procedures for tailings dams.
Sector introduction: Oil & gas (OG)
Water is critical to the oil & gas industry. The extraction of hydrocarbons produces large volumes of water. Smart, safe management of this produced water is both a business opportunity and a regulatory necessity (in that water contaminated with hydrocarbons must be properly treated).
In newer exploration and production such as hydraulic fracturing and oil sands, water is often an essential input for the recovery of the resource. Downstream operations such as refining and petrochemicals require water for cooling.
The CDP water security OG questionnaire covers the main activities of the sector: exploration and development, production, refining and the manufacturing and distribution of petro-chemicals; and some data is requested by business division (upstream, downstream and chemicals). Notably, transportation and marketing are not covered as these are not considered water-intensive activities.
Three sector-specific topics are included:
- Total water withdrawals, discharges and consumption by business division (upstream, downstream and chemicals);
- Water intensity metrics; and
- Management approach and procedures for potential water pollutants.
W0 Introduction
Module Overview
This module requests information about your organization’s disclosure to CDP and will help data users to interpret your responses in the context of your business operations, timeframe and reporting boundary.
The information provided here should apply consistently to your responses throughout the questionnaire and be complete and accurate as it may determine response options presented in subsequent modules.
For this reason, you should respond to every question in this module and save your response before accessing the rest of the questionnaire.
Key changes
- Modified question for electric utilities sector (W-EU0.1b): Addition of two new rows and the unit requested in column 4 has changed to GWh. These revisions align with CDP's climate change questionnaire.
- Click here for a list of all changes made this year.
Sector-specific content
- Additional questions for: Chemicals, Electric Utilities, Food, Beverage & Tobacco, Metals & Mining, Oil & Gas.
Pathway diagram - questions
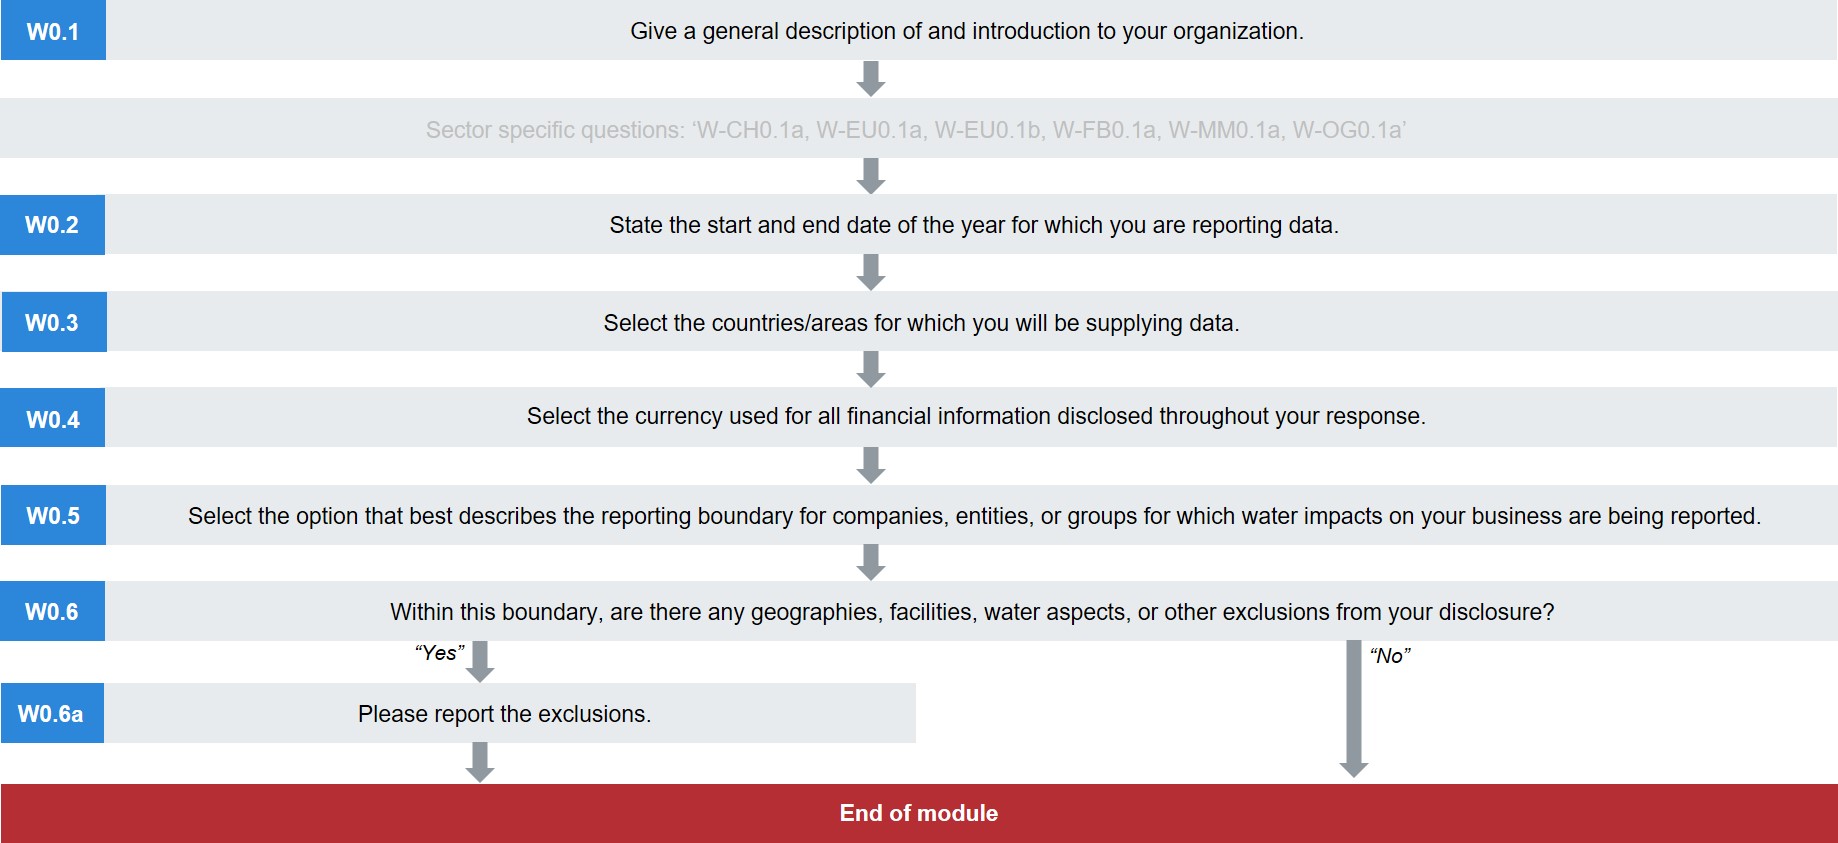
This diagram shows the questions contained in module W0. To access question-level guidance, use the menu on the left to navigate to the question.
Pathway diagram - questions for minimum version questionnaire
This diagram shows the questions contained in module W0 that are included in the minimum version of the questionnaire. To access question-level guidance, use the menu on the left to navigate to the question.

Introduction
(W0.1) Give a general description of and introduction to your organization.
Change from 2019
No change
Rationale
This will help data users interpret your responses within the context of your business activities and sector.
Response options
This is an open text question with a limit of 5,000 characters.
Requested content
General
- Provide information about your operations and business activities to help data users understand your business and how it relates to water risk and corporate strategy. This information provides context for your answers throughout this disclosure.
Explanation of terms
- Organization: Throughout this information request, “your organization” refers collectively to all the companies, businesses, other entities or groups that fall within the definition of your reporting boundary (provided in W0.5). This term is used interchangeably with “your company”, but CDP recognizes that some disclosing organizations may not consider themselves to be, or be formally classified, as “companies”.
(W-CH0.1a) Which activities in the chemical sector does your organization engage in?
Change from 2019
No change
Rationale
Organizations in the chemical sector might engage in various activities, producing various sorts of chemicals; bulk or specialty, organic or inorganic. They all share common challenges in relation to water security, but the processes and technology used might differ among them.
Asking organizations to disclose the activities in which they operate will provide data users with a clearer picture of the organization’s water dependency, risks, and opportunities. This contextual information will help data users to assess whether organizations are aware of and are managing their most critical risks, and if an organization’s policy, strategy, and targets are adequate for their risk exposure.
Response options
Select all that apply from the following options:
- Bulk organic chemicals
- Bulk inorganic chemicals
- Specialty organic chemicals
- Specialty inorganic chemicals
- Other, please specify
Requested content
General
If you select “Other, please specify” provide a label for the activity you engage in.
(W-EU0.1a) Which
activities in the electric utilities sector does your organization engage in?
Question dependencies
- Your response to W-EU0.1a prompts subsequent questions. If your response to W-EU0.1a is amended, data in those dependent questions may be erased. In this case, be sure to re-enter data for all relevant questions.
- The guidance for each question indicates if it is a dependent question.
Change from 2019
No change
Rationale
Each activity listed in W-EU0.1a has a different relation to water resources. Electricity generation is the activity with the most direct implications for water security. Thus, the electric utilities water security questionnaire is focused on this activity.
Response options
Select all that apply from the following options:
- Electricity generation
- Transmission
- Distribution
- Other, please specify
Requested content
General
- If you select “Other, please specify” provide a label for the activity your engage in.
Explanation of terms
- Distribution (electric utilities sector only): The delivery of electricity to retail customers (including homes, businesses, etc.).
- Electricity generation: The process of producing electric energy by transforming other forms of energy.
- Transmission: The movement or transfer of electric energy over an interconnected group of lines and associated equipment between points of supply and points at which it is transformed for delivery to consumers or other electric systems.
(W-EU0.1b) For your electricity generation activities, provide details of your nameplate capacity and the generation for each technology.
Question dependencies
- This question is only presented if you select “Electricity generation” in W-EU0.1a.
- W-EU0.1b prompts linked questions to be presented depending on the response given. The guidance for each question indicates if it is a dependent question.
Change from 2019
Modified question
Rationale
Each power generation source is associated with specific risks and opportunities, requiring specified management procedures and future planning. For example, hydropower will use and impact on water resources in a different way to biomass power generation plants.
Asking organizations to disclose their power sources will provide data users with a clearer picture of the organization’s water dependency, risks, and opportunities. This contextual information will help them assess whether organizations are aware of and managing their most critical risks and if an organization’s policy, strategy, and targets are adequate for their risk exposure.
Connection to other frameworks
SDG
Goal 7: Affordable clean energy
Response options
Please complete the following table:
| Power generation technology |
Nameplate capacity (MW)
|
% of total nameplate capacity
|
Gross electricity generation (GWh)
|
|
Coal – hard
|
Numerical field [enter
a number from 0-999,999,999,999 using a maximum of 2 decimal places]
|
Percentage field [enter
a number from 0-100 using a maximum of 2 decimal places]
|
Numerical field [enter
a number from 0- 999,999,999,999 using a maximum of 2 decimal places]
|
|
Lignite
|
|
|
|
|
Oil
|
|
|
|
|
Gas
|
|
|
|
|
Biomass
|
|
|
|
|
Waste (non-biomass)
|
|
|
|
|
Nuclear
|
|
|
|
| Fossil-fuel plants fitted with carbon capture and storage |
|
|
|
|
Geothermal
|
|
|
|
|
Hydropower
|
|
|
|
|
Wind
|
|
|
|
|
Solar
|
|
|
|
| Marine |
|
|
|
|
Other renewable
|
|
|
|
|
Other non-renewable
|
|
|
|
|
Total
|
|
|
|
Requested content
General
- Respond with a zero (0) value if you do not have operations using that power source to generate electricity. If you have operations with a power source other than the ones provided, consider them under the options “Other renewable” or “Other non-renewable”.
- Biomass: May be combusted on its own or co-fired with other fuels. Please provide aggregated data.
- Waste: Includes tire-derived fuels and other refuse-derived fuels. When reporting in this category, only report the nameplate capacity and gross electricity generation data from the non-biomass fraction. The biomass fraction should be reported under biomass.
- Hydropower: Does not include pumped storage operations for the reporting of nameplate capacity and gross electricity generation. CDP regards it as a form of managing or storing energy rather than primary generation. Note you will be asked to report water accounting volumes for these operations.
Explanation of terms
- Gross electricity generation: The total amount of electric energy produced by generating units and measured at the generating terminal, commonly expressed in gigawatt hours (GWh).
- Nameplate capacity: The maximum rated output of a generator, prime mover, or other electric power production equipment under specific conditions designated by the manufacturer, commonly expressed in megawatts (MW).
- Renewable energy: CDP follows the definition of renewable energy given in the GHG Protocol: "Energy taken from sources that are inexhaustible, e.g. wind, water, solar, geothermal energy and biofuels."
- Carbon capture and storage (CCS): As defined by the IEA, a family of technologies and techniques that enable the capture of carbon dioxide (CO2) from fuel combustion or industrial processes, the transport of CO2 via ships or pipelines, and its storage underground, in depleted oil and gas fields and deep saline formations.
(W-FB0.1a) Which activities in the food, beverage, and tobacco sector does your organization engage in?
Change from 2019
No change
Rationale
Processing and manufacturing of crop and animal products, and indirectly the agricultural production activities, have a close connection with water security. Many organizations in the food, beverage and tobacco sector are vertically integrated.
Each activity listed in W-FB0.1a is associated with specific risks and opportunities, requiring specific management procedures and future planning.
Asking organizations to disclose the activities in which they operate will provide data users with a clearer picture of the organization’s water dependency, risks, and opportunities. This contextual information will help data users assess whether organizations are aware of and managing their most critical risks, and if an organization’s policy, strategy, and targets are adequate for their risk exposure.
Response options
Select all that apply from the following options:
- Agriculture
- Processing/Manufacturing
- Distribution
- Other, please specify
Requested content
General
- If you select 'Other, please specify', provide a label for the activities you engage in.
Explanation of terms
- Agriculture: Agricultural production refers to the creation of raw materials for human consumption and animal feed. Activities include cultivating land, the production of crops, and feeding, breeding, or raising livestock or poultry.
- Distribution (food, beverage & tobacco sector only): Distribution applies to activities involving the transport of agricultural commodities to either domestic or export markets for trading. Distributors are the intermediary between producer and consumer and are relevant actors in food, beverage and tobacco supply chains. Internationally traded agricultural commodities are transported and traded via a range of methods and supply chain stages. These supply chains contain multiple-level distribution channels, which may include wholesalers, retailers, distributors, agents, exporters, and importers.
- Processing/Manufacturing: Processing and manufacturing can be characterized as a series of value adding activities to obtain a finished product from raw materials. Activities can range from simple preservation and operations related to harvesting to the production of final ingredients for food and feed sectors.
(W-MM0.1a) Which activities in the metals and mining sector does your organization engage in?
Change from 2019
Minor change
Rationale
Each activity listed in W-MM0.1a is associated with specific risks and opportunities, requiring specified management procedures and future planning.
Asking organizations to disclose the activities in which they operate will provide data users with a clearer picture of the organization’s water dependency, risks, and opportunities. This contextual information will help them assess whether organizations are aware of and managing their most critical risks, and if an organization’s policy, strategy, and targets are adequate for their risk exposure.
Response options
Please complete the following table. You are able to add rows by using the “Add Row” button at the bottom of the table.
| Activity
|
Details of activity
|
|
Select from:
|
Select all that apply:
- Response drop-down options below table
|
[Add
Row]
Details of activity (column 2)
|
Mining
- Bauxite
- Copper
- Gold
- Platinum group metals
- Silver
- Iron ore
- Nickel
- Zinc
- Lead
- Diamonds
- Other non-ferrous metal mining, please specify
- Other mining, please specify
|
Processing
- Aluminum
- Alumina
- Copper
- Gold
- Platinum group metals
- Silver
- Nickel
- Zinc
- Lead
- Other ferrous metals processing, please specify
- Other non-ferrous materials processing, please specify
|
Requested content
Details of the activity (column 2)
- If you select one of the “Other” options, please provide a label for the activity you engage in.
(W-OG0.1a) Which business divisions in the oil & gas sector apply to your organization?
Question dependencies
- Your response to W-OG0.1a prompts subsequent questions. If your response to W-OG0.1a is amended, data in those dependent questions may be erased. In this case, be sure to re-enter data for all relevant questions.
The guidance for each question indicates if it is a dependent question.
Change from 2019
Minor change
Response options
Select all that apply from the following options:
- Upstream
- Midstream/Downstream
- Chemicals
- Other, please specify
Rationale
Each activity listed in W-OG0.1a is associated with specific risks and opportunities, requiring specified management procedures and future planning.
Asking organizations to disclose the business divisions in which they operate will provide data users with a clearer picture of the organization’s water dependency, risks, and opportunities. This contextual information will help data users to assess whether organizations are aware of and managing their most critical risks, and if an organization’s policy, strategy, and targets are adequate for their risk exposure.
Requested content
General
- If you select “Other, please specify” provide a label for the business division in the text field provided.
Explanation of terms
- Upstream (Oil & gas sector only): The exploration, development, and production of oil and gas (IPIECA, 2016 Guidance on voluntary sustainability reporting).
- Midstream (Oil & gas sector only): The transportation and distribution of crude oil and natural gas.
- Downstream (Oil & gas sector only): The refining, processing, distribution, and marketing of products derived from oil and gas, including service stations operations (IPIECA, 2016 Guidance on voluntary sustainability reporting).
- Chemicals (Oil & gas sector only): The manufacture, distribution and marketing of chemical products derived from oil and gas (petrochemicals; IPIECA, 2016 Guidance on voluntary sustainability reporting).
(W0.2) State the start and end date of the year for which you are reporting data.
Change from 2019
No change
Rationale
This will help data users interpret your responses in relation to the timeframe reported.
Response options
Please complete the following table:
| Start date
|
End date
|
|
From: [MM/DD/YYYY]
|
To: [MM/DD/YYYY]
|
Requested content
General
- Apply this reporting year to your answers for the entire questionnaire.
- The current reporting year is the most recent 12-month period for which data is reported.
- The investment community generally prefers a company's disclosure period to match the fiscal year for their financial jurisdiction. This facilitates the assessment of environmental performance data in alignment with their financial performance data.
- CDP recommends companies provide a year for which they have complete data for their response if possible. If you do not have data for the entirety of your reporting year, you have the option to extrapolate or estimate your data to cover the entire reporting year.
(W0.3) Select the countries/areas for which you will be supplying data.
Change from 2019
Minor change
Rationale
This will help data users interpret your responses.
Response options
Please complete the following table:
| Country/Area |
|
Select all that apply:
- Country/area drop-down list
|
Requested content
General
- Select all countries/areas in which you operate from the drop-down list provided.
(W0.4) Select the currency used for all financial information disclosed throughout your response.
Question dependencies
- All disclosed financial figures throughout the questionnaire will be in the same currency. The currency reported in this question will apply to all reported figures throughout this request.
Change from 2019
No change
Rationale
CDP encourages companies to report financial figures associated with impacts, risks, and opportunities. Establishing a single currency will facilitate the collection of comparable financial information. This will benefit investors and other data users when assessing the costs and benefits reported by your organization.
Response options
Please complete the following table:
Requested content
General
- The currency you select will be applied to all financial information and metrics reported in your disclosure.
- For example, if you select USD ($) here, this will determine the currency applied to the figure you give for ‘Financial impact’ reported in W2.1a.
(W0.5) Select the option that best describes the reporting boundary for companies, entities, or groups for which water impacts on your business are being reported.
Change from 2019
No change
Rationale
This will help data users interpret how your responses relate to your business operations.
Response options
Select one of the following options:
- Companies, entities or groups over which financial control is exercised
- Companies, entities or groups over which operational control is exercised
- Companies, entities or groups in which an equity share is held
- Other, please specify
Requested content
General
- References in the questionnaire to “your organization” are to the entities within your organizational boundary for which you are providing information.
- This question asks you to define the organizational boundary for which you are supplying data. This indicates the way your organizational entities such as groups, businesses, and companies have been identified for inclusion within your reporting boundary. Please apply this definition consistently when responding to questions.
- The options in the drop-down list for this question are based on the GHG Protocol Corporate Standard:
- Financial control: An organization has financial control over an operation if it has the ability to direct the financial and operating policies of the operation with a view to gaining economic benefits from its activities. Generally, an organization has financial control over an operation for GHG accounting purposes if the operation is treated as a group company or subsidiary for the purposes of financial consolidation.
- Operational control: An organization has operational control over an operation if it or one of its subsidiaries has the full authority to introduce and implement its operating policies at the operation.
- Equity share: Under the equity share approach, a company accounts for GHG emissions from operations according to its share of equity in the operation. The equity share reflects the economic interest, which is the extent of rights a company has to the risks and rewards flowing from an operation. Typically, the share of economic risks and rewards in an operation is aligned with the company’s percentage ownership of that operation, and equity share will normally be the same as the ownership percentage. Where this is not the case, the economic substance of the relationship the company has with the operation always overrides the legal ownership form to ensure the equity share reflects the percentage of economic interest. The principle of economic substance taking precedence over legal form is consistent with international financial reporting standards.
- Other, please specify: select this only if none of the other options apply. If you select this option, provide a label in the text field provided.
- Note: throughout this information request, when calculating figures for corporate level reporting take a “consolidation approach”, unless stated otherwise. The information you provide throughout the information request should be one “consolidated” result, covering all of the companies, entities, or businesses within your reporting boundary and aggregating more granular data at facility/business level, for example. Please consistently apply this organizational boundary when responding to questions unless specifically asked for data about another category of activities.
- Note: in W0.6a you have the opportunity to explain any data you have excluded from the reporting boundary you select here.
Explanation of terms
- Company: throughout this information request, “your company” refers collectively to all the companies, businesses, organizations, other entities or groups that fall within you’re the definition of your reporting boundary. It is used interchangeably with "your organization".
- Organization: this term is used interchangeably with “your company”. CDP recognizes that some disclosing organizations may not consider themselves to be, or be formally classified, as “companies”.
- Reporting boundary: this determines which organizational entities, such as groups, businesses and companies, are included in or excluded from your disclosure. These may be included according to your financial control, operational control, equity share, or another measure.
Additional information
- Determining the organizational boundary: When determining the organizational boundary for reporting purposes, CDP recommends that companies consult their legal or accounting advisors. For more guidance on determining reporting boundaries, particularly where joint ventures or complex operational structures are concerned, refer to the GHG Protocol. Although the protocol refers to GHG emissions reporting, the general definitions may be applied to water reporting.
- The GHG Protocol defines two approaches: the control approach and the equity share approach, which will lead not only to different organizational boundaries, but distinct ways of consolidating the figures at the corporate level.
- Control approach: An organization measures the volume of its water withdrawals/discharges from operations over which it has financial or operational control. The following text is adapted from the GHG Protocol to refer to water:
- An organization has financial control over an operation if it has the ability to direct the financial and operating policies of the operation with a view to gaining economic benefits from its activities. Generally, an organization has financial control over an operation for water accounting purposes if the operation is treated as a group company or subsidiary for the purposes of financial consolidation. An organization has operational control over an operation if the organization or one of its subsidiaries has the full authority to introduce and implement its operating policies at the operation.
- Equity share approach: Organizations can also report their water data based on their economic share. The following text is adapted from the GHG Protocol to refer to water:
- Under the equity share approach, a company accounts for its water data from operations according to its share of equity in the operation. The equity share reflects the economic interest, which is the extent of rights a company has to the risks and rewards flowing from an operation. Typically, the share of economic risks and rewards in an operation is aligned with the company’s percentage ownership of that operation, and equity share will normally be the same as the ownership percentage. Where this is not the case, the economic substance of the relationship the company has with the operation always overrides the legal ownership form to ensure the equity share reflects the percentage of economic interest. The principle of economic substance taking precedence over legal form is consistent with international financial reporting standards.
- The table below clarifies how water accounting data should be consolidated and reported in certain situations. The table below is based on page 19, Chapter 3 of the GHG Protocol (Revised Edition). It has been adapted to refer to water accounting instead of GHG accounting.
|
Accounting category
|
Financial accounting definition
|
Accounting for GHG emissions according to the GHG Protocol Standard:
Based on equity share
|
Accounting for GHG emissions according to the GHG Protocol Standard:
Based on financial control
|
Group companies/subsidiaries
|
The parent company has the ability to direct the financial and operating policies of the company with a view to gaining economic benefits from its activities. Normally, this category also includes incorporated and non-incorporated joint ventures and partnerships over which the parents company has financial control.
|
Equity share of volumes of water withdrawn/ discharged/etc.
|
100% of volumes of water withdrawn/ discharged/etc.
|
Associated/affiliated companies
|
The parent company has significant influence over the operating and financial policies of the company, but does not have financial control. Normally, this category also includes incorporated and non-incorporated joint ventures and partnerships over which the parent company has significant influence, but not financial control. Financial accounting applies the equity share method to associate/affiliated companies, which recognizes the parent company’s share of the associate’s profits and net assets.
|
Equity share of volumes of water withdrawn/ discharged/etc.
|
0% of volumes of water withdrawn/ discharged/etc.
|
Non-incorporated joint ventures/ partnerships/ operations where partners have joint financial control
|
Joint ventures/ partnerships/ operations are proportionally consolidated, i.e., each partner accounts for their proportionate interest of the joint venture’s income, expenses, assets and liabilities.
|
Equity share of volumes of water withdrawn/ discharged/etc.
|
Equity share of volumes of water withdrawn/ discharged/etc.
|
Fixed asset investments
|
The parent company has neither significant influence nor financial control. This category also includes incorporated and non-incorporated joint ventures and partnerships over which the parent company has neither significant influence nor financial control. Financial accounting applies the cost/ dividend method to fixed asset investments. This implies that only dividends received are recognized as income and the investment is carried at cost.
|
0%
|
0%
|
Franchises
|
Franchises are separate legal entities. In most cases, the franchiser will not have equity rights or control over the franchise. Therefore, franchises should not be included in consolidation of GHG emissions data. However, if the franchiser does have equity right or operational/ financial control, then the same rules for consolidation under the equity or control approaches apply.
|
Equity share of volumes of water withdrawn/ discharged/etc.
|
100% of volumes of water withdrawn/ discharged/etc.
|
(W0.6) Within this boundary, are there any geographies, facilities, water aspects, or other exclusions from your disclosure?
Change from 2019
No change
Rationale
CDP seeks to share comprehensive and representative water data. If companies do need to exclude areas of their business from their disclosure, data users must be informed of the exclusions as this may affect their analysis.
Response options
Select one of the following options:
Requested content
General
- References throughout the questionnaire to “your organization” include all the entities within your reporting boundary for which you are providing information. Please apply this logic consistently when responding to questions. However, you may exclude particular geographies, business activities, and/or small facilities for which it is difficult to gather data when water impacts are sufficiently small. This also applies to selected water inputs/outputs.
- In all cases, the following principles of relevance and transparency must apply to all disclosures (adapted from the GHG Protocol):
- Relevance: Ensure the disclosure appropriately reflects the water use of the company and serves the decision-making needs of users – both internal and external to the company.
- Transparency: Address all relevant issues in a factual and coherent manner, based on a clear audit trail. Disclose any relevant assumptions and make appropriate references to the accounting and calculation methodologies and data sources used.
- Any groups, companies, businesses or organizations falling within your organizational boundary but not included in your disclosure should be reported in W0.6a.
- Note that in some questions, e.g. in the facility level water accounting section, we will ask you to provide data only for facilities where significant water risk has been identified, rather than all facilities within your reporting boundary.
Explanation of terms
- Facilities: “Facilities” may be used throughout this questionnaire as a broad term and not restricted to a particular site or grouping of fixed buildings and factories. For example, if your organization is in the extractive industries you might normally collate business information for assets or business units, and so you may wish to define ‘facility’ information in this way.
Additional information
The GHG Protocol states that an acknowledgement of all exclusions should be made each year to enhance transparency despite disclosure of the same exclusion in previous years. This ensures all data users are always aware of what data has been included in your response.
For further information on allowable exclusions, please refer to the GHG Protocol and the CDP 2020 Water Scoring Methodology.
(W0.6a) Please report the exclusions.
Question dependencies
- This question only appears if you select “Yes” in response to W0.6.
Change from 2019
No change
Rationale
CDP seeks to share comprehensive and representative water data. Data users need to be informed of exclusions that may affect their analysis.
Response options
Please complete the following table. You are able to add rows by using the “Add Row” button at the bottom of the table.
| Exclusion
|
Please explain
|
|
Text field [maximum of 2,500 characters]
|
Text field [maximum of 2,500 characters]
|
[Add Row]
Requested content
General
- Identify and explain when any of the following are being excluded from your disclosure:
- Geographical locations, e.g. low water usage or data limitations may make reporting infeasible for operations in a country or region;
- Activities, e.g. a product line, type of business process, or type of supplier, may be excluded due to limited data or reporting feasibility;
- Facilities may be excluded due to recent mergers, acquisitions and divestitures, outsourcing and in-sourcing of activities (smaller facilities for which it is not currently possible to track water use may also be considered for exclusion); and
- Water inputs and outputs, e.g. a company may use rainwater at some facilities but not track the quantity or quality of this source in which case the source may be considered for exclusion.
- Any groups, companies, businesses or organizations that fall within your organizational boundary but are not included in your disclosure.
- For all exclusions, clearly explain why they are not included in your disclosure. Provide a reasonable explanation as to how you arrived at this exclusion; e.g., as a result of a high-level risk scanning exercise.
Example response
| Exclusion
|
Please explain
|
| Distribution Centers
|
Our company has not yet implemented a system to track the water impact in its distribution centers. We expect this to be a small fraction of our total water consumption and provide little exposure to water risk. This will be incorporated from 2019.
|
| Offices
|
Small leased office spaces (fewer than 50 employees) where water use is minimal. It is provided through the lease and managed by our landlord.
|
W1 Current state
Module Overview
The promotion of water security for all is supported when companies:
- Reduce their dependency on fresh water sources and track their progress; this is additionally important where fresh water scarcity may pose water quality risks and impacts.
- Collect and share volumetric data on their interactions with water resources.
- Consider water throughout their value chain, beyond the fence-line of their direct operations.
Clean freshwater is becoming increasingly scarce, and this can impact operations relying on large volumes of water – either through absolute availability or through rising costs for water. The information in this module allows CDP data users to build a picture of the dependence of your direct operations and your wider value chain on sufficient amounts of water of a particular quality, currently and for future growth, and where in the value chain most dependence on water lies. To understand an organization’s resilience, it is important to understand the potential to reduce reliance on freshwater sources.
The questions allow your company to demonstrate how well it understands its corporate hydrology by providing information on the monitoring of relevant water aspects, and volumetric data on withdrawals - including withdrawals in water stressed areas, discharges, consumption, and recycling. CDP also requests companies to comment on their projections for water accounting data.
The module also asks about your engagement activity around water in your value chain and a rationale for it. In regions where water sources are highly restricted, your organization’s water consumption patterns can influence relations with other stakeholders and your access to water can be dependent on those relationships. Engagement can also identify opportunities, such as innovation in your supply chain to reduce dependency and in product design to reduce water-related impacts.
Investors use this current state information to better assess the adequacy, robustness and relevance of your water governance, management and stewardship activities, as well as your disclosure of your water risks and opportunities.
The information requested in sections W1.1 and W1.2 may help companies with their climate-related disclosures in line with the TCFD recommendations which recognise that a reliance on the availability of water exposes a company to climate-related, financial risk.
Note:
- Throughout the water security questionnaire, CDP has broadened the scope of questions about the supply chain to include other phases of the value chain. This will be particularly relevant to companies whose activities may be constrained or otherwise affected by water related issues beyond their direct operations and supply chains. It reflects a widening of company focus to, and greater investor interest in, risk exposure, opportunities and impacts within the value chain.
- W1.2 requests water accounting information at the corporate level. Module 5 asks for facility-level volumetric data - only for facilities that expose your organization to substantive financial or strategic risks, and so it is requested after you have reported your risk exposure in W4.
Disclosure note
CDP’s approach to reporting water accounting data
- When reporting volumetric data please read the guidance for each question as well as the CDP Technical Note on water accounting definitions.
- To reduce their impact on water ecosystems and resources as well as their need to manage water-related risks, organizations should minimize and be able to account for all their interaction with water. For this reason, CDP’s focus is the collection of information to determine how well a company understands the flow of water into and out of its boundaries, and whether they have robust monitoring and accounting in place for all aspects of their water use.
- Definitions: CDP is looking for comparable data, reported against a standard methodology/definition. To ensure the quality of our data and a fair scoring methodology, CDP definitions should be used for all disclosures. This is particularly relevant where there is a lack of standardization. Companies must not provide water accounting data that does not align with the definitions given. Please refer to CDP’s Technical Note on water accounting.
- Units: Volumes must be reported in megaliters per year (1 megaliter = 1 million liters or 1,000 m3) in all questions, unless otherwise stated.
- Blank cells: Please ensure when responding to these water accounting questions that cells are only intentionally left blank if you have no data to disclose. Blank cells are interpreted as non-disclosure, i.e. information is not available due to lack of measurement or choosing not to disclose, and are therefore awarded no points by the scoring methodology.
- Values of zero: entering a zero implies a measurement has been made, and the value is zero. For example, a value of zero consumption reported indicates that no water is incorporated into products or waste products or lost by evaporation from the company. Do not use a zero to indicate a lack of data. If a company enters a zero for discharge, it should provide an explanation.
- Data accuracy: CDP recognizes that there may be uncertainty linked to water accounting information that could impact on data accuracy. Uncertainty can arise from data gaps, assumptions, metering/measurement constraints including equipment accuracy, data management, etc. The emphasis should be on reporting transparently and on providing an explanation for why reported data is uncertain or wholly or partially estimated or modelled, rather than sourced from direct measurements.
Key changes
- Questions removed from 2019 questionnaire: W1.2j, W-MM1.2j, and W-OG1.2j on recycling and reuse volumes. The volumetric information provided limited insight on impact reduction and the practices can be reported elsewhere in the questionnaire.
- Modified question (W1.2): One row removed - “Water withdrawals - volumes from stressed areas” - due to new data point in W1.2d.
- Modified question (W1.2d): New column added - “Withdrawals are from areas with water stress” - to clarify the data request.
- Modified guidance (W1.2d): “Baseline water depletion” included as an optional parameter for determining water stress (aligns with the WRI Aqueduct tool).
- Modified guidance (W1.2b, W1.2h, W1.2i): Requested content clarified for "anticipated future trends".
- New response options (W1.4b column 2): Allows organizations to demonstrate that they are driving impact reduction in their supply chains.
- Click here for a list of all changes made this year.
Sector-specific content
- Additional questions presented in section W1.1 for Food, Beverage & Tobacco, and section W1.2 for Electric Utilities, Oil & Gas, Food, Beverage & Tobacco.
- Additional response options presented in W1.2 for Oil & Gas and Metals & Mining.
- Section W1.3 requests water intensity information only for companies responding to CDP sector questions.
- Additional drop-down options presented in W1.4b for Food, Beverage & Tobacco.
Pathway diagram - questions
This diagram shows the questions contained in module W1. To access question-level guidance, use the menu on the left to navigate to the question.
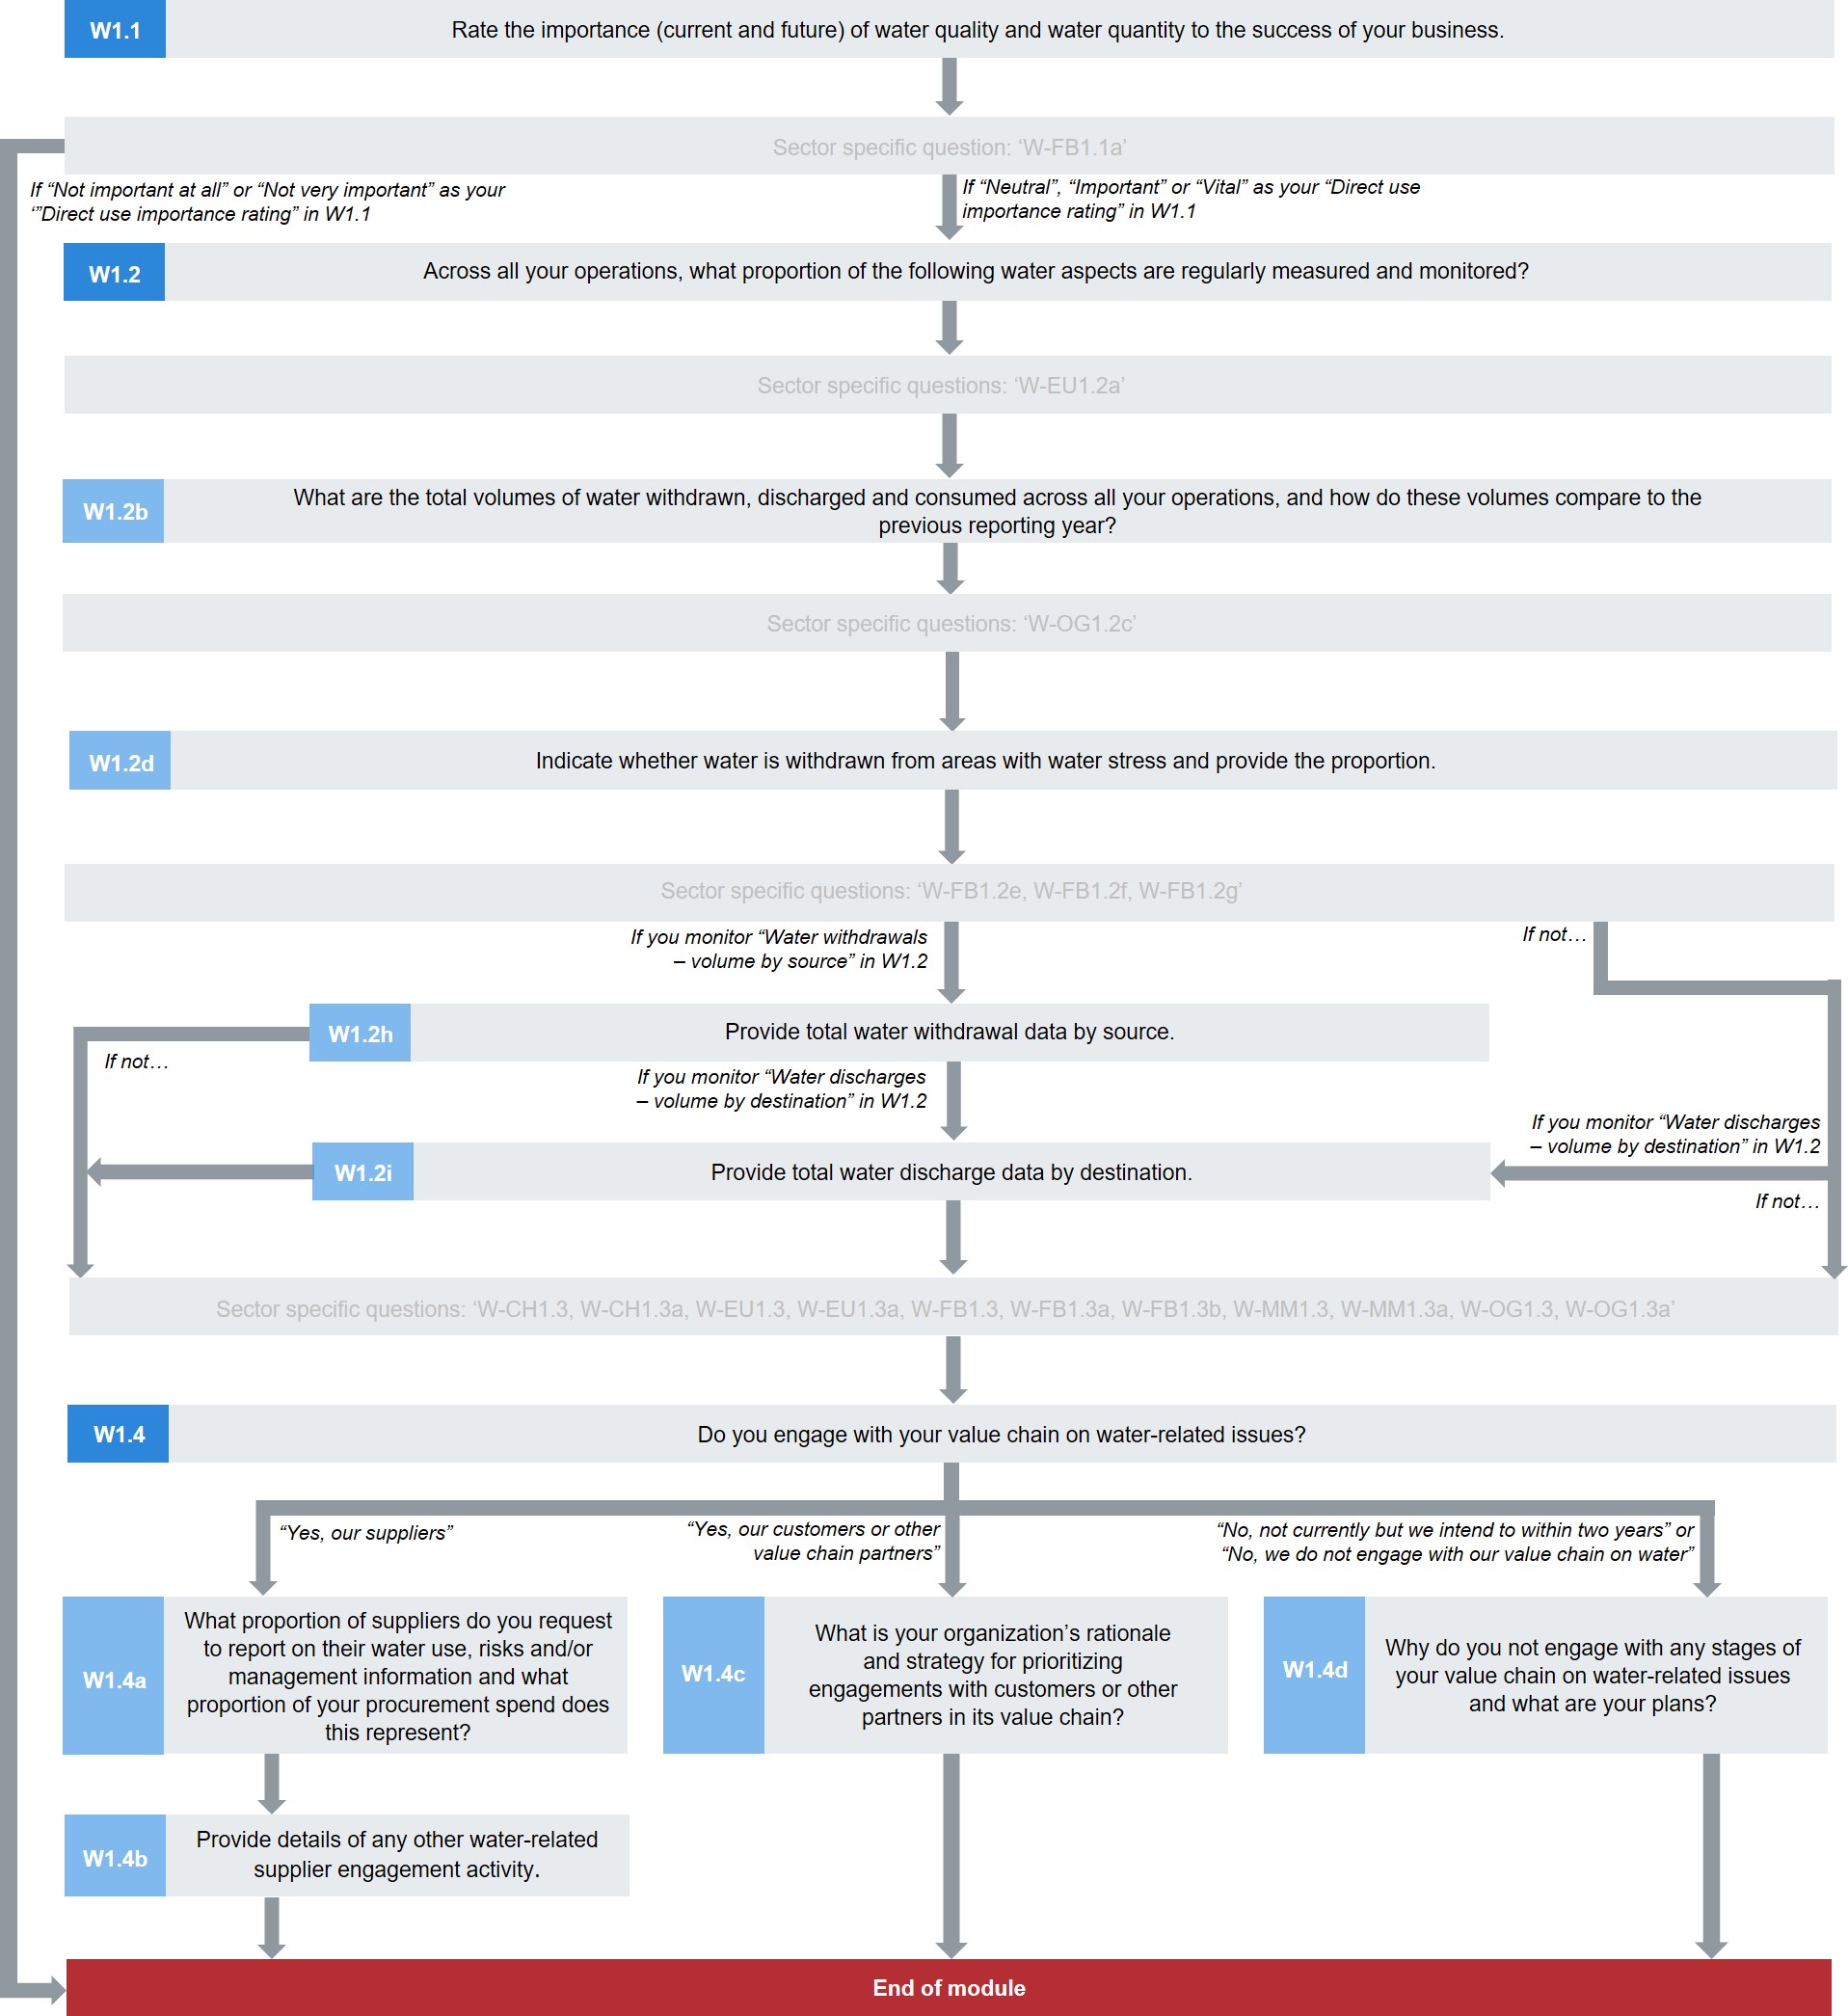
Pathway diagram - questions for minimum version questionnaire
This diagram shows the questions contained in module W1 that are included in the minimum version of the questionnaire. To access question-level guidance, use the menu on the left to navigate to the question.
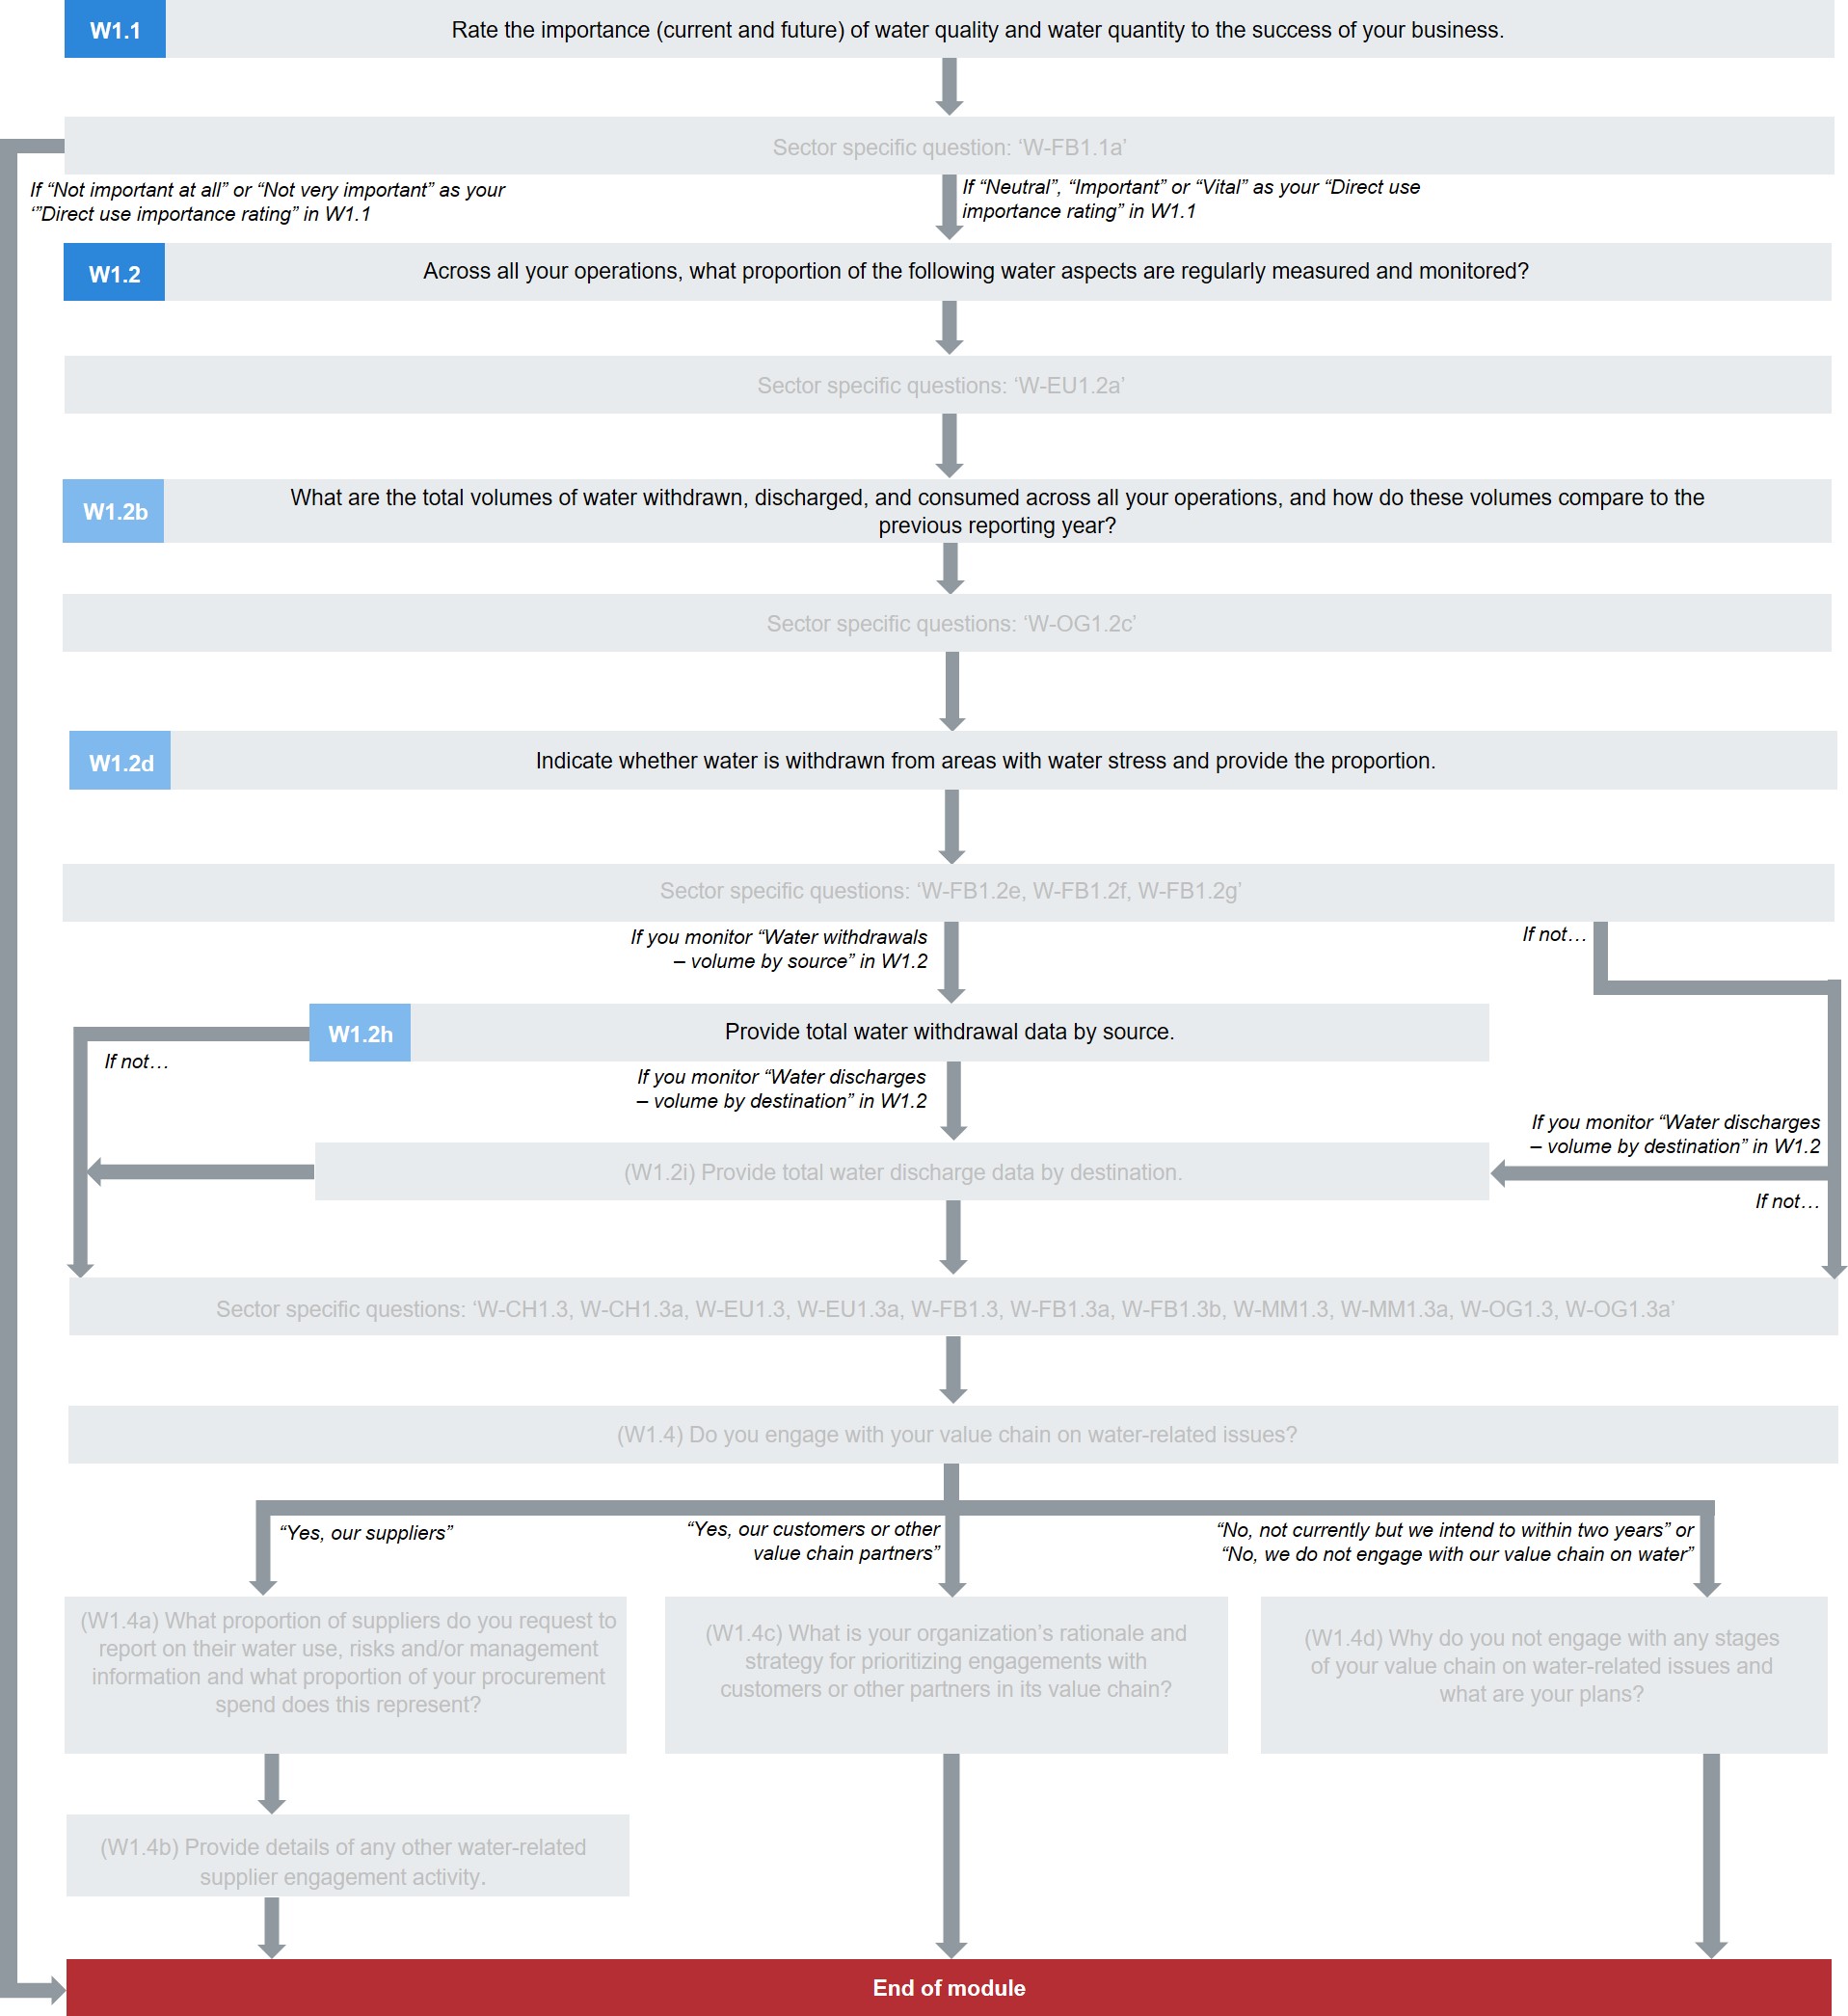
Dependence
(W1.1) Rate the importance (current and future) of water quality and water quantity to the success of your business.
Question dependencies
- Your response to W1.1 prompts subsequent questions. If your response to W1.1 is amended, data in those dependent questions may be erased. In this case, be sure to re-enter data for all relevant questions. The guidance for each question indicates if it is a dependent question.
Change from 2019
No change
Rationale
A dependence on good quality freshwater resources may pose a risk to companies where there is social, ecological or economic competition for those resources, or an otherwise unreliable supply. An ability to switch to using lower grade water mitigates that dependence, could improve a company’s water security and reduces pressure on freshwater sources.
This question asks companies to disclose their dependence on access to good quality freshwater as this could limit their ability to switch to using lower quality water without incurring a cost to the business through having to treat the water, for example.
Importance is independent of absolute volumes. For example, a company could require only a small amount of water used for an integral part of production for which access to alternative water sources could be restricted due to other local demands. The relative importance of access to that small volume would be considered as high.
Assessing how important access to good and lower quality water is to your organization is the first step to deciding how water-related issues may potentially present a risk to your company.
This information helps investors to understand why you have disclosed certain risks later in this questionnaire. It also demonstrates the ways that water could potentially constrain or enhance your business strategy.
Response options
Please complete the following table:
| Water quality and quantity
|
Direct use importance rating
|
Indirect use importance rating
|
Please explain
|
|
Sufficient amounts of good quality freshwater available for use
|
Select from:
- Not important at all
- Not very important
- Neutral
- Important
- Vital
- Have not evaluated
|
Select from:
- Not important at all
- Not very important
- Neutral
- Important
- Vital
- Have not evaluated
|
Text field [maximum 2,000 characters]
|
|
Sufficient amounts of recycled, brackish and/or produced water available for use
|
|
|
|
Requested content
General
- When answering this question, consider your organization’s dependence on good quality freshwater versus lower quality water and how this has changed or might change over time.
- ‘Good quality freshwater’ is any water used for your organization’s activities that must be of a quality requiring only minimal treatment to be acceptable for domestic, municipal or agricultural uses or safe for freshwater ecosystems. A company is considered dependent on this if it is not possible to use a lower quality water instead.
- ‘Importance’ should be considered in terms of the need for secure access to, and the availability at certain times of, an amount of water (large or small) that is sufficient for your operations; and not simply in terms of your net water consumption. So, activities involving large volumes of water would be expected to answer “Vital” or “Important” because large withdrawals would be required, even if discharges were also large resulting in relatively low consumption.
- Metals & mining sector only: Organizations dependent on freshwater of low quality (categories 2 and 3 of the Water Accounting Framework from the Mineral Council of Australia) should indicate this dependency in row 2 (…recycled, brackish and/or produced water sources). Dependency on low rather than high quality water reduces pressure on good quality freshwater sources.
Importance rating (columns 2-3)
- CDP recognizes that the importance ratings are subjective. The following description of the categories aims to assist with comparability rather than providing rigid definition and general examples are given.
- Vital: Water is of ‘vital’ importance when future production could be compromised, and output and finances affected at the corporate level, if the water supply was insufficient – either in terms of quantity and quality - in the locations of your production processes or your value chain. When water is vital for product use, scarcity may curtail sales or have reputational implications.
- Important: access to sufficient volumes and good quality water is required in direct or indirect operations, though these operations may not be water intensive and/or diversification of supply chain could mediate risk.
- Neutral: water quality can be poor as long as enough water is available.
- Not very important: water is not a key component of operations directly or indirectly but a local issue e.g. drought or poor water quality, or localized flooding may impact on local operations or supply chain. However, this would not affect the business overall.
- Not important at all: water is not a key component of operations directly or indirectly and water quantities in particular are of less concern.
- Have not evaluated: have not evaluated how much water or the quality of water required for operations and/or value chain.
- When considering the importance rating for indirect use, you should include the importance of water in all stages of your value chain that are upstream and downstream of your direct operations; e.g. within your supply chain, and also for the use/consumption of your products or services.
Please explain (column 4)
- State the primary use of water for both the direct and indirect parts of your value chain, for both good quality freshwater and lower quality options. Describe how water use is distributed across the value chain; giving percentages if possible.
- Describe how you have determined your stated importance ratings for water quality and quantity for both good quality and lower quality options.
- Specify how future water dependency is likely to differ from the current, and provide an explanation for your answer.
Explanation of terms
- Direct operations: An organization’s operations include anything it does itself for the purpose of producing goods and services and maintaining the functionality of the business. This covers any internal supply chains between the organization’s business units. For example, a business unit within a company that supplies components to another business unit within the company would be considered part of the organization’s direct operations.
- Direct water use: Includes all water that is used for activities within your organization (as defined by your ‘reporting boundary’).
- Good quality freshwater: Any water used for your organization’s activities that must be of a quality requiring only minimal treatment to be acceptable for domestic, municipal or agricultural uses or safe for freshwater ecosystems. A company is considered dependent on this if it is not possible to use a lower quality water instead. Water quality can refer to physical, chemical, biological, and organoleptic properties of water. ‘High quality’ fresh water sources, of potable standard, are typically characterized as having concentrations of dissolved solids less than 1,000 mg/l.
- Indirect water use: Includes all water use that takes place anywhere within your value chain outside your direct operations and direct control. This includes water use upstream of your direct operations, use such as by your suppliers, and downstream, for example water needed for the use of your products.
- Sufficient amounts of recycled, brackish and/or produced water: This refers to any low quality water requiring significant treatment to be acceptable for human consumption or other purposes, and for which the source can be easily substituted. Water quality can refer to the physical, chemical, biological, and organoleptic properties of water.
- Water availability: The natural runoff (through groundwater and rivers) minus the flow of water that is required to sustain freshwater and estuarine ecosystems and the human livelihoods and well-being that depend on these ecosystems. Water availability typically varies within the year and also from year to year. Water availability might be reduced by decreases in both the water quantity and quality of water resources (Adapted from CEO Water Mandate's "Corporate Water Disclosure Guidelines").
- Water quality: Refers to the physical, chemical, biological and organoleptic (taste-related) properties of water (see CDP’s definition for “Good quality freshwater”) (adapted from CEO Water Mandate's "Corporate Water Disclosure Guidelines").
(W-FB1.1a) Which water-intensive agricultural commodities that your organization produces and/or sources are the most significant to your business by revenue? Select up to five.
Change from 2019
No change
Question dependencies
-
Your response to W-FB1.1a prompts subsequent questions. If your response to W-FB1.1a is amended, data in those dependent questions may be erased. In this case, be sure to re-enter data for all relevant questions. The guidance for each question indicates if it is a dependent question.
Rationale
This information enables data users to understand how reliant the business is on produced or sourced commodities requiring relatively large quantities of water or that have significant polluting potential. It signals exposure to risk where these commodities are not produced sustainably or managed carefully.
Revenue has been chosen as the metric for significance as it is already calculated by many organizations and provides a clear message to investors about an organization’s financial dependency on the commodity. Although this metric has limitations, due to yearly fluctuations in currency for example, a single metric can help data users with comparability.
The commodities selected in this question will apply to response options in subsequent questions.
Response options
Please complete the following table. You are able to add rows by using the “Add Row” button at the bottom of the table.
| Agricultural commodities
|
% of revenue dependent on these agricultural commodities
|
Produced and/or sourced
|
Please explain
|
|
Select from:
- Cattle products
- Maize
- Palm oil
- Rice
- Soy
- Sugar
- Tobacco
- Other, please specify
|
Select from:
- Don't know
- Less than 10%
- 10-20
- 21-40
- 41-60
- 61-80
- More than 80%
|
Select from:
|
Text field [maximum 1,500 characters]
|
[Add Row]
Requested content
General
- When answering this question, please consider the dependency of your revenue on water-intensive commodities. Of all your water-intensive commodities, produced or sourced, please report the five most important by revenue. Further questions relating to these commodities will be presented.
- You should report at least one commodity, even if you do not consider it to be water intensive.
- Organizations are expected to report information for 5 products. If reporting 5 products is not possible, an explanation should be provided in column 4 (Please explain).
Agricultural commodities (column 1)
- Please add rows to select your five main water-intensive crops/products according to the percentage of your total revenue associated with them. This may be based on measured or estimated revenue dependency.
- If the list does not contain any, or contains less than five, of your produced or sourced water intensive commodities, please select “Other, please specify” and give the name of a revenue-significant, water-intensive crop or animal product produced or sourced by your organization. Provide a label for the agricultural commodity in the text field provided.
- If you do not consider any of your revenue-dependent commodities to be water intensive, please report the most relevant crops or animal products that account for a relatively high volume of water demand in your direct operations or supply chain. You should report at least one product.
% of revenue dependent on these agricultural commodities (column 2)
- If your organization does not measure the revenue associated with the produced or sourced agricultural commodities reported, you may provide an estimate and explain this in column 4 (Please explain).
Please explain (column 4)
- If you do not produce or source any, or less than 5, of the commodities listed in column 1 and you selected “Other, please specify” to report a different commodity, you may use this space to describe the commodity and explain why it has been included, e.g. because it is revenue significant and accounts for a high proportion of your water demand.
- If you consider that none of your commodities are water intensive, provide an explanation, including whether your organization has evaluated this.
- For each crop commodity, you may state whether it is rainfed or irrigated, or in what proportion.
Explanation of terms
- Water intensive crops/animal products: This is a relative concept relating to the amount of water required to produce a crop/animal product. There is no standard threshold for specifying when a crop or animal product is water intensive.
- Revenue: Income arising in the course of an entity's ordinary activities (less discounts, allowances and returns) - before deducting costs for the goods/services sold and operating expenses to arrive at profit (based on the International Financial Reporting Standard).
Company-wide water accounting
(W1.2) Across all your operations, what proportion of the following water aspects are regularly measured and monitored?
Question dependencies
This question only appears if you select “Neutral” “Important” or “Vital” as your “Direct use importance rating” in response to W1.1.Your response to W1.2 will determine which subsequent questions are presented. If your response to W1.2 is amended, data in those dependent questions may be erased. In this case, be sure to re-enter data for all relevant questions.If you select “Not monitored” or “Not relevant” in response to W1.2, you will not be able to disclose associated volumetric data in this section. The guidance for each question indicates if it is a dependent question.
Change from 2019
Modified question
Rationale
This question allows your company to indicate to investors, customers, and other data users the extent to which it monitors different aspects of its water use. Comprehensive water accounting is a first step in understanding the importance of water to your business and any potential water-related impacts to your business. This data may also be relevant to a company’s regulatory compliance.
Connection to other frameworks
CEO Water Mandate
Current state: Performance
Response options
Please complete the following table:
| Water aspect
|
% of sites/facilities/operations
|
Please explain
|
|
Water withdrawals – total volume
|
Select from:
- Not monitored
- Less than 1%
- 1-25
- 26-50
- 51-75
- 76-99
- 100%
- Not relevant
|
Text field [maximum 1,000 characters]
|
|
Water withdrawals – volumes by source
|
|
|
|
[METALS & MINING SECTOR ONLY] Entrained water associated with your metals & mining sector activities - total volume
|
|
|
|
[OIL & GAS SECTOR ONLY] Produced water associated with your oil & gas sector activities - total volume
|
|
|
|
Water withdrawals quality
|
|
|
|
Water discharges – total volume
|
|
|
|
Water discharges – volumes by destination
|
|
|
|
Water discharges – volumes by treatment method
|
|
|
|
Water discharge quality – by standard effluent parameters
|
|
|
|
Water discharge quality – temperature
|
|
|
|
Water consumption – total volume
|
|
|
|
Water recycled/reused
|
|
|
|
The provision of fully-functioning, safely managed WASH services to all workers
|
|
|
Requested content
- Note: organizations responding to an electric utilities, metals & mining or oil & gas sector request should refer to additional sector-specific guidance on this question at the end of the "Requested content" section.
General
- This question seeks a company-wide response about your monitoring of various water aspects. “Across all your operations” refers to all entities included in your reporting boundary, indicated in W0.5.
- Please refer to CDP’s water accounting definitions (included in CDP Technical Note – Water Accounting Definitions) before completing this question.
- You should only select “Not monitored” if you do not collect any data on these water aspects across your operations. If you have data from any information sources, you should reflect this in your response by indicating the percentage of sites/facilities/operations this represents in the “% of sites/facilities/operations” column.
- If water accounting information cannot be provided for all operations within your reporting boundary, then please use column 3 to explain the level of coverage.
- The proportion of sites/facilities/operations reported in column 2 is not considered an indication of the proportion of total water volumes monitored in your organization. It provides organizational coverage of monitoring activity only.
- Note that for column 2, ‘sites/facilities/operations’ could include a broad variety of groupings of business operations, assets, fixed buildings, factories or sites etc. A company-specific explanation may be provided in column 3.
Water aspect (column 1)
- Definitions for each type of water aspect are included in the ‘Explanation of terms’ for this question (and repeated in the Glossary).
% of sites/facilities/operations (column 2)
- Please select the proportion of your organization’s facilities that are regularly (at least annually) measured and monitored for each of the defined aspects; e.g. a company that has 100 facilities across its total operations and measures and monitors quaterly total volumes of water withdrawals for 50% (50 facilities) would select “26-50”.
- Select ‘Not relevant’ if it is not technically feasible or technically desirable for your organization to monitor this aspect; e.g. your operations do not consume water so measurement of this is not required, you discharge to a single destination so do not monitor discharge destinations, your company does not recycle/reuse water because it is not considered cost effective. Provide your explanation in column 3.
- Select ‘Not monitored’ if your company does not monitor this aspect, though it would be technically possible or desirable; e.g. your company does recycle/reuse water but it is not yet monitored at the corporate level. Provide your explanation in column 3.
Please explain (column 3)
- You should provide an explanation for your response in column 2; such as why your organization measures/monitors the water aspect at this proportion of its operations, and explain which sites/facilities/operations are excluded and why.
- Please state if your response in column 2 relates to facilities, sites or operations, or another kind of grouping, and explain how you are using the term; e.g. “For our company, ‘facilities’ refers to our warehouses and retail outlets”; “Our response in this row relates to our different geographic operations. We do not have facilities or sites because we provide a range of services that are not tied to a specific location”.
- If you indicated that you monitor ‘Water withdrawals quality’ to determine the suitability of the water for its intended use, you may include details such as a list of parameters measured, and the frequency of data collection. This row supports the aims of the UN Environment Global Environment Monitoring System for Freshwater (GEMS/Water), a long term project to generate data flows on global water quality.
Sector-specific guidance for electric utilities sector
General
- This guidance is specific to companies responding to an electric utilities sector request. You should first read the guidance for this question that applies to all companies. This is additional to the general guidance and does not replace it.
Water aspect (column 1)
- Water withdrawals – total volume: CDP recognizes the difficulty in accounting for some elements of the hydropower operations’ water balance, specifically surface runoff or elements that are outside the organization’s control such as third-party discharges into the reservoir. Water withdrawals into hydropower operations include river inflow, surface runoff and precipitation onto the reservoir surface, as well as third-party discharges into the reservoir.
W = Precipitation+ River Inflow + Runoff + Third-party discharges into reservoir
Note that estimation or modelling are valid sources of data.
- Water withdrawals – volumes by source: Water withdrawals into hydropower operations include river inflow, surface runoff and precipitation onto the reservoir surface, as well as third-party discharges into the reservoir. Organizations should strive to monitor those sources if they would result in an estimated error in the water balance of more than 5%. Note that estimation or modelling are valid sources of data.
- Water withdrawals – quality data: In hydropower operations please consider the monitoring of reservoir water quality when responding to this question.
- Water recycling & reuse: CDP recognizes that water recycling and reuse practices in wind, solar and hydropower operations are less common and less relevant. In hydropower operations, only pumped-storage operations can be considered for water reuse or recycling. It is expected that most organizations will report 0 for their hydropower operations in this question. In light of this:
- Organizations with more than 70% of their power generation coming from these sources may select “Not relevant”.
- Organizations with less than 70% of their power generation coming from these sources should select the response that best reflects their company’s monitoring activity in their operations outside the hydropower, wind or solar generation sources. Indicate in column 3 (Please explain) how the use of these sources affects the proportion of sites monitored that you are reporting.
- Water discharges – total volume: CDP recognizes the difficulty in accounting for some elements of the hydropower operations’ water balance, specifically seepage or those that are outside the organization’s control such as third-party withdrawals.
In hydropower operations, water discharge includes the dam outlet and the spillway, underground seepage and third-party withdrawals from the reservoir (for example a municipal water plant abstracting from the reservoir). Note that estimation or modelling are valid sources of data.
D = Dam outlet + Spillway + Seepage + Third-party withdrawals from the reservoir
- Water discharges – volumes by destination: In hydropower operations, water discharge includes the dam outlet and the spillway, underground seepage and third-party withdrawals from the reservoir (for example a municipal water plant abstracting from the reservoir). Organizations should strive to monitor those destinations if they would result in an estimated error in their water balance of more than 5%. Note that estimation or modelling are valid sources of data.
- Water discharges – volumes by treatment method: CDP recognizes that discharge quality data is rarely measured in organizations operating with wind, solar and hydropower generation sources. In light of this:
- Organizations with more than 70% of their power generation coming from these sources may select “Not relevant”.
- Organizations with less than 70% of their power generation coming from these sources should select the response that best reflects their company’s monitoring activity in their operations outside the hydropower, wind or solar generation sources. Indicate in column 3 (Please explain) how the use of these sources affects the proportion of sites monitored that you are reporting.
- Water discharge quality data – by standard effluent parameters: CDP recognizes that discharge quality data is rarely measured in organizations operating with wind, solar and hydropower generation sources. In light of this:
- Organizations with more than 70% of their power generation coming from these sources may select “Not relevant”.
- Organizations with less than 70% of their power generation coming from these sources should select the response that best reflects their company’s monitoring activity in their operations outside the hydropower, wind or solar generation sources. Indicate in column 3 (Please explain) how the use of these sources affects the proportion of sites monitored that you are reporting.
- Water discharge quality data – temperature: CDP recognizes that discharge quality data is rarely measured in organizations operating with wind, solar and hydropower generation sources. In light of this:
- Organizations with more than 70% of their power generation coming from these sources may select “Not relevant”.
- Organizations with less than 70% of their power generation coming from these sources should select the response that best reflects their company’s monitoring activity in their operations outside the hydropower, wind or solar generation sources. Indicate in column 3 (Please explain) how the use of these sources affects the proportion of sites monitored that you are reporting.
- Water consumption – total volume: Water consumption in hydropower operations includes evaporation from the reservoir surface as well as the balance between withdrawals and discharges. Organizations should strive to estimate evaporated volumes if they would result in an estimated error in their water balance of more than 5%.
Sector-specific guidance for metals & mining sector
General
- This guidance is specific to companies responding to a metals & mining sector request. You should first read the guidance for this question that applies to all companies. This is additional to the general guidance and does not replace it.
- Monitoring produced water volumes is common practice in the metals & mining industry. This information is requested as it indicates that an organization is striving for comprehensive water accounting and aiming to manage all types of water entering its company boundaries.
Water aspect (column 1)
- Water withdrawals – total volume: In line with CDP’s definition of water withdrawal, for the metal & mining sector water withdrawals include water diversions to enable comparability – because it is water that crosses the company boundary.
- Water discharges – total volume: In line with CDP’s definition of water discharges, for the metal & mining sector discharges comprise all water outputs including water diversions– because it is water that crosses the company boundary.
Evaporation and water entrained in waste material should not be considered discharges but as part of the consumption volumes.
- Water consumption – total volume: Organizations in the metals & mining sector should report on the volumes of water lost to evaporation from open water surfaces, entrained in remaining waste material (such as tailings, coarse rejects, and concentrates), or water stored over the reporting year.
- Water withdrawals - quality: This water aspect is particularly relevant for companies with mining activities. monitoring this parameter is in line with ICMM's and WAF of the Mineral Council of Australia recommendation of monitoring the quality of water. Companies with mining activities may select the appropriate percentage.
- Water discharges - temperature: This water aspect is particularly relevant for companies with processing activities and smelters, who have cooling operations. Companies with processing activities may select the appropriate percentage.
Sector-specific guidance for oil & gas sector
General
- This guidance is specific to companies responding to an oil & gas sector request. You should first read the guidance for this question that applies to all companies. This is additional to the general guidance and does not replace it.
- Monitoring produced water volumes is common practice in the oil & gas industry. This information is requested as it indicates that an organization is striving for comprehensive water accounting and aiming to manage all types of water entering its company boundaries.
Water aspect (column 1)
- Water withdrawals – total volume: In the oil & gas sector, the reporting of water withdrawals volumes typically does not include produced water. To enable comparability, CDP requires all companies to include produced water volumes in their withdrawals disclosure.
- Water discharges – total volume: In oil production, as part of secondary and tertiary recovery operations, water-based fluids (from various sources) may be used to maintain the pressure, and to displace the hydrocarbons and move them towards the production wells. For CDP disclosure, organizations must consider these volumes as part of their discharges to groundwater bodies in order to have an accurate water balance.
- Produced water associated with your oil & gas sector activities - total volume: Select “not applicable” only if your organization does not include an “upstream” business division.
Explanation of terms
- Boundaries of your organization: This term is key within CDP water accounting definitions and is a management boundary, rather than a physical boundary or a legal entity. Water is considered to have crossed the boundary of your organization, at either the corporate or site level, when your organization in any way uses it, comes into contact with it, is required to manage it or when it becomes incorporated into your products. It therefore includes any water use and management by your organization outside of its physical corporate fence; for example, to provide a street cleaning service or in fields remote from a processing plant. The scope of this organizational boundary is defined by your chosen reporting boundary.
- Measurement: The collection of quantified data for a water aspect - either as a single volume/quality figure or an aggregation of volumes/quality figures.
- Monitoring: This is the tracking of measurements over time, i.e. a trend or indication of change in measured figures.
- Produced water: Water which enters the organization’s boundary as a result of the extraction, processing, or use of any raw material, so that it must be managed by the organization. When reporting to CDP, this water should not be counted as recycled water when put to use within a single cycle of a business process. Examples of produced water include moisture derived from vegetation such as in sugar cane crushing and the water content in crude oil. (Note that companies with oil and gas activities should refer to CDP’s sector specific guidance for this water aspect).
- Entrained water (Metals & mining sector only): In the metals & mining sector produced water refers to the volumes of water in the raw material.
- Produced water (Oil & gas sector only): Water that is brought to the surface during the production of hydrocarbons including formation water, flow-back water and condensation water (adapted from IPIECA's “Oil and gas industry guidance on voluntary sustainability reporting", 3rd edition, 2016).
- Recycled/reused water: Water and wastewater (treated or untreated) that has been used more than once before being discharged from the organization’s boundary, so that water demand is reduced. This may be in the same process (recycled), or used in a different process within the same facility or another of the organization’s facilities (reused). It can include wastewater re-used from household processes such as washing dishes, laundry, and bathing (grey water).
- Safely managed WASH services: The universal provision of safely managed water, sanitation, and hygiene services has dedicated targets within the Sustainable Development Goals (SDG 6.1 and 6.2). As a minimum, this disclosure refers to a company’s tracking of its provision of drinking water for all workers, available when needed and from sources compliant with faecal and chemical standards, as well as sanitation facilities where excreta are safely disposed in situ or transported and treated offsite.
- Water consumption: The amount of water that is drawn into the boundaries of the organization and not discharged back to the water environment or a third party over the course of the reporting year.
- Water discharges – total volume: The sum of effluents and other water leaving the organization’s boundary and released to surface water, groundwater water or to third parties over the course of the reporting year.
- Water discharges – volumes by destination: This refers to the proportion of your discharges that are tracked to different types of discharge destinations; e.g. freshwater, brackish surface water/seawater, groundwater, or third parties.
- Water discharges – volumes by treatment method: This refers to the proportion of your discharge that you track according to treatment method applied before being returned to the environment - primary, secondary, or tertiary treatment types etc. Different industries will have different requirements to meet compliance standards, or a company may have an internal standard they adhere to.
- Water discharge quality data – by standard effluent parameters: This refers to the quality of your discharged water/effluents tracked according to parameters such as Biological Oxygen Demand (BOD) or Total Suspended Solids (TSS). The specific choice of quality metrics will vary depending on the organization’s products, services, and operations but should be consistent with those used in the organization’s sector, and may need to vary depending on national or regional regulations.
- Water discharge quality data – temperature: This refers to the temperature of your discharged water/effluents. Though not yet a standard effluent parameter in many industries, thermal pollution can play a significant role in ecosystem degradation by altering levels of dissolved oxygen and harming wildlife.
- Water diversions (Metals & mining sector only): According to the Water Accounting Framework from the Mineral Council of Australia
water diversions are flows from an input to an output without being utilized by the operational facility. The flow is not stored with the intention of being used in a task or treated.
- Water withdrawals – total volumes: The sum of all water drawn into the boundaries of the organization (or facility) from all sources for any use over the course of the reporting period. (Source: adapted from GRI Standards Glossary 2016).
- Water withdrawals quality: This refers to the quality of raw water that your company draws into its boundary (from sources, such as rivers, lakes, groundwater and coastal zones).
- Water withdrawals – volumes by source: This refers to the proportion of withdrawals that your organization can trace to different types of water withdrawal source e.g. freshwater, brackish surface water/ seawater, produced water and third party sources, and a breakdown of groundwater by renewable and non-renewable sources.
- Water recycled/reused: Water and wastewater (treated or untreated) used more than once before being discharged from the organization’s boundary, so that water demand is reduced. This may be in the same process (recycled), or in a different process within the same facility or another of the organization’s facilities (reused).
- Water recycled/reused (Oil & gas sector only): Water and wastewater (treated or untreated) that has been used more than once, in order to reduce water withdrawals (adapted from IPIECA’s "Oil & gas industry guidance on voluntary sustainability reporting", 3rd edition, 2016).
Example response
| Water aspect |
% of sites/facilities /operations |
Please explain |
|
Water withdrawals – total volumes
|
100%
|
Our company operates electricity generation facilities operating thermal plants using oil, combined cycle, hydropower operations, wind and solar photovoltaic (PV). We monitor water withdrawals at the facility level and compile this information every 6 months into our central environmental management system.
|
|
Water withdrawals – volumes by source
|
100%
|
We monitor the source of water withdrawals at the facility level and compile this information every 6 months into our central environmental management system. At the corporate level, we implemented this level of information since 2014.
|
|
Water withdrawals - quality data
|
100%
|
We monitor water withdrawal quality at the facility level and compile this information every 6 months into our central environmental management system. At the corporate level, we implemented this level of information since 2014. In our hydropower operations we have a system for monitoring water quality upstream of our dams and collecting the data from the water discharges to the reservoir.
|
|
Water recycled/reused
|
76-99
|
Hydropower operations and wind represent 60% of our facilities and 55% of our generation capacity. We have water recycling systems in our combined cycle and coal operations. For the combined cycle plants (20% of our facilities) we compile this information every 6 months into our central environmental management system but we don't monitor this information in our coal generation plants (10% of our facilities).
|
|
Water discharges – total volume
|
100%
|
At Lion-Martins Energy Corporation, we monitor water discharges at the facility level for all of our thermal sites and compile this information every 6 months into our central environmental management system. However, in our wind energy portfolio in Ghana, which makes up 20% of our sites, and our commercial offices, which make up 10% of our facilities, we do not monitor water discharges. The volumes involved area very small in comparison to the organization-wide discharges (0.4% of total discharges) and deemed not relevant. Hence, our monitoring of this parameter is 100%.
|
|
Water discharges – volumes by destination
|
100%
|
At Lion-Martins Energy corporation, we monitor the destination of our water discharges at the facility level and compile this information every 6 months into our central environmental management system. At the corporate level, we implemented this level of information since 2014. However, in our wind energy portfolio in Ghana, which makes up 20% of our sites, and our commercial offices, which make up 10% of our facilities, we do not monitor water discharges. The volumes involved are very small in comparison to the organization-wide discharges (0.4% of total discharges) and deemed not relevant. Hence, our monitoring of the parameter is 100%.
|
|
Water discharges – volumes by treatment method
|
Not relevant
|
Herinarathra corp. produces 100% of its electricity from hydropower, wind, and solar plants. We monitor discharges in PV supporting infrastructure and hydropower plants like barracks and maintenance buildings in the facilities, but these discharges are minor in comparison to the corporate-wide water discharges.
|
|
Water discharge quality data – by standard effluent parameters
|
Not relevant
|
Hydropower operations, wind and solar represent 75% of our generation capacity so discharge quality is not monitored. In all our thermal generation plants we monitor the quality of our discharges to comply with local legislation and corporate environmental policy and procedures. We also monitor discharges in supporting PV infrastructure and hydropower plants like barracks and maintenance buildings in the facilities where waste water generation is significant.
|
|
Water discharge quality data – temperature
|
Not relevant
|
Hydropower operations, wind and solar represent 75% of our generation capacity. We do not monitor this parameter in these facilities. In all our thermal generation plants we monitor the temperature of our discharges to comply with local legislation and corporate environmental policy and procedures.
|
|
Water consumption – total volume
|
51-75
|
We monitor the water consumption in our thermal generation plants. Also, in our hydropower operations we have estimations for the evaporated volumes based on local climate data and we monitor the variations in storage. However, in our wind farms and PV operations we do not monitor water consumption.
|
|
The provision of fully-functioning, safely managed WASH services to all workers
|
100%
|
We provide WASH services in all supporting buildings like maintenance buildings etc. However we do not have WASH facilities in our wind mill fields as they are located distant from populated places, and workers are not expected to remain in the facilities unless there’s an incident. This is known and accounted for in our environmental procedures.
|
Additional information
The provision of safely managed WASH services at the workplace, and respecting the human rights to water and sanitation
The provision of safely managed WASH services at the workplace (and extending such expectations to other actors within its value chain) is aligned with the aims of the Sustainable Development Goals (SDG 6.1 and 6.2) and the UN Human Rights Council endorsed Guiding Principles on Business and Human Rights. These are established and authoritative global reference points on how companies should respect human rights in their own activities and business relationships, focusing on the risks to people rather than the risks to the business. Provision requirements may also be linked to Health and Safety regulations applicable to your operations.
In practice, companies need to implement due diligence to identify actual and potential impacts on human rights and to prevent, mitigate, and remediate them. This could mean a company may need to collaborate with others in the basin to reduce their collective water use when withdrawals limit the water availability for local communities in a way that impacts their right to water.
Water withdrawals quality and GEMS
The UN Environment Global Environment Monitoring System for Freshwater (GEMS/Water) provides the world community with sound data on water quality to support scientific assessments and decision-making on the subject. Surface and groundwater quality monitoring data collected from the global GEMS/Water monitoring network is shared through the GEMStat information system.
Within UN Environment, GEMS/Water was identified as being the mechanism to support countries to fulfill their reporting obligations for the UN Sustainable Development Goals. GEMS/Water provides appropriate support, based on capacity needs at national and regional levels, and develops training for delivery in countries all over the world.
(W-EU1.2a)
This question only applies to organizations with activities in the electric utilities sector - it will not be displayed here unless you opted to view these sector-specific questions.
(W-EU1.2a) For your hydropower operations, what proportion of the following water aspects are regularly measured and monitored?
Question Dependencies
- This question only appears if you select “Neutral”, “Important”, or Vital” as your “Direct use importance rating” in response to W1.1 and if you have any hydropower operations disclosed in W-EU0.1b.
Change from 2019
Minor change
Rationale
Dam operation implies an alteration of the natural river flow and sediment movement. Changes to river hydrology may affect instream and streamside habitats and affect local biodiversity. Ensuring appropriate environmental flows and sediment loadings helps to maintain water ecosystems and their basic functions.
Sediments can collect behind a dam because the dam itself is a physical barrier. Eventually they can reduce the operative capacity of dams. When sediments collect, ecosystems upstream and downstream can be affected.
CDP acknowledges that there is no universally accepted methodology for establishing environmental flows. In their simplest form, they can include low- and high- water regimes, and in their most complex, they may consider biodiversity and socioeconomic factors. Environmental flows may be established in national, regional or local legislation and there may be a legal requirement for hydropower operations to maintain those flows. In many countries, however, they are not legally established and organizations looking to maintain environmental flows would need to rely on available literature or data.
This question allows organizations to demonstrate their leadership in evaluating the environmental impacts of their operations, especially where legal and regulatory frameworks in this area are weak.
Response options
Please complete the following table:
| Water aspect
|
% of sites/facilities/operations measured and monitored
|
Please explain
|
|
Fulfilment of downstream environmental flows
|
Select
from:
- Not monitored
- Less than 1%
- 1-25
- 26-50
- 51-75
- 76-99
- 100%
- Not relevant
|
Text field [maximum 2,500 characters]
|
|
Sediment loading
|
|
|
|
Other, please specify
|
|
|
Requested content
General
- This question seeks a company-wide response about the monitoring of various water aspects. “Across all your operations” refers to all entities included in your reporting boundary indicated in W0.5.
- In row 3 “Other, please specify” organizations may indicate water aspects that are measured/monitored because they are deemed relevant for understanding the importance and impacts of water for your business
- You should only select “Not monitored” if you do not collect any data on these water aspects. If you have data or collect data from any information sources, you should reflect this in your response by indicating the percentage of sites/facilities/operations this represents in the “% of sites/facilities/operations” column.
- If monitoring information cannot be provided for all operations within your reporting boundary, then please explain why not in column 3 and describe the exclusions.
- Note that for column 2, (% sites/facilities/operations) may include a broad variety of groupings of business operations, assets, fixed buildings, factories or sites etc. A company-specific explanation may be provided in column 3.
% of sites/facilities/operations measured and monitored (column 2)
- Select the proportion of your organization’s facilities that are regularly (at least annually) measured and monitored for each of the defined aspects. For example, company A has 100 facilities across its total operations and quarterly measures and monitors sediment loading for 50% (50 facilities), so they would select “26-50”.
- Select “Not relevant” only if it is not technically feasible or technically desirable to monitor this aspect. Provide your explanation in column 3.
- Select “Not monitored” if your company does not monitor this aspect, though it would be technically possible or desirable. Provide your explanation in column 3.
Please explain (column 3)
- You should provide an explanation for your response to column 2; such as why your organization measures/monitors these water aspects at this proportion of its operations and explain any exclusions.
- If desired, you may indicate the approach taken to define environmental flows, e.g. “environmental flows are defined by local legislation” or “they are defined by scientific studies promoted by our organization”.
- Please state if your response in column 2 relates to facilities, sites or operations, or another kind of grouping, and explain how you are using the term; for example, “For our company, ‘facilities’ refers to several small run of the river operations”; “Our response in this row relates to our different geographic operations. We operate conjunctly several consecutive dams”.
Other, please specify (row 3)
- Report other water aspects that are measured/monitored because they are deemed relevant for understanding the importance and impacts of water for your business. Please provide a label for the water aspect in the text field provided. Select the percentage that best applies to your organization in column 2 and describe the water aspect in column 3 (Please explain).
- If you have no other water aspects that are deemed relevant you may select the option “Not relevant”.
Explanation of terms
- Downstream environmental flows: Environmental flows describe the quantity, timing, and quality of water flows required to sustain freshwater and estuarine ecosystems and the human livelihoods and well-being that depend on these ecosystems.
- Sediment loading: The sediment content accumulating before the dam, that may lead to silting up or the sediment load in a dam outlet and spillway.
(W1.2b) What are the total volumes of water withdrawn, discharged, and consumed across all your operations, and how do these volumes compare to the previous reporting year?
Question dependencies
- This question only appears if you select “Neutral” “Important,” or “Vital” as your “Direct use importance rating” in response to W1.1.
Change from 2019
Modified guidance
Rationale
This question incentivizes companies to have a complete view of their water balance at the corporate level.
Total volumes can indicate the organization’s relative significance as a user of water and provide a baseline figure for other calculations. Along with trend data, these volumes can also suggest the level of risk posed by future disruptions to water supplies or increases in the cost of water.
Water consumption measures water that is no longer available for use by the ecosystem or local community in the reporting period. Reporting the volume of water consumption contributes to an organization’s understanding of the overall scale of its impact due to water withdrawal on downstream water availability.
Connection to other frameworks
CEO Water Mandate
Current state: Performance
SDG
Goal 6: Clean water and sanitation
Response options
Please complete the following table:
| Water aspect
|
Volume (megaliters/year)
|
Comparison with previous reporting year
|
Please explain
|
|
Total withdrawals
|
Numerical field [enter
a range of 0 to +/- 999,999,999,999 using a maximum of two decimal places]
|
Select from:
- Much lower
- Lower
- About the same
- Higher
- Much higher
- This is our first year of measurement
|
Text field [maximum 2,000 characters]
|
|
Total discharges
|
|
|
|
|
Total consumption
|
|
|
|
Requested content
- Note: Organizations responding to an electric utilities, metals & mining, or oil & gas sector request should refer to additional sector-specific guidance on this question at the end of the "Requested content" section.
General
- This question is asking you to report aggregated company-wide volumetric data. If you do not have the aggregated data, if you are estimating or extrapolating to provide complete coverage, please give an explanation in column 3 (Please explain). Please remember that a zero should only be used for reporting zero volumes and not for an absence of data.
- Please refer to CDP’s water accounting definitions before completing this question. Report volumetric data in megaliters per year for the reporting year (the time period you stated in response to W0.2). (1 megaliter = 1 million liters or 1,000 m3).
- Cooling water: Cooling water (freshwater or sea water) is often withdrawn in large quantities and discharged back to its original source with negligible losses or variation in quality. However, this should be included in your water accounts.
- Rainwater: If a company is managing rainwater (for example, by harvesting for use or storage, or to prevent flooding), or is dependent on it for production of goods or the delivery of services, it should try to estimate and disclose it as a withdrawal from the hydrological system into the company boundary. Note that in some jurisdictions rainwater is considered a withdrawal source and organizations are required to report its collection and use.
- Companies may choose to exclude collected rainwater and domestic sewage from their water withdrawal/discharge volumes only if the resulting error in their water balance would be less than 5%. (This avoids your discharge volumes being larger than your withdrawals).
- Including rainwater helps companies better understand their water dependency and risks. For some companies, precipitation/rainwater volumes may constitute a principal input of water at site level. This includes run-off where it has to be managed. In these cases, excluding rainwater from water accounting – withdrawal and discharge - would not be a true reflection of site water balance. In addition, there may be reduced impacts from using rainwater in place of other local freshwater sources.
Volumes (column 2)
- Please report volumetric data in megaliters per year for the reporting year (the time period you stated in response to W0.2). (1 megaliter = 1 million liters or 1,000 m3).
- For withdrawals, data may be collected from several sources, including “water meters, water bills, calculations derived from other available water data or the organization’s own estimates (if neither water meters nor bills or reference data exist).
- Before deciding whether your withdrawals, discharges or consumption can be reported as zero (0), please refer to CDP’s Technical Note on Water Accounting Definitions.
- If reporting “zero consumption” please remember to check your discharge volumes. Scorers will check that discharge and withdrawals volumes balance (approximately).
Comparison with previous year (column 3)
- CDP does not define the threshold for considering a value as ‘much higher’ rather than simply ‘higher’ (or ‘much lower’/’lower’). CDP requests this information from many different industries with huge variations in water use, and it would therefore be difficult to provide a universal threshold that is meaningful (as proportions will equate to different absolute values and impacts).
- CDP recommends that you define your own threshold for what is ‘much higher’ (and ‘much lower’) and apply it consistently so that the reported data for this question is comparable and data users can track your water accounts more effectively each year. A company-specific explanation for these thresholds should be provided in column 4 (Please explain).
Please explain (column 4)
- Include any contextual information necessary to understand how the volumetric data have been compiled, such as any standards, methodologies, and assumptions used.
- If you have left column 2 blank because you do not have the data, please describe the barriers to reporting that data and any plans to collect and report it.
- Describe the thresholds for what is ‘much higher’ and ‘much lower’ for the change in volume for each water aspect compared to the previous year.
- You should account for the change compared to last year and also indicate the anticipated future trends for these volumes, if known (note that future trends should be at least one year after the end of the reporting year provided in W0.2).
- If there is any level of uncertainty in your ‘Total’ figures in column 2, or if there is an estimated figure, you should explain it in this field and give the range of uncertainty. Uncertainty can arise from data gaps, assumptions, metering/measurement constraints including equipment accuracy, data management, etc.
- Note: CDP expects withdrawals, discharges and consumption figures to balance (approximately; +/- 5%) so if there is a good reason why this cannot happen, it should be explained in here.
Please explain – additional guidance for consumption volume (row 3)
- For the “water consumption” row, you should indicate if your figure is based on an aggregation of local measurements, an aggregation of local calculations, or is a company-wide calculation (for example using withdrawals minus discharges).
- If known, please provide a breakdown of this figure (with reference to CDP’s definition of consumption) and a brief explanation. Breakdowns include:
- Volume incorporated into products, crops or waste;
- Volume evaporated or transpired;
- Volume consumed by humans or livestock;
- Net volume stored in a controlled manner;
- Net volume stored for future use;
- Volumes otherwise excluded from discharges out of the organization’s boundary.
- It is important that you explain a negative consumption figure where this is the case. This would indicate that your discharges are larger than your withdrawals for the reporting year - due to a net release of water from storage, for example.
Sector-specific guidance for electric utilities sector
General
- This guidance is specific to companies responding to an electric utilities sector request. You should first read the guidance for this question that applies to all companies. This is additional to the general guidance and does not replace it.
Water aspect (column1)
- Total withdrawals: CDP recognizes the difficulty in accounting for some elements of the hydropower operations’ water balance, specifically surface runoff or elements that are outside the organization’s control such as third-party discharges into the reservoir.
Water withdrawals into hydropower operations include river inflow, surface runoff and precipitation onto the reservoir surface, as well as third-party discharges into the reservoir:
W = Precipitation + River Inflow + Runoff + Third-party discharges into reservoir
Organizations should strive to include volumes for those sources if they would result in an estimated error in the water balance of more than 5% and take a consistent approach throughout the questionnaire. In column 4 (Please explain), you should explain which sources you have included or excluded. Note that estimation or modelling are valid sources of data.
- Total discharges: CDP recognizes the difficulty in accounting for some elements of the hydropower operations’ water balance, specifically seepage or those that are outside the organization’s control such as third-party withdrawals.
In hydropower operations, water discharge includes the dam outlet and the spillway, underground seepage and third-party withdrawals from the reservoir (for example a municipal water plant abstracting from the reservoir).
D = Dam outlet + Spillway + Seepage + Third-party withdrawals from the reservoir
Organizations should strive to include volumes for those destinations if they would result in an estimated error in the water balance of more than 5% and take a consistent approach throughout the questionnaire. In column 4 (Please explain), you should explain which destinations you have included or excluded. Note that estimation or modelling are valid sources of data.
- Total consumption: Water consumption in hydropower operations includes evaporation from the reservoir surface as well as the balance between withdrawals and discharges. Although organizations should estimate evaporated volumes if they would result in an estimated error in the water balance of more than 5%, you may consider variations in storage as a valid measure of your consumption volumes rather than calculating evaporation and the balance between all withdrawals and discharges. This information is usually easily derived from water level measurements.
In column 4 (Please explain) provide your approach to reporting a total consumption figure.
Please explain (column 4)
- In the case of hydropower operations, indicate which elements of water withdrawals (river inflow, surface runoff, precipitation onto the reservoir surface and third-party discharges into the reservoir), discharges (spillway, underground seepage, and third-party withdrawals from the reservoir) and consumption are you taking into account when providing your response to column 2 (Volume). You may indicate the method followed to obtain it, e.g. direct monitoring, estimation from a hydrological model, or other secondary source of information.
- Additionally, you may choose to specify the evaporated volumes if your organization collects this data.
Sector-specific guidance for metals & mining sector
General
- This guidance is specific to companies responding to a metals & mining sector request. You should first read the guidance for this question that applies to all companies. This is additional to the general guidance and does not replace it.
Water aspect (column1)
- Water withdrawals: In line with CDP’s definition of water withdrawal, for the metal & mining sector water withdrawals include water diversions to enable comparability – because it is water that crosses the company boundary.
- Water discharges: In line with CDP’s definition of water discharges, for the metal & mining sector discharges comprise all water outputs including water diversions – because it is water that crosses the company boundary.
Evaporation and water entrained in waste material should not be considered discharges but as part of the consumption volumes.
- Water consumption: Water consumption in metals & mining sector should report on the volumes of water lost to evaporation from open water surfaces, entrained in remaining waste material (such as tailings, coarse rejects, and concentrates), or water stored over the reporting year.
Sector-specific guidance for oil & gas sector
General
- This guidance is specific to companies responding to an oil & gas sector request. You should first read the guidance for this question that applies to all companies. This is additional to the general guidance and does not replace it.
Water aspect (column1)
- Total withdrawals: In the oil & gas sector, the reporting of water withdrawals volumes typically does not include produced water. To enable comparability, CDP requires all companies to include produced water volumes in their withdrawals disclosure, in order to have an accurate water balance.
- As part of groundwater withdrawal volumes (be it from renewable or non-renewable sources), organizations should include all withdrawals from aquifers (other than the formation being exploited). These withdrawals may be intended for any use in the organization, including injection to maintain well pressure or as part of the fracture fluids.
- Total discharges: In oil production, as part of secondary and tertiary recovery operations, water-based fluids (from various sources) may be used to maintain the pressure, and to displace the hydrocarbons and move them towards the production wells. For CDP disclosure, organizations must report these volumes as discharges to groundwater bodies, to enable comparability and have an accurate water balance.
Explanation of terms
- Water balance: An account of the volumes of water flowing into and leaving an organisation across its boundary. When the two volumes are equal, the net water balance will be zero.
- Water consumption: The amount of water that is drawn into the company boundary and not discharged back to the water environment or a third party. It is important to distinguish the term ‘consumption’ from the term ‘water withdrawal’ or ‘water use’. Water consumed is water that during the reporting year:
- has been incorporated into products, crops or waste;
- has evaporated or transpired;
- consumed by humans or livestock;
- has been stored in a controlled manner because it is polluted to the point of being unusable by other users, and so that it does not leave the organization’s boundary;
- has been stored during the reporting year for use or discharge in a subsequent reporting period;
- is otherwise excluded from discharges out of the organization’s boundary so that it is no longer available for use by the ecosystem or local community.
Consumption may be measured directly or modelled, or it can be calculated by subtracting the total water discharge from company boundary from total water withdrawn into the company boundary during the reporting period. As CDP data users require comparability, all disclosing companies should use this method.
If the company discharges more water than it withdraws, for example, because it has used and then discharged previously stored water, a negative consumption value is possible. This would indicate a net contribution to the water environment in the reporting year.
- Water discharges – total volumes: The sum of effluents and other water leaving the organization’s boundary and released to surface water, groundwater water or to third parties over the course of the reporting year. This includes all water leaving the company boundary, whether it is:
- considered used or unused;
- released through a defined discharge point (point source discharge), or;
- released over land in a dispersed or undefined manner (non-point source discharge), or as;
- wastewater removed from the organization via truck.
Water discharge can be authorized (in accordance with discharge consent) or unauthorized (if discharge consent is exceeded).
Example response
| Water aspect |
Volume (megaliters/year) |
Comparison with previous reporting year |
Please explain |
|
Total withdrawals
|
32,596,140
|
Higher
|
Hydropower operations represent the main share of our water withdrawals. After two consecutive drier-than-average hydrological years in Cohahuila, Mexico, where our hydropower facilities are, the current reporting year was wetter and river inflow, precipitation and runoff increased significantly.
|
|
Total discharges
|
23,827,590
|
Higher
|
Hydropower operations represent the main share of our water discharges. After two consecutive drier-than-average hydrological years in Cohahuila, Mexico, where our hydropower facilities are, the reporting year was wetter and dam discharges increased following requests from the regional water agency.
|
|
Total consumption
|
8,799,710
|
Higher
|
Hydropower operations represent the main share of our water consumption. After two consecutive drier-than-average hydrological years in Cohahuila, Mexico, where our hydropower facilities are, the reporting year was wetter and stored water volumes increased despite the increase in discharges. This makes our consumption figure higher.
|
(W-OG1.2c)
This question only applies to organizations with activities in the oil & gas sector - it will not be displayed here unless you opted to view these sector-specific questions.
(W-OG1.2c) In your oil & gas sector operations, what are the total volumes of water withdrawn, discharged, and consumed – by business division – and what are the trends compared to the previous reporting year?
Question dependencies
- This question only appears if you select 'Neutral,' 'Important,' or 'Vital' as your 'Direct use importance rating' in response to W1.1.
- Rows in this question will be presented according to the business divisions reported in W-OG0.1a.
Change from 2019
Minor change
Rationale
This question incentivizes companies to have a complete view of their water balance at the business division level. Volumes of water withdrawals, discharges, and consumption typically differ significantly between business divisions. Detailing the water balance at this scale provides data users with an understanding of the key phases that determine the organization’s water balance and allow a better interpretation of answers provided in other sections of the questionnaire.
Connection to other frameworks
SDG
Goal 6: Clean water and sanitation
Response options
Please complete the following table:
| Water aspect by business division
|
Volume (megaliters / year)
|
Comparison with previous reporting year %
|
Please explain
|
|
Total withdrawals - upstream
|
Numerical field [enter a number from 0 to +/- 999,999,999,999 using a maximum of 2 decimal places]
|
Select from:
- Much Lower
- Lower
- About the same
- Higher
- Much Higher
- This is our first year of measurement
|
Text field [maximum 2,500 characters]
|
|
Total discharges - upstream
|
|
|
|
|
Total consumption - upstream
|
|
|
|
|
Total withdrawals - midstream/downstream
|
|
|
|
|
Total discharges - midstream/downstream
|
|
|
|
|
Total consumption - midstream/downstream
|
|
|
|
|
Total withdrawals - chemicals
|
|
|
|
|
Total discharges - chemicals
|
|
|
|
|
Total consumption - chemicals
|
|
|
|
|
Total withdrawals - other business division
|
|
|
|
|
Total discharges - other business division
|
|
|
|
|
Total consumption - other business division
|
|
|
|
Requested content
General
- IPIECA’s “Oil and gas industry guidance on voluntary sustainability reporting” guidelines recommend reporting in m3. However, due to the large volumes of water involved in the oil & gas industry, and to allow for comparability, CDP’s preferred metric is megaliters (1 megaliter = 1 million liters or 1000 m3).
- If you are estimating or extrapolating to provide complete coverage, please give an explanation in column 3 ('Please explain'). Please remember that a zero should only be used for reporting zero volumes and not for an absence of data.
- In the case of integrated plants combining one or more business divisions organizations may choose to report the withdrawn, discharged, and consumption volumes in either one of the business division rows. You should then clarify this in column 4 (Please explain).
- Total withdrawals - Upstream (row 1): In the oil & gas sector, the reporting of water withdrawals volumes typically does not include produced water. To enable comparability, CDP requires all companies to include produced water volumes in their withdrawals disclosure, in order to have an accurate water balance.
- Total discharges – Upstream (row 2): In oil production, as part of secondary and tertiary recovery operations, water-based fluids (from various sources) may be used to maintain the pressure, and to displace the hydrocarbons and move them towards the production wells. For CDP disclosure, organizations must report these volumes as discharges to groundwater bodies, to enable comparability and have an accurate water balance.
Comparison with previous reporting year (column 3)
-
If you left column 2 blank because you are unable to report a calculated or estimate figure this year, you may give an estimate for the change if possible.
-
CDP does not define the threshold for considering a value as ‘much higher’ rather than simply ‘higher’ (or ‘much lower’/’lower’). CDP requests this information from many different industries with huge variations in water use, and it would therefore be difficult to provide a universal threshold that is meaningful (as proportions will equate to different absolute values and impacts).
- CDP recommends that you define your own threshold for what is ‘much higher’ (and ‘much lower’) and apply it consistently so that each year the reported data for this question is comparable and data users can track your water accounts more effectively. A company-specific explanation for these thresholds should be provided in column 4 (Please explain).
Please explain (column 4)
- If you have reported combined data for business divisions, please explain your approach here.
- Please explain your response for column 2 including any zero (0) volumes.
- Describe the thresholds for what is 'much higher' and 'much lower' for the change in volume for each aspect compared to the previous year.
- You should account for the change compared to last year and also indicate the anticipated future trends for these volumes, if known (note that future
trends should be at least one year after the end of the reporting year
provided in W0.2).
Explanation of terms
(W1.2d) Indicate whether water is withdrawn from areas with water stress and provide the proportion.
Question dependencies
- This question only appears if you select "Neutral", "Important", or "Vital" as your "Direct use importance rating" in response to W1.1.
Change from 2019
Modified question, Revised question dependency
Rationale
Since water is a shared resource, and water-related impacts are localized, organizations are increasingly being encouraged to prioritize action in areas with water stress and to understand and respond to local contexts. This question on water from stressed areas supports a trend towards metrics for corporate water reporting and target setting informed by local context, and in addition, the TCFD recommends disclosure of reliance on water from areas of water stress.
The data requested assists the assessment of your organization’s dependence on potentially contested sources (regardless of whether your facility itself is located in a stressed area), as well as your potential impact on sensitive locations.
Water stress occurs when the demand for water exceeds availability during a certain period, or when access is restricted due to poor quality or regulatory enforcement for example. It can compound basin challenges, both in terms of quantity (e.g., stress can result in rivers running dry causing problems for fish, transportation, as well as in long term changes to water sources) and quality (e.g., stress can worsen eutrophication, organic matter pollution, saline intrusion, etc.).
Water stress is a driver of business risk and, as it is likely to worsen, transparency is critical. Gaining an insight into the potential for an increased exposure to elevated business risk due to operations in water stressed areas is very important for the investor community, and overtime this question will allow data users to review the trend in dependency on water from stressed basins. While CDP provides investors, customers and other data users with data about inherent risk exposure such as this, it also provides information about your response to that exposure which can be used to understand the residual risk.
Knowledge of water-related hot spots helps your company identify where water stress may be affecting its operations, now or in the future, as well as to prioritize your sustainable water management practices.
- Note that to identify whether withdrawals are located in water stressed areas, companies can use one of the publicly available credible tools detailed in the guidance for this question or otherwise explain the approach taken.
Connection to other frameworks
GRI
Standard 303-3: Water withdrawal
CEO Water Mandate
Current state: Performance
SDG
Goal 6: Clean water and sanitation
Response options
Please complete the following table:
|
Withdrawals are from areas with water stress
|
% withdrawn from areas with water stress
|
Comparison with previous reporting year
|
Identification tool
|
Please explain
|
|
Select from:
|
Select from:
- Less than 1%
- 1-10
- 11-25
- 26-50
- 51-75
- 76-99
- 100%
- Unknown
|
Select from:
- Much lower
- Lower
- About the same
- Higher
- Much higher
- This is our first year of measurement
|
Select from:
- WRI Aqueduct
- WWF Water Risk Filter
- Other, please specify
|
Text field [maximum 5,000 characters]
|
Requested content
General
- This disclosure does not request volumetric data – only a figure for the proportion of withdrawals from stressed areas. Please refer to CDP’s water accounting definitions and the Explanation of terms for this question before completing the table.
- Organizations should report which approach/tool they use to assess whether their withdrawals are from a ‘stressed area’. They should explain the approach taken and which data sets were used to assess ‘water stress’.
- Credible, publicly available methodologies for assessing levels of water stress include WRI Aqueduct Water Risk Atlas and WWF Water Risk Filter (see Additional information for more details about these tools).
- As good practice, a water-stressed area must be measured, at a minimum catchment level.
- Commonly accepted indicators and thresholds for water stress that are recommended for reporting to CDP include:
- Baseline water stress - higher values indicate more competition among users; equal to/greater than 'High': 40-80% (WRI Aqueduct)
- Baseline water depletion - higher values indicate larger impact on the local water supply and decreased water availability for downstream users; equal to/greater than 'High': 50-75% (WRI Aqueduct)
- Water depletion - higher values indicate larger impact on the local water supply and decreased water availability for downstream users; equal to/greater than 75% on an annual, seasonal, and inter-annual timescale (WWF Water Risk Filter)
- These indicators account for water stress in terms of the quantity of water resource available. There are currently no commonly used tools/indicators which also take account of accessibility and water quality and which would reflect the CEO Water Mandate’s more inclusive definition of water stress. This definition is adopted by CDP – see the Explanation of Terms for this question and the Glossary. The tools and indicators recommended will be reviewed over time.
- Organizations can complement the results of these tools with their own assessments or by using other methodologies. Some companies will use more granular level data and local knowledge of the basins in which they operate to assess which withdrawals are from stressed areas. For example, a company may consider its facility to be in a water-stressed sub basin or other smaller geographic level, though a global data set suggests that the particular catchment is not stressed.
- Many national and regional water authorities will also have suitable maps, databases and environmental assessments available. (These may be included in the FAO/AquaStat database, or in reports of progress against SDG 6.4.2.)
- Note that this question asks about the location of withdrawal sources rather than your facilities. In most cases, these will not be different at a catchment level. If you are supplying data based on the location of facilities, because you do not know the exact location of all your withdrawal sources, please indicate this is column 5.
Withdrawals are from areas with water stress (column 1)
- If you select 'No', columns 2 and 3 will not be presented.
- If you select 'Unknown', columns 2, 3, and 4 will not be presented.
% withdrawn from areas with water stress (column 2)
- Your disclosure should include all withdrawals within stressed areas and all sources listed in W1.2h, including third party suppliers. The proportion is calculated as:

- ‘Total volume of company-wide withdrawals’ is the sum of all water drawn into the company boundary from all the relevant sources as disclosed in W1.2b.
- You may provide an estimate and explain why in column 5.
- If you have selected 'No' in column 1, please enter a zero and explain in column 5.
Comparison with previous reporting year (column 3)
- CDP does not define the threshold for considering a value as ‘much higher’ rather than simply ‘higher’ (or ‘much lower’/’lower’). CDP requests this information from many different industries with huge variations in water use, and it would therefore be difficult to provide a universal threshold that is meaningful (as proportions will equate to different absolute values and impacts). CDP recommends that you define your own threshold for what is ‘much higher’ (and ‘much lower’) and apply it consistently so that each year the reported data for this question is comparable and data users can track your water accounts more effectively. A company-specific explanation for these thresholds should be provided in column 5 ('Please explain').
Identification tool (column 4)
- Select the tool your organization uses to identify whether its withdrawals are located in geographic areas of water stress.
- If you have used a different tool, methodology or data set, please select ‘Other, please specify’ and provide a label for the tool/approach in the text field provided and give details in column 5.
Please explain (column 5)
- Use this field also to give more details about:
- The proportion you reported in column 2; and
- Any exclusions in your reporting.
- If your responses to column 2 or column 3 are partially or wholly estimated, please explain your approach to estimation.
- If you have selected a recommended tool in column 4, give a reason for your selection and the data sets you use within the tool.
- If you have not used one of the tools recommended, please describe:
- The tool and your rationale for using it;
- How “areas with water stress” are defined and identified, including the threshold applied; and
- If possible, the methodology used such as the data sets that your assessment is based on (see Additional information).
- This question asks about the location of withdrawal sources rather than your facilities. Please indicate if you are only able to supply data based on the location of facilities and give your reason.
- If desired, you may give an explanation of your company’s management response to the exposure to business risks associated with the percentage disclosed in column 2, and your experience of working in water stressed areas. This is optional but may provide data users with context to better interpret the significance of the figures reported.
Explanation of terms
- Baseline water stress: The ratio of total annual water withdrawals to total available annual renewable supply.
- This measure is used in the World Resource's Institute Aqueduct tool.
- 'High' baseline water stress is when withdrawals are in the range of 40-80% of total annual available blue water. Extremely high baseline water stress is when withdrawals are >80% of availability of blue water.
- Water availability: Is defined as the natural runoff (through groundwater and rivers) minus the flow of water that is required to sustain freshwater and estuarine ecosystems and the human livelihoods and well-being that depend on these ecosystems. Water availability typically varies within the year and also from year to year. Water availability might be reduced by decreases in both the water quantity and quality of water resources (adapted from CEO Water Mandate's "Corporate Water Disclosure Guidelines").
- Water depletion: The ratio of total water consumption to available renewable water supplies.
- In the WWF Water Risk Filter (indicator 1.1 - Water Depletion) a depletion score of ‘Medium’ or a Risk score of 3+ represents basins where a 75% threshold is exceeded on a dry-year basis (Medium), seasonal basis (High), or annual average basis (Very High). This approach shows the temporal and spatial dimensional of water stress on a single map.
- In the Aqueduct Tool, "Baseline water depletion" is a single scale not encompassing temporal fluctuations.
- Water scarcity: Refers to the volumetric lack of freshwater resources. It is a human-driven concept; it is a function of the volume of human water consumption relative to the volume of water resources in a given area. As such, an arid region with very little water, but no human water consumption would not be considered “scarce,” but rather “arid.”
Water scarcity (unlike water stress) is a physical, objective reality that can be measured consistently across regions and over time. Water scarcity reflects the physical abundance of fresh water rather than whether that water is actually suitable for use. For instance, a region may have abundant water resources but have such severe pollution that those supplies are unfit for human or ecological uses. This region would not be considered water scarce, but would be considered water stressed (based on the CEO Water Mandate’s Corporate Water Disclosure Guidelines, 2014).
- Water stress:The ability, or lack thereof, to meet human and ecological demand for fresh water. Compared to scarcity, “water stress” is a more inclusive and broader concept. It considers several physical aspects related to water resources, including water availability, water quality, and the accessibility of water. It can also be based on subjective elements so that it is assessed differently depending on societal values, such as the suitability of water for drinking, the requirements to be afforded to ecosystems, and whether people can make use of the physically available water supplies. This is often a function of the infrastructure and the affordability of water, among other things. Consider for instance, a region may have abundant water resources (and thus not be considered water scarce), but it may have such severe pollution that those supplies are unfit for human or ecological uses. Consider also that a sector able to use any quality of water may enjoy more availability than another sector in the same catchment that depends on high quality water (based on the CEO Water Mandate’s definition of water stress, Corporate Water Disclosure Guidelines, 2014).
- Area with water stress: There is no universally accepted methodology for classifying an area as water stressed, nor for identifying whether facilities are located in a water stressed area. As good practice, a water stressed area should be at the catchment level as a minimum. CDP’s reporting guidance for W1.2d suggests some publicly available and credible tools for identifying water stressed areas based simply on physical scarcity.
Additional information
More about water stress
There is no universally accepted methodology, criteria, or thresholds for classifying an area as water stressed. CDP’s preferred approach to defining water stress is that of the CEO water mandate which goes beyond physical abundance to include whether the water is actually suitable and/or accessible for use (see CEO Water Mandate’s definition of water stress, Corporate Water Disclosure Guidelines, 2014). However, the commonly used tools for assessing geographic areas are limited to physical criteria and datasets.
The tools listed in the response table for W1.2d allow companies to determine the stress status of the basins where their operations are located. The tools are underpinned by some common and some different datasets and sources (namely WRI Aqueduct and FAAO Aquastat), and there are conceptual differences. Other tools may use other data sets. Companies must determine which approach is most meaningful for their activities and the water contexts they operate in. Here is a summary.
WRI Aqueduct Water Risk Atlas Tool (Note that this was updated in 2019. See
The New Aqueduct Water Risk Atlas: What's new & why does it matter to you?)
| Water Stress Metric
|
Description
|
Baseline water stress = withdrawals as a percentage of available flow
Baseline water depletion = consumption as a percentage of available flow
|
A customizable global atlas used to evaluate how water risk (and water stress) may affect operations (at watershed level). The global map can be tailored specifically for nine water-intense industry sectors including Oil & Gas, Agriculture and Chemicals.
Note that the categories of ‘Overall water risk’ are based on a weighted selection of various physical, regulatory and reputational indicators. One of the ‘Physical risk quantity’ indicators is a water stress indicator (‘Baseline water stress’) and and another is a water depletion indicator ('Baseline water depletion'). The Aqueduct interface allows users to easily change the settings so that just these particular indicators are shown.
For CDP disclosure, companies using Aqueduct should consider areas as ‘water stressed’ where baseline water stress equals or exceeds 40%, or baseline water depletion equals or exceeds 50%.
|
WWF Water Risk Filter
| Water Stress Metric
|
Description
|
| Depletion = the ratio of consumptive use to renewable available water
|
A platform that shows the temporal and spatial dimensional of water stress on a single map. An area is considered stressed when depletion is equal to/greater than 75% on an annual, seasonal, and inter-annual timescale.
The tool allows users to map, assess, and respond to both basin and operational water risk. Maps can be tailored specifically for 34 different industries including agriculture, apparel, extractives, chemicals and pulp & paper. The tool also includes a water risk valuation section.
|
Note about the SDGs and water stress
The UN Water’s definition underpins reporting for SDG 6.4.2. This equates water stress only with volumetric availability: the ratio between total freshwater withdrawn by all major sectors and total renewable freshwater resources, after having taken into account environmental water requirements. Accordingly:
- An area of low level water stress is one where the combined withdrawal by all sectors is marginal in relation to the resources, and has therefore little potential impact on the sustainability of the resources or on the potential competition between users (UNWater - Integrated Monitoring Guide for SDG 6, 2016).
- An area of high level water stress indicates a situation where the combined withdrawal by all sectors represents a substantial share of the total renewable freshwater resources, with potentially larger impacts on the sustainability of the resources and potential situations of conflicts and competition between users (UNWater - Integrated Monitoring Guide for SDG 6, 2016).
Note about water risk/stress/scarcity
Note that water stress and scarcity are just two types of physical risk drivers for water users. Beyond these, there are a variety of other physical pressures related to water risk, such as flooding, drought and infrastructure decay, as well as legal and reputational risks. (Refer to the CEO Water Mandate’s Detailed Definitions for water scarcity, water stress and water risk).
(W-FB1.2e) (W-FB1.2f) (W-FB1.2g)
Questions W-FB1.2e to W-FB1.2g apply only to organizations with activities in the food, beverage and tobacco sector - they will not be displayed here unless you opted to view these sector-specific questions.
(W-FB1.2e) For each commodity reported in question W-FB1.1a, do you know the proportion that is produced/sourced from areas with water stress?
Question dependencies
- This question only appears if you select “Neutral” “Important” or “Vital” as your “Direct use importance rating” or your “Indirect use importance rating” in response to W1.1.
- Your response to this question will determine whether W-FB1.2f and W-FB1.2g are presented. If your response to W-FB1.2e is amended, data in those dependent
questions may be erased. In this case, be sure to re-enter data for W-FB1.2f and W-FB1.2g.
Change from 2019
Minor change
Rationale
This question allows organizations to demonstrate that they are evaluating potential water-related risks and opportunities arising from their demand for agricultural commodities. Agricultural production is an activity sensitive to water stress and water stress is likely to increase in key agricultural producing areas. This means that transparency around dependency on water in stressed areas is essential and in the medium term, these questions will allow data users to track trends.
This question on water from stressed areas supports a move towards metrics for corporate water reporting and target setting informed by local context, and in addition, the TCFD recommends disclosure of reliance on water from areas of water stress.
Water stress occurs when the demand for water exceeds availability during a certain period, or when access is restricted due to poor quality or regulatory enforcement for example. It can compound basin challenges, both in terms of quantity (e.g., stress can result in rivers running dry causing problems for fish, transportation, as well as in long term changes to water sources) and quality (e.g., stress can worsen eutrophication, organic matter pollution, saline intrusion, etc.).
Water stress is a driver of business risk and, as it is expected to worsen, transparency is critical. Gaining an insight into the potential for an increased exposure to elevated business risk due to operations in water stressed areas is very important for the investor community.
Response options
Please complete the following table. You are able to add rows by using the “Add Row” button at the bottom of the table.
| Agricultural commodities
|
The proportion of this commodity produced in areas with water stress is known
|
The proportion of this commodity sourced from areas with water stress is known
|
Please explain
|
|
Select from:
- Drop-down options from the selection in W-FB1.1a
- Other commodities from W-FB1.1a, please specify
|
Select from:
- Yes
- No, not currently but we intend to obtain this data within the next two years
- No, we do not have this data and have no plans to obtain it
- Not
applicable
|
Select from:
- Yes
- No, we do not have this data and have no plans to obtain it
- Not
applicable
|
Text field [maximum 1,500
characters]
|
[Add Row]
Requested content
General
- Organizations are expected to report on each of the water-intensive commodities they reported in W-FB1.1a.
- Note that to evaluate the level of water stress of the producing areas, CDP requests that companies use one of the credible publicly available tools (see the guidance for question W1.2d).
Agricultural commodities (column 1)
- You should add extra rows to include all the commodities reported in W-FB1.1a.
- For every commodity that you reported in W-FB1.1a using the “Other, please specify” option you need to report this again in this question by selecting the option “Specify any additional commodities reported in W-FB1.1a” and providing a label for the agricultural commodity in the text field provided.
The proportion of this commodity produced in areas with water stress is known (column 2)
- Only select “Not applicable” if your organization does not produce the commodity in question.
The proportion of this commodity sourced from areas with water stress is known (column 3)
- Only select “Not applicable” if your organization does not source the commodity in question.
Please explain (column 4)
- Provide details of the tool used to identify areas with water stress. Indicate if the approach is different for produced or sourced products. Add the rationale for choosing these approaches.
- If you selected any option other than “Yes” in columns 2 and 3, please explain your reasons for this.
(W-FB1.2f) What proportion of the produced agricultural commodities reported in W-FB1.1a originate from areas with water stress?
Question dependencies
- This question is presented if you select the option “Yes” in column 2 of W-FB1.2e for any commodity.
Change from 2019
Minor change
Rationale
This question provides data users with information on the exposure that the organization may have too scarce resources in their direct operations. This metric will also allow data users to better understand the answers provided in other sections of the questionnaire.
Note that while CDP provides investors, customers and other data users with data about inherent risk exposure such as this, it also provides information about your response to that exposure and investors can use that to assess the residual risk.
Response options
Please complete the following table. You are able to add rows by using the “Add Row” button at the bottom of the table.
| Agricultural commodities
|
% of total agricultural commodity produced in areas with water stress
|
Please explain
|
|
Select from:
- Drop-down options for the produced commodities
selected in W-FB1.2e
- Other produced commodities from W-FB1.2e, please specify
|
Select from: - 0%
- Less than 1%
- 1-10
- 11-25
- 26-50
- 51-75
- 76-99
- 100%
|
Text field [maximum 1,500 characters]
|
[Add Row]
Requested content
General
- Organizations are expected to report on each of the commodities for which they have selected “yes” in column 2 from question W-FB1.2e.
Agricultural commodities (column 1)
- For every produced commodity that you reported in W-FB1.2e, please add a row to report a company-wide percentage in column 2.
% of total agricultural commodity produced in areas with water stress (column 2)
- Provide the percentage of your commodity produced in water stressed areas over the total amount of commodities produced.
- If none of your commodities are produced in water stressed areas in the current reporting year, please select a zero (0) and explain in column 3.
- The percentage relates to weight, volume or other usual unit of production for the commodity.
Please explain (column 3)
- Use this field to give an explanation for the percentage reported in column 2, indicating any key factors that explain it.
- Please state the unit of production used to calculate the percentage reported in column 2.
- Provide information on how these proportions have changed over the last year and indicate the anticipated future trends for these proportions, if known (note that future trends should be at least one year after the end of the reporting year provided in W0.2).
- Additionally, you may explain how the metric is used within your organization; e.g., to inform targets, strategy or investments.
(W-FB1.2g) What proportion of the sourced agricultural commodities
reported in W-FB1.1a originate from
areas with water stress?
Question dependencies
- This question is presented if you select the option “Yes” in column 3 of W-FB1.2e for any commodity.
Change from 2019
Minor change
Rationale
This question provides data users with information on the exposure that the organization may have too scarce resources in their value chain. This metric will also allow data users to better understand the answers provided in other sections of the questionnaire.
While CDP provides investors, customers and other data users with data about inherent risk exposure such as this, it also provides information about your response to that exposure and investors can use that to assess the residual risk.
Response options
Please complete the following table. You are able to add rows by using the “Add Row” button at the bottom of the table.
| Agricultural commodities
|
% of total agricultural commodity sourced from areas with water stress |
Please explain
|
|
Select from:
- Drop-down options for the sourced commodities
selected in W-FB1.2e
- Other sourced commodities from W-FB1.2e, please specify
|
Select from: - 0%
- Less than 1%
- 1-10
- 11-25
- 26-50
- 51-75
- 76-99
- 100%
|
Text field [maximum 1,500 characters]
|
[Add Row]
Requested content
General
- Organizations are expected to report on each of the commodities for which they have selected “yes” in column 3 from question W-FB1.2e.
Agricultural commodities (column 1)
- For every sourced commodity that you reported in W-FB1.2e, please add a row to report a company-wide percentage in column 2.
% of total agricultural commodity sourced from areas with water stress (column 2)
- Provide the percentage of your commodity sourced from areas with water stress over the total amount of commodities produced.
- If none of your commodities are sourced from areas with water stress in the current reporting year, please select a zero (0) and explain in column 3.
- The percentage relates to weight, volume, or other usual unit of production for the commodity.
Please explain (column 3)
- Use this field to give an explanation for the percentage reported in column 2, indicating any key factors that explain it.
- Please state the unit of production used to calculate the percentage reported in column 2.
- Provide information on how these proportions have changed over the last year and indicate the anticipated future trends for these proportions, if known (note that future
trends should be at least one year after the end of the reporting year provided
in W0.2).
- Additionally, you may explain how the the metric is used within your organization; e.g., to inform targets, strategy or investments.
(W1.2h) Provide total water withdrawal data by source.
Question dependencies
- This question only appears if you indicate in W1.2 that you monitor the following water aspect(s):
- Water withdrawals – volume by source
Change from 2019
Modified guidance
Rationale
Distinguishing between source types and reporting volume of water withdrawn by source contributes to an understanding of the potential risks and impacts associated with an organization’s water use as this level of detail can be significant. For example, withdrawing water from an overdrawn aquifer will have different consequences for local water stress and a company’s water security than does withdrawing seawater. Clean freshwater is becoming increasingly scarce, and this can impact production processes that rely on large volumes of water.
In regions where water sources are highly restricted, the organization’s water consumption patterns can also influence relations with other stakeholders.
Connection to other frameworks
CEO Water Mandate
Current state: Performance
SDG
Goal 6: Clean water and sanitation
Response options
Please complete the following table:
|
Source
|
Relevance
|
Volume (megaliters/year)
|
Comparison with previous reporting year
|
Please explain
|
|
Fresh surface water, including rainwater, water from wetlands, rivers, and lakes
|
Select from:
- Relevant
- Relevant but volume unknown
- Not relevant
|
Numerical field [enter a number from 0-999,999,999,999 using a
maximum of 2 decimal places]
|
Select from:
- Much lower
- Lower
- About the same
- Higher
- Much higher
- This is our first year of measurement
|
Text field [maximum 1,000 characters]
|
|
Brackish surface water/Seawater
|
|
|
|
|
|
Groundwater – renewable
|
|
|
|
|
|
Groundwater – non-renewable
|
|
|
|
|
|
Produced/Entrained water
|
|
|
|
|
|
Third party sources
|
|
|
|
|
Requested content
- Note: Organizations responding to an electric utilities or metals & mining sector request should refer to additional sector-specific guidance on this question at the end of the "Requested content" section.
General
- For the different sources, this question is requesting a figure for aggregated withdrawal volumes from across your organization. Information about your withdrawals by their source allows a better understanding of your company’s dependency on different sources, the trend in that dependency, and your risk exposure from different water sources. If you do not have aggregated company-wide volumetric data, you may provide an estimate and give an explanation in column 5 (Please explain).
- Cooling water: Cooling water (freshwater or sea water) is often withdrawn in large quantities and discharged back to its original source with negligible losses or variation in quality. However, this should be included in your water accounts. For example, a utility company may use large volumes of surface water for cooling purposes, and the water quality may not need to be fresh. Companies should report this information by selecting ‘Non-fresh surface water/seawater’, to demonstrate to investors that they are not dependent on potentially scarce fresh surface water sources and therefore their risk exposure is likely to be less than if they were dependent on freshwater resources.
- Rainwater: If a company is managing rainwater (for example, by harvesting for use or storage, or to prevent flooding) or is dependent on it for production of goods or the delivery of services, it should try to estimate and disclose it as a withdrawal from the hydrological system into the company boundary.
- Companies may choose to exclude collected rainwater and domestic sewage from their water withdrawal/discharge volumes only if this would result in less than 5% error in their water balance.
- Including rainwater helps companies better understand their water dependency and risks. For some companies, precipitation/rainwater volumes may constitute a principal input of water at site level. In these cases, excluding rainwater from water accounting – withdrawal and discharge - would not be a true reflection of site water balance. In addition, there may be reduced impacts from using rainwater in place of other local freshwater sources.
- Oil & gas sector only: Groundwater - As part of groundwater withdrawal volumes (be it from renewable or non-renewable sources), organizations should include all withdrawals from aquifers (other than the formation being exploited). These withdrawals may be intended for any use in the organization, including injection to maintain well pressure or as part of the fracture fluids.
Source (column 1)
- Fresh surface water: For the purposes of this disclosure you should include all surface water sources of a higher quality than brackish (i.e. a TDS lower than 10,000 mg/l).
Relevance (column 2)
- “Relevant” if your company uses, has used or plans to use the source, even if the withdrawal is zero for this reporting year.
- “Relevant but volume unknown” if your company uses, has used or plans to use the source, but the volume for this year is unknown and can not be estimated. Columns 3 and 4 will then be disabled and you should provide further explanation in column 5 (Please explain).
- “Not relevant” if your company does not withdraw from the source. Columns 3 and 4 will then be disabled. You may provide further explanation in column 5 (Please explain).
Volume (column 3)
- Volumes should be reported in megaliters per year (1 megaliter = 1 million liters or 1000 m3). Your reporting year is the time period you stated in response to question W0.2.
- If you do have volumetric data for the current reporting year you may provide an estimate and explain why this is the case in column 5.
- Please remember that a zero should only be used for reporting zero volumes and not for an absence of data.
- If reporting zero withdrawals, provide an explanation in column 5.
- If reporting zero withdrawals, provide an explanation in column 5. Before deciding whether your withdrawals should be reported as “zero”, please refer to CDP’s definition of water withdrawals.
Comparison with previous reporting year (column 4)
- CDP does not define the threshold for considering a value as ‘much higher’ rather than simply ‘higher’ (or ‘much lower’/’lower’). CDP requests this information from many different industries with huge variations in water use, and it would therefore be difficult to provide a universal threshold that is meaningful (as proportions will equate to different absolute values and impacts).
- CDP recommends that you define your own threshold for what is ‘much higher’ (and ‘much lower’) and apply it consistently so that each year the reported data for this question is comparable and data users can track your water accounts more effectively. A company-specific explanation for these thresholds should be provided in column 5 for each source.
Please explain (column 5)
- To assist CDP data users to understand a company’s water use, you should explain your selections for relevance, volumes and trend (columns 2, 3 and 4), and include company-specific information.
- Report whether your volumes for each source are estimated, modelled, or sourced from direct measurements. If estimation or modelling has been used, report the estimation or modelling methods.
- Please explain any zero volumes for relevant sources. For example, “we sometimes withdraw water from this source but the volume for the reporting year was zero”.
- Describe the thresholds for what is 'much higher' and 'much lower' for the change in volume for each source compared to the previous year.
- Indicate the anticipated future trends for these volumes, if known (note that future
trends would be at least one year after the end of the reporting year
provided in W0.2).
- For 'Fresh surface water' (row 1), it is important that you state which of the sources apply (rainwater, water from wetlands, rivers and lakes). Also state whether those sources are monitored and if you know whether the withdrawal volume for each source is increasing or decreasing. If you are using and managing rainwater and the volume equates to more than 5% of your water balance, please explain if it is harvested, treated etc. and the benefits and impacts of using it.
- For 'Third party' (row 6), if possible please specify whether the third party is a municipal supplier or another type of third party organization. This is particularly important if the third party is known to be located in a water stressed area.
Sector-specific guidance for electric utilities sector
General
- This guidance is specific to companies responding to an electric utilities sector request. You should first read the guidance for this question that applies to all companies. This is additional to the general guidance and does not replace it.
- CDP recognizes the difficulty in accounting for some elements of the hydropower operations’ water balance, specifically surface runoff or elements that are outside the organization’s control such as third-party discharges into the reservoir (for example a municipal waste water treatment plant discharging into the reservoir).
- Water withdrawals into hydropower operations include river inflow, surface runoff and precipitation onto the reservoir surface, as well as third-party discharges into the reservoir:
W = Precipitation + River Inflow + Runoff + Third-party discharges into reservoir
Organizations should strive to include volumes for those sources if they would result in an estimated error in their water balance of more than 5% (specifically the total water withdrawals figure you report in W1.2b) and take a consistent approach throughout the questionnaire. In the last column (Please explain) you should indicate which sources you have included or excluded. Note that estimation or modelling are valid sources of data.
Relevance (column 2)
- For your hydropower operations - if the data for third-party discharges to the reservoir or the surface runoff volumes are not available, you may select “Relevant but volume unknown” or “Not relevant” depending on which best applies to your organization. You may consider water volumes to be relevant if the resulting error in the organization's water balance would be more than 5%.
Please explain (column 5)
- Indicate which elements of water withdrawals (river inflow, surface runoff, precipitation onto the reservoir surface or third-party discharges into the reservoir), are you taking into account when providing your response, as well as the method followed to obtain it, e.g. direct monitoring, estimation from a hydrological model, or other secondary source of information.
Sector-specific guidance for metals & mining sector
General
- This guidance is specific to companies responding to a metals & mining sector request. You should first read the guidance for this question that applies to all companies. This is additional to the general guidance and does not replace it.
Source (column 1)
- Rainwater: Please note that in the mining industry precipitation/rainwater volumes may constitute a principal input of water at site level. Excluding rainwater from water accounting would not be a true reflection of site water balance.
- Groundwater: Groundwater withdrawals are linked to extraction from bore holes and aquifer interception, i.e. groundwater is water that is extracted as part of ore body dewatering during mining operations. Water entrained in ore should be reported as produced water.
- Brackish water/seawater: Organizations sourcing freshwater of low water quality (categories 2 and 3 of the Water Accounting Framework from the Mineral Council of Australia) and using it in their operations without significant treatment may report these resources as part of row 3 “Brackish water/seawater” sources, despite being a different type of resource.
- Produced/Entrained water: Water entrained in ore should be reported in this row.
Please explain (column 5)
- You may provide additional information to describe your organization’s water use. Consider providing an explanation of factors like local landscape, geology, climate or hydrogeology, commodity type, or ore grade.
Explanation of terms
- Brackish surface water/seawater: Surface water in which the concentration of salts is high and far exceeds normally acceptable standards for municipal, domestic or irrigation use (at least higher than 10,000 mg/l TDS). Seawater has a typical concentration of salts above 35,000 mg/l TDS.
- Fresh surface water, including rainwater, water from wetlands, rivers and lakes: Water that is naturally occurring water on the Earth's surface in ice sheets, ice caps, glaciers, icebergs, bogs, ponds, lakes, rivers and streams, and has a low concentration of dissolved solids.
For the purposes of reporting water accounting data to CDP, this surface water source includes water of a quality generally acceptable for, or requiring minimal treatment to be acceptable for, domestic, municipal or agricultural uses (at least <10,000 mg/l TDS, though a range of additional quality properties may also be considered). ‘High quality’ fresh water sources considered acceptable for potable use are typically characterized as having concentrations of dissolved solids less than 1,000 mg/l.
- Groundwater (non-renewable): Water which is being held in, and can be recovered from, an underground formation. Non-renewable groundwater has a negligible rate of natural recharge on the human time-scale (more than 50 years), and is generally located at deeper depths than renewable groundwater. This is sometimes referred to as “fossil” water.
- Groundwater (renewable): Water which is being held in, and can be recovered from, an underground formation. Renewable groundwater sources can be replenished within 50 years and are usually located at shallow depths.
- Produced water: Water which enters the organization’s boundary as a result of the extraction, processing, or use of any raw material, so that it must be managed by the organization. When reporting to CDP, this water should not be counted as recycled water when put to use within a single cycle of a business process. Examples of produced water include moisture derived from vegetation such as in sugar cane crushing and the water content in crude oil (note that companies with oil and gas activities should refer to CDP’s sector specific guidance for this water aspect).
- Produced water (Oil & gas sector only): Water that is brought to the surface during the production of hydrocarbons including formation water, flow-back water and condensation water (adapted from IPIECA's “Oil and gas industry guidance on voluntary sustainability reporting", 3rd edition, 2016).
- Third party sources: This includes water provided by municipal water suppliers, public or private utilities, and wastewater from any other organization.
- Water withdrawal: The sum of all water drawn into the boundaries of the organization from all sources for any use over the course of the reporting period.
(W1.2i) Provide total water discharge data by destination.
Question Dependencies
- This question only appears if you indicate in W1.2 that you monitor the following water aspect(s):
- Water discharges - volumes by destination
Change from 2019
Modified guidance
Connection to other frameworks
CEO Water Mandate
Current state: Performance
SDG
Goal 6: Clean water and sanitation
Response options
Please complete the following table:
| Destination |
Relevance |
Volume (megaliters/year) |
Comparison with previous reporting year |
Please explain |
|
Fresh surface water
|
Select from:
- Not relevant
- Relevant
- Relevant but volume unknown
|
Numerical field [enter
a range of 0-999,999,999,999 using a maximum of 2 decimal places]
|
Select from:
- Much lower
- Lower
- About the same
- Higher
- Much higher
- This is our first year of measurement
|
Text field [maximum 1,000 characters]
|
|
Brackish surface water/seawater
|
|
|
|
|
|
Groundwater
|
|
|
|
|
|
Third-party destinations
|
|
|
|
|
Requested content
- Note: Organizations responding to an electric utilities or metals & mining sector request should refer to additional sector-specific guidance on this question at the end of the "Requested content" section.
General
- This question is requesting an aggregated figure for your discharge volumes across your organization. If you do not have aggregated company-wide volumetric data, you should provide and estimate and give an explanation in column 5 (Please explain).
- Zero discharge permit: If your company has a zero discharge permit, please consider any discharges that may exist outside this permit and may still be relevant to CDP’s definition of discharges.
- Rainwater: Rainwater/run-off that enters the site/facility boundary and is captured could also be counted as an output or discharge (even if not used in operations) if returned to the water environment via a dedicated discharge destination; e.g. river or groundwater via soakaway/filtration pond. You may choose to exclude collected rainwater from your discharge accounting, unless this would result in an error in your balance of more than 5%.
- Please note that in the mining industry precipitation/rainwater volumes may constitute a principal input of water at site level and excluding rainwater would not be a true reflection of their site water balance. Companies in this sector (and others to which this is relevant) should report rainwater/runoff drawn into the boundaries of their operations and then discharged and explain this in column 5.
- Cooling water: Cooling water (freshwater or sea water) is often withdrawn in large quantities and discharged back to its original source with negligible losses or variation in quality. However, this should be included in your water accounts.
- Domestic sources: Domestic sewage is not regarded as water discharge. However, if wastewater comes from domestic sources but is pre-dominantly generated from sector business activities e.g. healthcare residential properties, this should be reported if it would result in an error in your balance of more than 5%.
- Aquifer reinjection: reinjection to aquifers should be considered as a discharge to groundwater.
- Soakaway: Water returning to a groundwater source via a soakaway should be considered as a discharge.
- Groundwater (oil & gas sector only): In oil production, as part of secondary and tertiary recovery operations, water-based fluids (from various sources) may be used to maintain the pressure, and to displace the hydrocarbons and move them towards the production wells. For CDP disclosure, organizations must report these volumes as discharges to groundwater bodies, to enable comparability and have an accurate water balance.
Relevance (column 2)
- “Relevant” if your company uses, has used or plans to use the source, even if the discharge is zero for this reporting year.
- “Relevant but volume unknown” if your company uses, has used or plans to use the source, but the volume for this year is unknown. Columns 3 and 4 will then be disabled. You should provide further explanation in column 5 (Please explain).
- “Not relevant” if your company does not discharge to the destination. Columns 3 and 4 will then be disabled. You should provide further explanation in column 5 (Please explain).
Volume (column 3)
- Volumes should be reported in megaliters per year (1 megaliter = 1 million liters or 1000 m3). Your reporting year is the time period you stated in response to question W0.2.
- If you do have volumetric data for the current reporting year you may provide an estimate and explain why this is the case in column 5.
- Please remember that a zero should only be used for reporting zero volumes and not for an absence of data.
- If reporting zero discharges, provide an explanation in column 5.
- Before deciding whether your discharges should be reported as “zero”, please refer to CDP’s definition of water discharges. This may be the case, for example, if a closed water circuit, or zero liquid effluent discharge complex, is in operation and a facility does not discharge water as all water is reused by the operation(s) during processing/production.
Comparison with previous reporting year (column 4)
- CDP does not define the threshold for considering a value as ‘much higher’ rather than simply ‘higher’ (or ‘much lower’/’lower’). CDP requests this information from many different industries with huge variations in water use, and it would therefore be difficult to provide a universal threshold that is meaningful (as proportions will equate to different absolute values and impacts).
- CDP recommends that you define your own threshold for what is ‘much higher’ (and ‘much lower’) and apply it consistently so that each year the reported data for this question is comparable and data users can track your water accounts more effectively. A company-specific explanation for these thresholds should be provided in column 5 for each destination.
Please explain (column 5)
- To assist CDP data users to understand a company’s water use, you should explain your selections for relevance, volumes and trend (columns 2, 3 and 4), and include company-specific information.
- Report whether your volumes for each destination are estimated, modelled, or sourced from direct measurements. If estimation or modelling has been used, report the estimation or modelling methods.
- To give data users confidence in your response, please explain any zero volumes for relevant destination’s; e.g. if a completely closed loop cooling system has been introduced. Please remember to report any discharged water that exceeds site storage capacity, e.g. excessive rainfall, as a separate discharge.
- Describe the thresholds for what is 'much higher' and 'much lower' for the change in volume for each destination compared to the previous year.
- Indicate the anticipated future trends for these volumes, if known (note that future
trends would be at least one year after the end of the reporting year
provided in W0.2).
- For discharges to a Third-party, it is important to state if this includes water to other organizations for further use.
Sector-specific guidance for electric utilities sector
General
- This guidance is specific to companies responding to an electric utilities sector request. You should first read the guidance for this question that applies to all companies. This is additional to the general guidance and does not replace it.
- CDP recognizes the difficulty in accounting for some elements of the hydropower operations’ water balance, specifically seepage or those that are outside the organization’s control such as third-party withdrawals.
- In hydropower operations, water discharge includes the dam outlet and the spillway, underground seepage and third-party withdrawals from the reservoir (for example a municipal water plant abstracting from the reservoir):
D = Dam outlet + Spillway + Seepage + Third-party withdrawals from the reservoir
Organizations should strive to include volumes for those destinations if they would result in an estimated error in their water balance of more than 5% (specifically the total discharge figure you report in W1.2b) and take a consistent approach throughout the questionnaire. In the last column ('Please explain'), you should explain which destinations you have included or excluded. Note that estimation or modelling are valid sources of data.
Relevance (column 2)
- For your hydropower operations - if the data for third-party withdrawals from the reservoir or the seepage volumes are not available, you may select “Relevant but volume unknown” or “Not relevant” depending on which best applies to your organization. You may consider water volumes to be relevant if the resulting error in the organization's water balance would be more than 5%.
Please explain (column 5)
- For hydropower operations explain if any changes in the water discharge volumes are related to higher/lower electricity production or other reasons related to water resources management such as flood control, satisfaction of downstream water demand, etc.
- Indicate which elements of water discharges (dam outlet and spillway, seepage and third-party withdrawals from the reservoir) you are taking into account when providing your response.
Sector-specific guidance for metals & mining sector
General
- This guidance is specific to companies responding to a metals & mining sector request. You should first read the guidance for this question that applies to all companies. This is additional to the general guidance and does not replace it.
Destination (column 1)
Explanation of terms
- Brackish surface water/seawater: Surface water in which the concentration of salts is high and far exceeds normally acceptable standards for municipal, domestic or irrigation use (at least higher than 10,000 mg/l TDS). Seawater has a typical concentration of salts above 35,000 mg/l TDS.
- Fresh surface water, including wetlands, rivers and lakes: Water that is naturally occurring water on the Earth's surface and has a low concentration of dissolved solids.
- Groundwater: Water which is being held in, and can be recovered from, an underground formation. Discharge to groundwater, by human activity or natural activity, refers to a destination beneath the soil surface, such as a water bearing layer of rock (aquifer). Examples of discharges to groundwater include disposal of sewage, trade effluent and surface water run-off from urban areas, through such methods as spreading basins, soakaways, swales or injection wells.
- Third-party destinations: This includes municipal wastewater plants, public or private utilities, and other organizations involved in the transport, treatment, disposal or further use of wastewater.
- Note that to qualify as a third-party destination, “other organizations” using your wastewater must be outside your reporting boundary given in question W0.5.
- Any of your wastewater that has been treated on your own site should be reported as discharge according to its ultimate destination (for example, to groundwater), as this is where any potential risks for the company lie.
Water discharge: The sum of effluents and other water leaving the boundaries of the organization and released to surface water, groundwater, or third parties over the course of the reporting period (adapted from GRI Standard 306-1, 2016). This includes all water leaving the company boundary, whether it is:- considered used or unused;
- released through a defined discharge point (point source discharge);
- released over land in a dispersed or undefined manner (non-point source discharge);
- wastewater removed from the organization via truck.
Companies may choose to exclude collected rainwater and domestic sewage from their water discharge volume unless this would result in an error in their water balance of more than 5%.
Water discharge can be authorized (in accordance with discharge consent) or unauthorized (if discharge consent is exceeded).
Water intensity
The questions in this section are presented to high-impact sectors only and will not be displayed here unless you have opted to view sector-specific questions.
(W-CH1.3) Do you calculate water intensity for your activities in the chemical sector?
Change from 2019
No change
Question dependencies
- This question only appears if you select “Neutral” “Important” or “Vital” as your “Direct use importance rating” or your “Indirect use importance rating” in response to W1.1.
- Your response to W-CH1.3 will determine whether W-CH1.3a is presented. If your response to W-CH1.3 is amended, data in W-CH1.3a may be erased. In this case, be sure to re-enter data for W-CH1.3a.
Rationale
This metric is being introduced to encourage organizations with activities in the chemical sector to collect water intensity data useful for improving water use efficiency.
In addition to total water volumes, water intensity metrics provide a complementary indicator to help identify efficiencies and opportunities for the reduction in water withdrawals or consumption.
Data users seek improved transparency around the calculation of such metrics to enable performance monitoring and high-level benchmarking.
This question aligns with public policy goals related to water at all levels, such as the Sustainable Development Goal 6.4.1.
Response options
Select one of the following options:
- Yes
- No, but we intend to do so within the next two years
- No, and we have no plans to do so in the next two years
Requested content
General
- Only select a ‘No’ option if you do not currently calculate any water intensity data in your activities in the chemical sector.
Explanation of terms
- Water intensity: A metric providing the relationship between a volumetric aspect of water and a unit of production, financial metric, or any other unit.
(W-CH1.3a) For your top five products by production weight/volume, provide the following water intensity information associated with your activities in the chemical sector.
Question dependencies
- This question only appears if you select "Yes" to question W-CH1.3.
Change from 2019
Minor change
Rationale
This question provides data users with information on how organizations are monitoring the water intensity of their key products and the underlying factors that determine their trend for this metric. It is acknowledged that water intensities will naturally vary according to facility-specific factors like final product obtained, cooling technology or processes used. Specifying a type of metric also helps data users to understand common practice in the industry.
Connection to other frameworks
SDG
Goal 6: Clean water and sanitation
Response options
Please complete the following table. You are able to add rows by using the “Add Row” button at the bottom of the table.
| Product type
|
Product name
|
Water intensity value (m3)
|
Numerator: Water aspect
|
Denominator |
Comparison with previous reporting year
|
Please explain
|
|
Select from:
- Bulk organic chemicals
- Bulk inorganic chemicals
- Specialty organic chemicals
- Specialty inorganic chemicals
- Other, please specify
|
Text field [maximum
500 characters]
|
Numerical field [enter
a number from 0-999,999,999,999 using a maximum of 2 decimal places]
|
Select from:
- Freshwater withdrawals
- Freshwater consumption
- Total water withdrawals
- Total water consumption
- Other, please specify
|
Select from:
- m3
- Ton
- Other, please specify
|
Select from:
- Much lower
- Lower
- About the same
- Higher
- Much higher
- This is our first year of measurement
|
Text field [maximum 2,000 characters]
|
Requested content
General
- Organizations are expected to report intensity information for their top five products. If reporting 5 products is not possible, an explanation should be provided in column 7 (Please explain).
Product type (column 1)
- Please add up to five rows to provide a type for your top 5 products.
Product name (column 2)
- Provide
the product name. For the purpose of this question, ‘product’ may refer to
categories of products that encompass several individual products, for example
NPK fertilizers. In column 7 you may give a reason for the grouping, e.g. they
are produced in integrated plants.
Water intensity value (column 3)
- Provide your water intensity value. You should use cubic meters (m3) for the water aspect.
Comparison with previous reporting year (column 6)
- CDP does not define the threshold for considering a value as ‘much higher’ rather than simply ‘higher’ (or ‘much lower’/’lower’). CDP requests this information from many different organizations with significant variations in water intensity.
- Please define your own threshold for what is ‘much higher’ (and ‘much lower’) and apply it consistently so that each year the reported data for this question is comparable and data users can track your water accounts more effectively. A company-specific explanation for these thresholds should be provided in column 7 (Please explain).
Please explain (column 7)
- Provide any clarification needed for data users to understand your response.
- Please explain:
- Your choice of numerator for this product;
- Your choice of denominator for this product; and
- The trend reported in column 6 and give a company-specific explanation of the thresholds used to provide the trend.
- Indicate the anticipated future trends, if known (note that future trends should be at least one year after the end of the reporting year provided in W0.2).
- If the intensity metric is restricted to a specific area/boundary, e.g. company-wide, value-chain, joint ventures, country, etc. please include this boundary and the explanation for it.
- For your calculation of the intensity value, you may wish to include any weighting you use to arrive at a more precise intensity value for an aggregate of countries, business units, substances, etc. Additionally, you may also explain how the metric is used within your organization, for example to set specific targets/goals relating to water efficiency, to guide water strategy, to set remuneration incentives, etc.
Explanation of terms
- Water intensity: A metric providing the relationship between a volumetric aspect of water and a unit of production, financial metric or any other unit.
(W-EU1.3) Do you calculate water intensity for your electricity generation activities?
Question Dependencies
- This
question only appears if you select “Neutral,” “Important” or “Vital” as your “Direct use importance rating” or your “Indirect use importance rating” in response to W1.1.
- This question appears only if “Electricity generation” is selected in response to W-EU0.1a.
- Your response to W-EU1.3 will determine whether W-EU1.3a is presented. If your response to W-EU1.3 is amended, data in W-EU1.3a may be erased. In this case, be sure to re-enter data for W-EU1.3a.
Change from 2019
No change
Rationale
This metric is being introduced to encourage organizations with electricity generation activities to collect intensity data with a view to facilitating the development of a meaningful intensity metric and improving water use efficiency.
Data users seek improved transparency around the calculation of such metrics to enable performance monitoring and high-level benchmarking.
In addition to total water volumes, water intensity metrics provide a complementary indicator to help identify efficiencies and opportunities in water withdrawals or consumption.
This aligns with public policy goals related to water at all levels, including such as the Sustainable Development Goal 6.4.1.
Response options
Select one of the following options:
- Yes
- No, but we intend to do so within the next two years
- No, and we have no plans to do so in the next two years
Requested content
General
- Only select a “No” option if you do not currently calculate and collect any water intensity data in your electricity generation activities.
Explanation of terms
- Water intensity: A metric providing the relationship between a volumetric aspect of water and a unit of production, financial metric or any other unit.
(W-EU1.3a) Provide the following intensity information associated with your electricity generation activities.
Question Dependencies
- This question only appears if you select "Yes" to question W-EU1.3.
Change from 2019
Minor change
Rationale
This question provides data users with information on how organizations are monitoring their water intensity and the underlying factors that determine their trend for this metric. CDP acknowledges that water intensities will vary according to power generation source and technologies used. Specifying a type of metric also helps data users to understand common practice in the industry.
Connection to other frameworks
SDG
Goal 6: Clean water and sanitation
Response options
Please complete the following table. You are able to add rows by using the “Add Row” button at the bottom of the table:
| Water intensity value (m3)
|
Numerator: water aspect
|
Denominator |
Comparison with previous reporting year
|
Please explain
|
|
Numerical field [enter a number from
0-999,999,999,999 using a maximum of 2 decimal places]
|
Select from:
- Freshwater withdrawals
- Freshwater consumption
- Total water withdrawals
- Total water consumption
- Other, please specify
|
Select from:
- MWh
- Other, please specify
|
Select from:
- Much lower
- Lower
- About the same
- Higher
- Much higher
- This is our first year of measurement
|
Text field
[maximum 2,000 characters]
|
[Add Row]
Requested content
General
- Provide details of your water intensity metrics. If you have several metrics for each of the power generation sources or for various products you may add rows for each of them and indicate in column 5 which source/product the metric applies to.
Water intensity value (column 1)
- Provide your water intensity value. You should use cubic meters (m3) for the water aspect.
Comparison with previous reporting year (column 4)
- CDP does not define the threshold for considering a value as “much higher” rather than simply “higher” (or “much lower”/’lower”). CDP requests this information from many different organizations with significant variations in water intensity.
- Please define your own threshold for what is “much higher” (and “much lower”) and apply it consistently so that each year the reported data for this question is comparable and data users can track your water accounts more effectively. A company-specific explanation for these thresholds should be provided in column 5 (Please explain).
Please explain (column 5)
- Provide any clarification needed for data users to understand your response including indication of any factors affecting your water intensity and the trend you reported, for example arising from local context, variations in production, river basin water management, etc.
- Please explain:
- Your choice of numerator for this product. If you excluded any water source (e.g. rainwater, water) include this consideration and explain your rationale for doing so;
- Your choice of denominator for this product; for example, which production figures you are referring to, e.g. nameplate capacity, gross production, net production, etc;
- The trend reported in column 4 and give a company-specific explanation of the thresholds used to provide the trend; and
- If the information provided is based on collected, calculated data using models or other secondary information and provide details of the methodology for the estimation.
- Indicate the anticipated future trends, if known (note that future trends should be at least one year after the end of the reporting year provided in W0.2).
- If the intensity metric is restricted to a specific area/boundary, e.g. company-wide, power generation source, value-chain, joint ventures, country, etc. please include this boundary and the explanation for it.
- Explain how the metric is used within your organization, for example to set specific targets/goals relating to water efficiency, to guide water strategy, to set remuneration incentives etc.
- Additionally, you may also wish to include any weighting you use in your calculation of the intensity value to arrive at a more precise intensity value for an aggregate of countries, business units, products, etc. For example, this may be because of large variations in intensity between different areas.
Explanation of terms
- Water intensity: A metric providing the relationship between a volumetric aspect of water and a unit of production, financial metric or any other unit.
(W-FB1.3) Do you collect/calculate water intensity for each commodity reported in question W-FB1.1a?
Question dependencies
- This question only appears if you select “Neutral” “Important” or “Vital” as your “Direct use importance rating” or your “Indirect use importance rating” in response to W1.1.
- Your response to W-FB1.3 will determine whether W-FB1.3a and W-FB1.3b are presented. If your response to W-FB1.3 is amended, data in those dependent
questions may be erased. In this case, be sure to re-enter data for W-FB1.3a and W-FB1.3b.
Change from 2019
No change
Rationale
This metric is being introduced to encourage organizations with activities in the food, beverage & tobacco sector to collect water intensity data with a view to facilitating the development of meaningful intensity metrics and improving water use efficiency.
In this sector the main water withdrawals in terms of volume lie in the agricultural production stage of the value chain. For this reason, organizations are asked to provide their water intensity metric in relation to each of the revenue-dependent commodities indicated in question W-FB1.1a. Water intensities will naturally vary according to local context factors like climate, soil, agricultural practices, crop varieties, or water management. Nevertheless, data users seek improved transparency around the calculation of such metrics to enable performance monitoring and high-level benchmarking.
In addition to total water volumes, water intensity metrics provide a complementary indicator to help identify efficiencies and opportunities for the reduction in water withdrawals or consumption.
This aligns with public policy goals related to water at all levels, such as the Sustainable Development Goal 6.4.1.
Response options
Please complete the following table. You are able to add rows by using the “Add Row” button at the bottom of the table.
| Agricultural commodities
|
Water intensity information for this produced commodity is collected/calculated
|
Water intensity information for this sourced commodity is collected/calculated
|
Please explain
|
|
Select from:
- Drop-down options from the selection in W-FB1.1a
- Other commodities from W-FB1.1a, please specify
|
Select from:
- Yes
- No, not currently but we intend to collect/calculate this data within the next two years
- No, not currently and we have no plans to collect/calculate this data within the next two years
- Not applicable
|
Select from:
- Yes
- No, not currently but we intend to collect/calculate this data within the next two years
- No, not currently and we have no plans to collect/calculate this data within the next two years
- Not applicable
|
Text field [maximum 1,000 characters]
|
[Add Row]
Requested content
General
- Organizations are expected to provide information for each of the commodities they reported in W-FB1.1a.
Agricultural commodities (column 1)
- You should add extra rows to include all the commodities reported in W-FB1.1a.
- For every commodity that you reported in W-FB1.1a using the “Other, please specify” option you need to report this again in this question by selecting the option “Specify any additional commodities reported in W-FB1.1a” and providing a label for the agricultural commodity in the text field provided.
Water intensity information for this produced commodity is collected/calculated (column 2)
- Only select “Not applicable” if your organization does not produce the commodity in question.
Water intensity information for this sourced commodity is collected/calculated (column 3)
- Only select “Not applicable” if your organization does not source the commodity in question.
Please explain (column 4)
- Provide any clarification needed for data users to understand your response.
- Where applicable, explain any differences between the approach taken for produced or sourced commodities.
- If the intensity metric is restricted to a specific area/boundary, e.g. company-wide, value-chain, joint ventures, country, etc. please include this boundary and the explanation for exclusions.
- Provide an explanation for selecting “No, not currently but we intend to collect/calculate this data within the next two years” or “No, not currently and we have no plans to collect/calculate this data within the next two years”; e.g. if it is the result of a decision, or if it has not been considered.
Example response
| Agricultural commodities |
Water intensity information for this produced commodity is collected/calculated |
Water intensity information for this sourced commodity is collected/calculated |
Please explain |
|
Maize |
Yes
|
Yes
|
Maize is a key ingredient in our products. We produce this crop as well as source it from local producers. Maize is irrigated the regions in which we operate.We have detailed control of crop water consumption in our operations which we use to calculate our water intensity data. In the case of supplied maize we use regional averages of water consumption and crop yield data. We are working with suppliers to collect water intensity figures based on field data.
|
Sugar
|
Yes
|
Yes
|
Sugar is a key ingredient in our products. We produce rainfed and irrigated sugar cane in our own lands (approx. 70% of our supply of sugar), as well as source from local producers. We have detailed control of crop water consumption in our operations which we use to calculate our water intensity data. In the case of our supplied products we use regional averages of water consumption and crop yield data. We are working with suppliers to collect water intensity figures based on field data.
|
Palm oil
|
Not applicable
|
Yes
|
As part of our water risk assessment we evaluate the sustainability of our palm oil procurement. Palm oil was identified as a key commodity in our supply chain associated with environmental and business risks. We use regional averages of water consumption and crop yield data to calculate water intensity data in a high-level initial assessment. We have been developing engagement with our key providers for the last 2 years. We are developing procedures to collect actual water consumption data in our palm oil supply chain.
|
Cocoa
|
Not applicable
|
No, not currently but we intend to collect/calculate this data within the next two years.
|
As part of our water risk assessment we evaluate the sustainability of our chocolate supply chain. Cocoa was identified as a key commodity in our supply chain to address environmental and business risks and we intend to make a high-level initial assessment in 2019. We are also developing engagement with our key chocolate providers, developing procedures to collect actual water consumption data in our cocoa supply chain.
|
Beans
|
Yes
|
No, not currently but we intend to collect/calculate this data within the next two years.
|
Our beans and pulses production is done in rotation with our maize and sugarcane production. We have detailed control of crop water consumption in our operations which we use to calculate our water intensity data. In the case of supplied products we use regional averages of water consumption and crop yield data. We source a small part of our pulses requirement and we decided to focus our supplier engagement efforts on other crops.
|
Explanation of terms
- Water Intensity: A metric providing the relationship between a volumetric aspect of water and a unit of production, financial metric or any other unit.
(W-FB1.3a) Provide water intensity information for each of the agricultural commodities identified in W-FB1.3 that you produce.
Question dependencies
- This question is presented if you select the option "Yes" in column 2 of W-FB1.3 for any commodity.
Change from 2019
Minor change
Rationale
The focus of this question is to ensure that organizations are monitoring the water intensity of their key produced commodities and that they are aware of the underlying factors that determine trends in product water intensity. It is acknowledged that water intensities will naturally vary according to local context factors like climate, soil, agricultural practices, crop varieties, or water management factors.
Additionally, it may clarify how this metric is calculated including what water aspects were accounted for, how such factors may affect the metrics, or what company boundaries were used. Specifying a type of metric allows data users to understand common practice in the industry.
Connection to other frameworks
SDG
Goal 6: Clean water and sanitation
Response options
Please complete the following table. You are able to add rows by using the “Add Row” button at the bottom of the table.
| Agricultural commodity
|
Water intensity value (m3)
|
Numerator: Water aspect
|
Denominator |
Comparison with previous reporting year
|
Please explain
|
|
Select from:
- Drop-down options for the produced commodities
selected in W-FB1.3
- Other produced commodities from W-FB1.3, please specify
|
Numerical field [enter
a number from 0-999,999,999,999 using a maximum of 2 decimal places]
|
Select from:
- Freshwater withdrawals
- Freshwater consumption
- Total water withdrawals
- Total water consumption
- Other, please specify
|
Select from:
- Dozens
- Kilograms
- Tons
- Liters
- Other, please specify
|
Select from:
- Much lower
- Lower
- About the same
- Higher
- Much higher
- This is our first year of measurement
|
Text field [maximum 1,000 characters]
|
[Add Row]
Requested content
General
- Provide details of the water intensity for the agricultural commodities that you produce. This should be a company-wide average value for each of the products. For a single commodity, a company may, however, have reasons to use different metrics across their operations. Provide the most relevant metric for a product and a justification of your choice in column 6 (Please explain).
Agricultural commodities (column 1)
- For every produced commodity that you reported in W-FB1.3, please add a row to provide water intensity information.
Water intensity value (column 2)
- Provide your water intensity value. You should use cubic meters (m3) for the water aspect.
Change from last reporting year (column 5)
- CDP does not define the threshold for considering a value as “much higher” rather than simply “higher” (or “much lower”/”lower”). CDP requests this information from many different organizations with significant variations in water use.
- Please define your own threshold for what is “much higher” (and “much lower”) and apply it consistently so that each year the reported data for this question is comparable and data users can track your water accounts more effectively. A company-specific explanation for these thresholds should be provided in column 6 (Please explain).
Please explain (column 6)
- Provide any clarification needed for data users to understand your response:
- Please explain:
- Your choice of numerator for this product. If you excluded any water source (e.g. rainwater) include this consideration and explain your rationale for doing so;
- Your choice of denominator for this product; and
- The trend reported in column 5 and give a company-specific explanation of the thresholds used to provide the trend.
- Indicate the anticipated future trends, if known (note that future trends should be at least one year after the end of reporting year provided in W0.2).
- Explain how the metric is used within your organization; e.g. to set specific targets/goals relating to water efficiency, to guide water strategy, to set remuneration incentives etc.
- Additionally, you may also wish to include any weighting you use in your calculation of the intensity value to arrive at a more precise intensity value for an aggregate of countries, business units, products, etc. For example, this could be because of large variations in intensity between different areas.
Explanation of terms
- Water intensity: A metric providing the relationship between a volumetric aspect of water and a unit of production, financial metric or any other unit.
Example response
| Agricultural commodity |
Water intensity value |
Numerator: water aspect |
Denominator |
Comparison with previous reporting year |
Please explain |
Maize
|
1706
|
Freshwater consumed
|
Tons
|
About the same |
The value is the average evapotranspiration from our maize fields, weighted according to the production volume in our farms. 2016-2017 was a drier-than-average year. However, we reduced the cultivated area and maintained irrigation volumes to an average of 2,100 m3/ha. This made that the average water intensity value was only 7% lower. We assume decreases/increases in water intensity values of 15% to be moderate. The total freshwater consumed value includes the consideration of rain and irrigation water use. Rainwater use data is based on local precipitation and soil data. We collect these data to optimize irrigation, internally benchmark our facilities and set priorities for irrigation management investments. It also helps us to set tighter targets to reduce our water demand in water stressed areas.
|
Sugar
|
146
|
Freshwater consumed
|
Tons
|
Higher
|
The value is the average evapotranspiration for our rainfed and irrigated sugarcane, weighed according to the production volume in our farms. Average rainfed water intensity is 185 m3/t. Average irrigated water intensity is 146 m3/t. 2016-2017 was a drier-than-average year, which lead us to reduce irrigated area. Hence our average water intensity was a 34% higher than the previous year. We assume decreases/increases in water intensity values of 15% to be moderate. Irrigation amounted to an average of 450 m3/ha in comparison to 700 m3/ha in the previous year. The total freshwater consumed value includes the consideration of rain and irrigation water use. Water use in the sugar mill is not included in this figure. We collect these data to optimize irrigation, internally benchmark our facilities and set priorities for irrigation management investments. It also helps us to set tighter targets to reduce our water demand in water stressed areas.
|
Beans
|
1323
|
Freshwater consumed
|
Tons
|
About the same
|
The value is the average evapotranspiration, weighted according to the production volume in our farms. The values range from 1,670 to 1,025 m3/t. The ranges depend on local soil and climate conditions. In our bean production, we use supplementary irrigation in drier years. 2016-2017 was an drier-than-average year in hydrological terms. This value excludes water use in the processing facilities, since it is less than 1% of the total intensity figure. We use this data to internally benchmark our facilities and optimize irrigation. |
(W-FB1.3b) Provide water intensity information for each of the agricultural commodities identified in W-FB1.3 that you source.
Question dependencies
- This question is presented if you select the option "Yes" in column 3 of W-FB1.3 for any commodity.
Change from 2019
Minor change
Rationale
The focus of this question is to ensure that organizations are monitoring the water intensity of their key sourced commodities and that they are aware of the underlying factors that determine their trend for this metric. It is acknowledged that water intensities will naturally vary according to local context factors like climate, soil, agricultural practices, crop varieties or water management factors.
Additionally, it may clarify how this metric is calculated including what water aspects were accounted for, how such factors may affect the metrics, or what company boundaries were used. Specifying a type of metric allows thus data users to understand common practice in the industry.
Connection to other frameworks
SDG
Goal 6: Clean water and sanitation
Response options
Please complete the following table. You are able to add rows by using the “Add Row” button at the bottom of the table.
| Agricultural Commodities
|
Water intensity value (m3)
|
Numerator: Water aspect
|
Denominator |
Comparison with previous reporting year
|
Please explain
|
|
Select from:
- Drop-down options for the sourced commodities selected in W-FB1.3
- Other sourced commodities from W-FB1.3, please specify
|
Numerical field [enter
a number from 0-999,999,999,999 using a maximum of 2 decimal places]
|
Select from:
- Freshwater withdrawals
- Freshwater consumption
- Total water withdrawals
- Total water consumption
- Other, please specify
|
Select from:
- Dozens
- Kilograms
- Liters
- Tons
- Other, please specify
|
Select from:
- Much lower
- Lower
- About the same
- Higher
- Much higher
- This is our first year of measurement
|
Text field [maximum 1,000 characters]
|
[Add Row]
Requested content
General
- Provide details of the water intensity from the agricultural commodities that you source This should be a company-wide average value. For a single commodity, a company may, however, have reasons to use different metrics. Provide the most relevant metric for a sourced commodity and a justification of your choice in column 6 (Please explain).
Agricultural commodities (column 1)
- For every sourced commodity that you reported in W-FB1.3, please add a row to provide water intensity information.
Water intensity value (column 2)
- Provide your water intensity value. You should use cubic meters (m3) for the water aspect.
Comparison with previous reporting year (column 5)
CDP does not define the threshold for considering a value as “much higher” rather than simply “higher” (or “much lower”/”lower”). CDP requests this information from many different organizations with significant variations in water use.Please define your own threshold for what is “much higher” (and “much lower”) and apply it consistently so that each year the reported data for this question is comparable and data users can track your water accounts more effectively. A company-specific explanation for these thresholds should be provided in column 6 (Please explain).Please explain (column 6)
- Provide any clarification needed for data users to understand your response, including its scope:
- Please explain:
- Your choice of numerator for this product If you excluded any water source (e.g. rainwater) include this consideration and explain your rationale for doing so;
- Your choice of denominator for this commodity; and
- The trend reported in column 5 and give a company-specific explanation of the thresholds used to provide the trend.
- Indicate the anticipated future trends, if known (note that future trends should be at least one year after the end of the reporting year provided in W0.2).
- Explain how the metric is used within your organization, e.g. to set specific targets/goals relating to water efficiency, to guide water strategy, to set remuneration incentives etc.
- Additionally, you may also wish to include any weighting you use in your calculation of the intensity value to arrive at a more precise intensity value for an aggregate of countries, business units, products, etc. This may be because of large variations in intensity between different areas.
Explanation of terms
- Water intensity: A metric providing the relationship between a volumetric aspect of water and a unit of production, financial metric or any other unit.
Example response
| Agricultural commodities
|
Water intensity value
|
Numerator: Water aspect
|
Denominator |
Comparison with previous reporting year
|
Please explain
|
Maize
|
1810
|
Total water consumption
|
Tons
|
About the same
|
The value is the average maize evapotranspiration for a normal hydrological year in the areas where we have suppliers, weighted according to the sourced tons. Hence this value does not vary from year to year until we develop further engagement with our suppliers. The data was obtained from data of the regional research institutes. The total freshwater consumed value includes the consideration of precipitation and irrigation water use. This data considers irrigation in the area to average 500 m3/ha. We collect these data to internally benchmark our facilities against local average and set priorities for irrigation management investments.
|
Sugar
|
160
|
Total water consumption
|
Tons
|
About the same
|
The value is the average sugarcane evapotranspiration for a normal hydrological year in the areas where we have suppliers, weighted according to the sourced tons from each of the regions. Hence this value does not vary much from year to year until we develop further engagement with our suppliers The data was obtained from the regional research institutes. The total freshwater consumed value includes the consideration of rainwater since irrigation is not common in local farms. Water use in the sugar mill is not included in this figure. We collect these data to internally benchmark our facilities against local average and set priorities for irrigation management investments.
|
Palm oil
|
727
|
Total water consumption
|
Tons
|
About the same
|
We have made a preliminary assessment of water risk in our supply chain and used the water intensity values to identify hotspots of high water consumption in areas with lower availability, interannual variability and/or land use issues. We have carried out a supplier assessment and 65% of the product comes from west and central Kalimantan. While 24% comes from Cauca valley in Colombia. The value provided in column 2 is the regional average water consumption for oil palm production in west Kalimantan, Indonesia. The water consumption in oil palm in the Cauca valley is 623 m3/t on average. Hence this value does not vary significantly from year to year until we develop further engagement with our suppliers. Additionally, as part of our engagement with the suppliers to address other ESG issues like deforestation we are focusing engagement with suppliers sourcing from Indonesia. In future years we will work further to refine the assessment of water intensity and validate it with more local information. This evaluation focuses on the water consumption in the crop, not considering water use or pollution in the processing of the fruits.
|
(W-MM1.3) Do you calculate water intensity information for your metals and mining activities?
Question dependencies
- This question only appears if you select “Neutral” “Important” or “Vital” as your “Direct use importance rating” or your “Indirect use importance rating” in response to W1.1.
- Your response to W-MM1.3 will determine whether W-MM1.3a is presented. If your response to W-MM1.3 is amended, data in W-MM1.3a may be erased. In this case, be sure to re-enter data for W-MM1.3a.
Change from 2019
No change
Rationale
This metric is being introduced to encourage organizations with activities in the metals & mining sector to collect intensity data with a view to facilitating the development of meaningful intensity metric and improving water use efficiency. Data users seek improved transparency around the calculation of such metrics to enable performance monitoring and high-level benchmarking.
In addition to total water volumes, water intensity metrics provide a complementary indicator to help identify efficiencies and opportunities for the reduction of water withdrawals and consumption.
This aligns with public policy goals related to water at all levels, such as the Sustainable Development Goal 6.4.1.
Response options
Select one of the following options:
- Yes
- No, but we intend to do so within the next two years
- No, and we have no plans to do so in the next two years
Requested content
General
- Only select a “No” option if you do not currently calculate and collect any water intensity data in your metals & mining sector activities.
Explanation of terms
- Water intensity: A metric providing the relationship between a volumetric aspect of water and a of production, financial metric or any other unit.
(W-MM1.3a) For your top five products by revenue, provide the following intensity information associated with your metals and mining activities.
Question dependencies
- This question only appears if you select “Yes” to question W-MM1.3.
Change from 2019
Minor change
Rationale
Various methods exist for calculating water intensity in the metal & mining sector, and it is acknowledged that water intensities will naturally vary according to local context factors like geology, landscape, hydrology, the mining and methods used, or ore grades.
Specifying a type of metric allows data users to understand common practice in the industry. This question provides them with information on how organizations determine a water intensity metric and are aware of the underlying factors that affects their trend.
- Note that the question does not ask for an organization to provide water intensity data. CDP is taking a staged approach to this disclosure.
Connection to other frameworks
SDG
Goal 6: Clean water and sanitation
Response options
Please complete the following table. You are able to add rows by using the “Add Row” button at the bottom of the table.
| Product
|
Numerator: Water aspect
|
Denominator |
Comparison with previous reporting year
|
Please explain
|
|
Text field [maximum 100 characters]
|
Select from:
- Freshwater withdrawals
- Freshwater consumption
- Total water withdrawals
- Total water consumption
- Freshwater use
- Total water use
- Other, please specify
|
Select from:
- Ton of material moved
- Ton of ore mined
- Ton of ore processed
- Ton of final product
- Ounce of final product
- Thousand carats of final product
- Other, please specify
|
Select from:
- Much lower
- Lower
- About the same
- Higher
- Much higher
- This is our first year of measurement
|
Text field [maximum 2,000 characters]
|
[Add Row]
Requested content
General
- Provide details of your water intensity metric(s) for up to 5 products. The question does not ask for water intensity data. If reporting 5 products is not possible, an explanation should be provided in column 5 (Please explain).
Product (column 1)
- Please add up to five rows to provide up to 5 products in terms of revenue for which you calculate a water intensity metric.
- The description provided should allow data users to identify the product it refers to, e.g., gold or platinum group metals.
Comparison with previous reporting year (column 4)
- CDP does not define the threshold for considering a value as ‘much higher’ rather than simply ‘higher’ (or ‘much lower’/’lower’). CDP requests this information from many different industries with huge variations in water use, and it would therefore be difficult to provide a universal threshold that is meaningful (as proportions will equate to different absolute values and impacts).
- CDP recommends that you define your own threshold for what is ‘much higher’ (and ‘much lower’) and apply it consistently so that each year the reported data for this question is comparable and data users can track your water accounts more effectively. A company-specific explanation for these thresholds should be provided in column 5 (Please explain).
Please explain (column 5)
- Provide any clarification needed for data users to understand your response including indication of any factors affecting your water intensity and the trend you reported, for example arising from local context or geological factors, like ore grade variations.
- Please explain:
- Your choice of numerator for this product. If you excluded any water source (e.g. rainwater) include this consideration and explain your rationale for doing so;
- Your choice of denominator for this product; and
- The trend reported in column 4 and give a company-specific explanation of the thresholds used to provide the trend.
- Indicate the anticipated future trends, if known (note that future trends should be at least one year after the end of the reporting year provided in W0.2).
- If the intensity metric is restricted to a specific area/boundary, e.g. company-wide, value-chain, joint ventures, country, etc. please include this boundary and the explanation for it.
- Explain how the metric is used within your organization, for example to set specific targets/goals relating to water efficiency, to guide water strategy, to set remuneration incentives etc.
- Additionally, you may also wish to include any weighting you use in your calculation of the intensity value to arrive at a more precise intensity value for an aggregate of countries, business units, products, etc. This may be because of large variations in intensity between different areas.
- If you wish to provide a specific intensity figure you may do so here.
Explanation of terms
- Water use (metals & mining sector only): The term 'water use' in mining operations is equivalent to the term 'total water to tasks', the sum of worked and raw water to tasks, used in the Water Accounting Framework from the Mineral Council of Australia.
- Water intensity: A metric providing the relationship between a volumetric aspect of water and a unit of production, financial metric or any other unit.
- Tasks: Tasks are operational activities that use water, i.e. dust suppression, underground mining, ore suppression, CHPP (coal handling and processing plant), or Tailings Storage Facility (TSF).
- Revenue: Income arising in the course of an entity's ordinary activities (less discounts, allowances and returns) - before deducting costs for the goods/services sold and operating expenses to arrive at profit (based on the International Financial Reporting Standard).
(W-OG1.3) Do you calculate water intensity for your activities associated with the oil & gas sector?
Question dependencies
- This
question only appears if you select “Neutral” “Important” or “Vital” as your
“Direct use importance rating” or your “Indirect use
importance rating” in response to W1.1.
- Your response to W-OG1.3 will determine whether W-OG1.3a is presented. If your response to W-OG1.3 is amended, data in W-OG1.3a may be erased. In this case, be sure to re-enter data for W-OG1.3a.
Change from 2019
No change
Rationale
Water intensity is already a commonly-calculated and reported metric in the oil & gas industry. This metric is being introduced to further encourage organizations to collect intensity data with a view to improving water use efficiency.
In addition to total water volumes, water intensity metrics provide a complementary indicator to help identify efficiencies and reduction opportunities in water withdrawals or consumption. Data users also seek improved transparency around the calculation of such metrics to enable performance monitoring and high-level benchmarking.
This aligns with public policy goals at all levels, including Sustainable Development Goal 6.4.1.
Response options
Select one of the following options:
- Yes
- No, but we intend to do so within the next two years
- No, and we have no plans to do so in the next two years
Requested content
General
- Only select a “No” option if you do not currently calculate and collect any water intensity data in your oil & gas activities.
Explanation of terms
- Water intensity: A metric providing the relationship between a volumetric aspect of water and a unit of production, financial metric or any other unit.
(W-OG1.3a) Provide water intensity information associated with your activities in the oil & gas sector.
Question dependencies
- This question only appears if you select "Yes" to question W-OG1.3.
Change from 2019
Minor change
Rationale
The focus of this question is to determine which metric organizations are using to monitor their water intensity, and that they are aware of the underlying factors that determine their trend in this metric. Specifying a type of metric also allows data users to understand common practice in the industry.
Various methods exist for calculating water intensity for the oil & gas sector. It is acknowledged that water intensities will naturally vary according to local context factors like geology, hydrology, or technology used.
Connection to other frameworks
SDG
Goal 6: Clean water and sanitation
Response options
Please complete the following table. You are able to add rows by using the “Add Row” button at the bottom of the table.
| Business division
|
Water intensity value (m3)
|
Numerator: water aspect
|
Denominator |
Comparison with previous reporting year
|
Please explain
|
|
Select all that apply:
- Upstream
- Midstream/Downstream
- Chemicals
- Other, please specify
|
Numerical field [enter
a number from 0-999,999,999,999 using a maximum of 2 decimal places]
|
Select from:
- Freshwater withdrawals
- Total withdrawals
- Freshwater consumption
- Total water consumption
- Other, please specify
|
Select from:
- Barrel of oil equivalent
- Barrel of crude oil throughput
- Barrel of petrochemical product
- Other, please specify
|
Select from:
- Much lower
- Lower
- About the same
- Higher
- Much higher
- This is our first year of measurement
|
Text field [maximum
2,000 characters]
|
[Add Row]
Requested content
General
- Provide details of your water intensity metrics. If you have several metrics for each of the business divisions or for various products you may add rows for each of them.
Water intensity value (column 2)
- Provide your water intensity value. You should use cubic meters (m3) for the water aspect.
Comparison with previous reporting year (column 5)
-
CDP does not define the threshold for considering a value as ‘much higher’ rather than simply ‘higher’ (or ‘much lower’/’lower’). CDP requests this information from many different industries with huge variations in water use, and it would therefore be difficult to provide a universal threshold that is meaningful (as proportions will equate to different absolute values and impacts).
- CDP recommends that you define your own threshold for what is ‘much higher’ (and ‘much lower’) and apply it consistently so that each year the reported data for this question is comparable and data users can track your water accounts more effectively. A company-specific explanation for these thresholds should be provided in column 6 (Please explain).
Please explain (column 6)
- Provide any clarification needed for data users to understand your response including indication of any factors affecting your water intensity and the trend you reported, for example arising from local context or geological factors.
- Please explain:
- Your choice of numerator for this product;
- Your choice of denominator for this product; and
- The trend reported in column 5 and give a company-specific explanation of the thresholds used to provide the trend.
- Indicate the anticipated future trends, if known (note that future trends should be at least one year after the end of the reporting year provided in W0.2).
- If the intensity metric is restricted to a specific area/boundary, e.g. company-wide, value-chain, joint ventures, country, etc. please include this boundary and the explanation for it.
- Explain how the metric is used within your organization, for example to set specific targets/goals relating to water efficiency, to guide water strategy, to set remuneration incentives etc.
- Additionally, you may also wish to include any weighting you use in your calculation of the intensity value to arrive at a more precise intensity value for an aggregate of countries, business units, products, etc. For example, this may be because of large variations in intensity between different areas.
Explanation of terms
- Water intensity: A metric providing the relationship between a volumetric aspect of water and a unit of production, financial metric or any other unit.
Value-chain engagement
(W1.4) Do you engage with your value chain on water-related issues?
Question dependencies
- This question only appears if you select “Neutral”, “Important”, or “Vital” as your “Indirect use importance rating” in response to W1.1.
- Your response to W1.4 prompts subsequent questions. If your response to W1.4 is amended, data already entered in those dependent questions may be erased. In this case, be sure to re-enter data for all relevant questions. The guidance for each question indicates if it is a dependent question.
Change from 2019
No change
Rationale
Companies indicating in W1.1 that water is important in their indirect operations, either upstream and/or downstream, can explain how they are engaging with their value chain beyond their direct operations to manage risks, take collective action or facilitate the transition to a water secure future.
There are multiple drivers and benefits and engagement ranges from mandating supplier reporting of water use and risks to innovative partnerships for water stewardship with product users.
The questions in this section are based on CDP’s extensive experience through its supply chain program. Companies need to rationalize their engagement and its coverage, and so this section is not seeking evidence of engagement throughout your value chain. Companies are asked to explain their engagement strategy (e.g. by operational risk, location in stressed areas etc.), and whether, for example, its scope extends to tier 2 suppliers.
- Note that this does not ask for the water accounting data of your value chain.
Connection to other frameworks
CEO Water Mandate
Response: Internal actions
Response options
Select all that apply from the following options:
- Yes, our suppliers
- Yes, our customers or other value chain partners
- No, not currently but we intend to within the next two years
- No, we do not engage with our value chain on water
Requested content
General
- You should select all that apply for the reporting year.
- If you select either of the "No" responses, do not select any other options.
Explanation of terms
- Value chain: The entire sequence of activities or partners that provide value to or receive value from an organization’s products and services, either within, upstream or downstream of direct operations.
- Value chain partner: A value chain partner includes any organization/individual a company that provides or receives value from the organisation’s products and services, up or downstream of its direct activities; for example, a customer, a franchisee or contractor the company engages with on water stewardship strategies.
(W1.4a) What proportion of suppliers do you request to report on their water use, risks and/or management information and what proportion of your procurement spend does this represent?
Question dependencies
- This question only appears if you select “Yes, our suppliers” in response to W1.4.
Change from 2019
No change
Rationale
Your supplier engagement activity, such as the percentage of suppliers that report their water management, risks and opportunities, is of interest to investors and other data users wishing to know whether you have a complete picture of the role of water in your value chain and how water security is being protected or progressed.
Connection to other frameworks
CEO Water Mandate
Response: Internal actions
SDG
Goal 12: Responsible consumption and production
Response options
Please complete the following table:
|
% of suppliers by number
|
% of total procurement spend
|
Rationale for this coverage
|
Impact of the engagement and measures of success
|
Comment
|
|
Select from:
- None and we do not plan to request this from suppliers
- None currently, but we plan to request this within the next two years
- Less than 1%
- 1-25
- 26-50
- 51-75
- 76-100
- Unknown
|
Select from:
- Less than 1%
- 1-25
- 26-50
- 51-75
- 76-100
- Unknown
|
Text field [maximum
1,000 characters]
|
Text field [maximum 1,000 characters]
|
Text field [maximum 500 characters]
|
Requested content
General
- The focus of this question is your approach to supplier reporting of their water use, risks, and management. For example, this might include information relevant to understanding impacts and risks such as water accounting data, water dependency, water pollution incidents, and risk response.
% of suppliers by number (column 1)
- Select the proportion of suppliers requested by your organization to report water-related information. For example, if you have 100 suppliers and you request 20 of them to report you would select “1-25%” here.
- If you engage with none of your suppliers in this way please provide an explanation in column 3 (Rationale).
- If the figure is unknown, you may provide an estimate or select ‘Unknown’ and explain why in column 3 (Rationale). For example, this may be because of a lack of resources or instruction from management, or because of poor supplier tracking.
% of total procurement spend (column 2)
- Select the proportion of your procurement spend represented by the suppliers you request to report on water related information.
- For example, 20% of your suppliers by number may account for 80% of your total procurement spend.
- Note that it is not assumed that this figure is an indication of the level of risk within your supply chain.
- If the figure is unknown you may provide an estimate or select ‘Unknown’ and explain why in column 3 (Rationale).
Rationale for the coverage (column 3)
- Use this space to provide details as to how your suppliers are selected for engagement e.g. how your coverage is determined or prioritized.
- Also include any further details required to understand the rationale for the coverage reported in columns 1 and 2, and why you request your suppliers to report on their water use, risks, and management.
- If you indicated in column 1 (% suppliers by number) that you do not request your suppliers to report on water-related issues, or if the figure in columns 1 and 2 is unknown or estimated, you should explain why, including a company-specific reason for any plans.
Impact of the engagement and measures of success (column 4)
- Briefly describe the information that suppliers are requested to report to you and how the information is used.
- Include the beneficial outcomes of requesting your suppliers to report on their water use, risks, and management. Beneficial outcomes can be either potential or already realized.
- Additionally, describe here how success is measured, for example which metrics you use to assess the success of this engagement activity, and explain why these measures were selected.
Comment (column 5)
Example response
| % of suppliers by number
|
% of total procurement spend
|
Rationale for this coverage
|
Impact of the engagement and measures of success
|
Comment
|
| 51-75
|
51-75
|
As an auto manufacturing organization with global operations in Mexico, India and the United States, a significant proportion of our supply chain are also located in these regions for ease of supply. Our organization requests over 4% of its suppliers (ca. 4,102 out of 99,081), representing ca. 65% of the total procurement spend, to report on water. This comprises all of our tier 1 and tier 2 suppliers that are located in regions currently or potentially affected by physical risks (i.e. water scarcity) or regulatory risks (i.e. local tariffs). This is because it is not feasible to assess all of our suppliers.
Suppliers are incentivized to report through our supply contracts which request that they comply with the sustainability standards as defined in our Supplier Code of Conduct. Our organization provides substantial documentation, literature and other resources for all suppliers.
|
In order to maintain key supplier status within our procurement strategy, we require all tier 1 and tier 2 suppliers with a reliance on water operating in these water-stressed regions to report on both direct and indirect use of water, the water availability of the region, and water-related potential risks.
In situations where the result of this reporting is deemed unacceptable or critical, suppliers are requested to rectify the identified problems within an allocated time period based on a specific action plan.
Ultimately, we have found this collaboration has helped us to maintain our level of production across the value chain. We set ambitious targets and measure success in terms of target fulfillment, e.g. our target to evaluate all strategically important suppliers by the end of 2017. Success is additionally measured through re-assessments or follow-up audits.
|
|
(W1.4b) Provide details of any other water-related supplier engagement activity.
Question dependencies
- This question only appears if you select “Yes, our suppliers” in response to W1.4.
Change from 2019
Minor change
Rationale
Details of your engagement activity, such as the percentage of suppliers and the percentage of procurement spend it covers, is of interest to investors and other data users wishing to know whether you have a complete picture of the role of water in your value chain and how water security is being protected or progressed. The nature of your engagement activities provides insight into your approach to water stewardship and collective action to address water challenges for your company, and to support public policy objectives, be they local or otherwise, such as the SDGs.
This question gives companies the opportunity to explain their approach and informs the data that is reported in W4 regarding both exposure to risks throughout the value chain and the company’s response.
Connection to other frameworks
CEO Water Mandate
Response: Internal actions
Response options
Please complete the following table. You are able to add rows to this table using the "Add Row" button.
|
Type of engagement
|
Details of engagement
|
% of suppliers by number
|
% of total procurement spend
|
Rationale for the coverage of your engagement
|
Impact of the engagement and measures of success
|
Comment
|
|
Select from:
- No other supplier engagements
- Onboarding & compliance
- Incentivizing for improved water management and stewardship
- Innovation & collaboration
- Other
|
Select all that apply:
- Response drop-down options below table
|
Select from:
- None
- Less than 1%
- 1-25
- 26-50
- 51-75
- 76-100
- Unknown
|
Select from:
- None
- Less than 1%
- 1-25
- 26-50
- 51-75
- 76-100
- Unknown
|
Text field [maximum 1,000
characters]
|
Text field [maximum 1,000 characters]
|
Text field [maximum 500 characters]
|
[Add Row]
Details of engagement (column 2)
|
Onboarding & compliance
- Inclusion of water stewardship and risk management in supplier selection mechanism
- Requirement for water-related targets is included in your supplier selection mechanism
- Requirement to adhere to our code of conduct regarding water stewardship and management
- Other, please specify
Incentivizing for improved water management and stewardship
- Demonstrable progress against water-related targets is incentivized in your supplier relationship management
- Water management and stewardship action is integrated into your supplier evaluation
- Water management and stewardship is featured in supplier awards scheme
- Offer financial incentives to suppliers reducing your operational water impacts through the products they supply to you
- Offer financial incentives to suppliers improving water management and stewardship across their own operations and supply chain
- Other, please specify
|
Innovation & collaboration
- Encourage/incentivize innovation to reduce water impacts in products and services
- Encourage/incentivize suppliers to work collaboratively with other users in their river basins
- Provide training and support on sustainable agriculture practices to improve water stewardship (food, beverage & tobacco sector only)
- Educate suppliers about water stewardship and collaboration
- Other please specify
Other
|
Requested content
General
- In this question you have the opportunity to report your different supplier engagement activities (in addition to the supplier reporting activity reported in W1.4a) and to describe how it is driving water security.
Type of engagement (column 1)
- If your organization uses more than one of the three types of supplier engagement listed, or wishes to report an additional engagement type (select ‘Other’), please add rows as needed.
- If your organization has no supplier engagement activity (other than that indicated in W1.4a), please select “No other supplier engagement” and use column 5 (Rationale) to explain why this is the case. Note that all other columns in this question will be disabled.
Details of engagement (columns 2)
- Your selection in column 1 will determine the options shown in column 2. If you select “Other, please specify”, please provide a label for the details of engagement.
% of suppliers by number (column 3)
- Select the proportion of your suppliers that are covered by the engagement activity.
- For example, if you have 100 suppliers and 20 of them are engaged in the activity specified in column 2 (Details of engagement) you would select “1-25%” here.
- If the figure is unknown you may provide an estimate or select ‘Unknown’ and explain why in column 5 (Rationale). For example, this may be because of a lack of resources or instruction from management, or because of poor supplier tracking.
% of total procurement spend (column 4)
- Select the proportion of your procurement spend represented by the engagement activity specified in column 2 (Details of engagement).
- For example, 20% of your suppliers by number may account for 80% of your total procurement spend.
- Note that it is not assumed that this figure indicates the level of risk within your supply chain.
- If the figure is unknown you may provide an estimate or select ‘Unknown’ and explain why in column 5 (Rationale).
Rationale for the coverage of your engagement (column 5)
- Include any details that would help data users to understand why you use this type of engage activity with your suppliers, and give a rationale for the coverage you indicated in columns 3 and 4.
- If you indicated in column 1 (% suppliers by number) that you do not use any supplier engagement, or if the figure in columns 3 and 4 is unknown or estimated, you should explain why, including a company-specific reason and any plans.
Impact of the engagement and measures of success (column 6)
- Detail the beneficial outcomes of the engagement activity. Beneficial outcomes can be either potential or already realized. For example, you may wish to describe how the engagement has progressed or protected water security for your company or for other users, or how it has helped your company or your suppliers to build resilience.
- Additionally, describe here how success is measured, for example which metrics you use to assess the success of this engagement activity, and explain why these measures were selected.
Comment (column 7) (optional)
- If you wish to explain any other aspect of your approach to engagement with suppliers, please use this column.
Explanation of terms
- Onboarding: The process used to support and facilitate working with a new supplier.
(W1.4c) What is your organization’s rationale and strategy for prioritizing engagements with customers or other partners in its value chain?
Question dependencies
- This question only appears if you select “Yes, our customers or other value chain partners” in response to W1.4.
Change from 2019
No change
Rationale
This question will be particularly relevant to companies whose activities may be affected by water issues outside of their supply chain. Such companies will wish to engage with other partners in order to reduce risk and encourage stewardship and innovation, e.g. in their wider value chain.
Connection to other frameworks
CEO Water Mandate
Response: Internal actions
Response options
This is an open text question with a limit of 2,000 characters.
Requested content
General
- This question is asking about how your organization engages with its value chain beyond its suppliers. This can include customers but also other partners in the value chain e.g. certain franchisees who meet the criteria outlined in your answer here.
- If you are participating in collective action initiatives, for instance, details of this could be reported here.
- Use this field to include examples of your methods of engagement, measures for success, and a description of impact.
(W1.4d) Why do you not engage with any stages of your value chain on water-related issues and what are your plans?
Question dependencies
- This question only appears if you select "No, not currently but we intend to within two years" or “No, we do not engage with our value chain on water” in response to W1.4.
Change from 2019
No change
Rationale
Engaging with value chain partners on water matters is essential for companies wishing to understand the current and future risks and opportunities associated with these relationships.
If your company is dependent on water, CDP data users wish to know why you are not engaging in any way and what your plans are to do so in the future.
Response options
Please complete the following table:
|
Primary reason
|
Please explain
|
|
Select from:
- We are planning to do so within the next two years
- Judged to be unimportant
- No instruction from management
- Important but not an immediate business priority
- Lack of internal resources
- Other, please specify
|
Text field [maximum 1,500 characters]
|
Requested content
Primary reason (column 1)
- Select the primary reason why you do not engage with partners in any stages of your value chain on water-related issues, including ater use, risk, or management, or indicate your plans.
- If you select “Other, please specify”, provide a label for your primary reason.
Please explain (column 2)
- Use the text field to provide further details, specific to your organization, which explain why you do not engage with your value chain.
- If you have plans to engage with your value chain in the future, you should detail them here. If you have no plans, please provide your reasoning.
W2 Business impacts
Module Overview
This module asks about water-related impacts on your organization and your response to them. These are impacts that have occurred in the reporting year, including those resulting from regulatory violations (Module 4 asks about potential impacts, i.e. risks).
Demonstrating that your organization understands how water related issues have impacted it in the past helps provide insight into the water risks you may be exposed to, the risk assessment process needed, and which stakeholders and contextual issues should be included. The financial related information that is requested may help companies with their climate-related disclosures in line with the TCFD recommendations.
Note: For CDP disclosure, the effects of water challenges on a business are referred to as ‘impacts’. The CEO Water Mandate’s Corporate Water Disclosure Guidelines and the GRI generally use the term ‘impacts’ to mean the effects of the business on ecosystems and communities.
Key changes
- Changes have been made to to response options in this module. If you disclosed to CDP in the previous reporting year, please review your auto-populated responses carefully. It is your responsibility to ensure the accuracy and completeness of your current disclosure.
- Click here for a list of all changes made this year.
Sector-specific content
- Sector specific additions to drop downs in W2.1a: Metals & Mining, Food, Beverage & Tobacco, Chemicals.
Pathway diagram - questions
This diagram shows the questions contained in module W2. To access question-level guidance, use the menu on the left to navigate to the question.
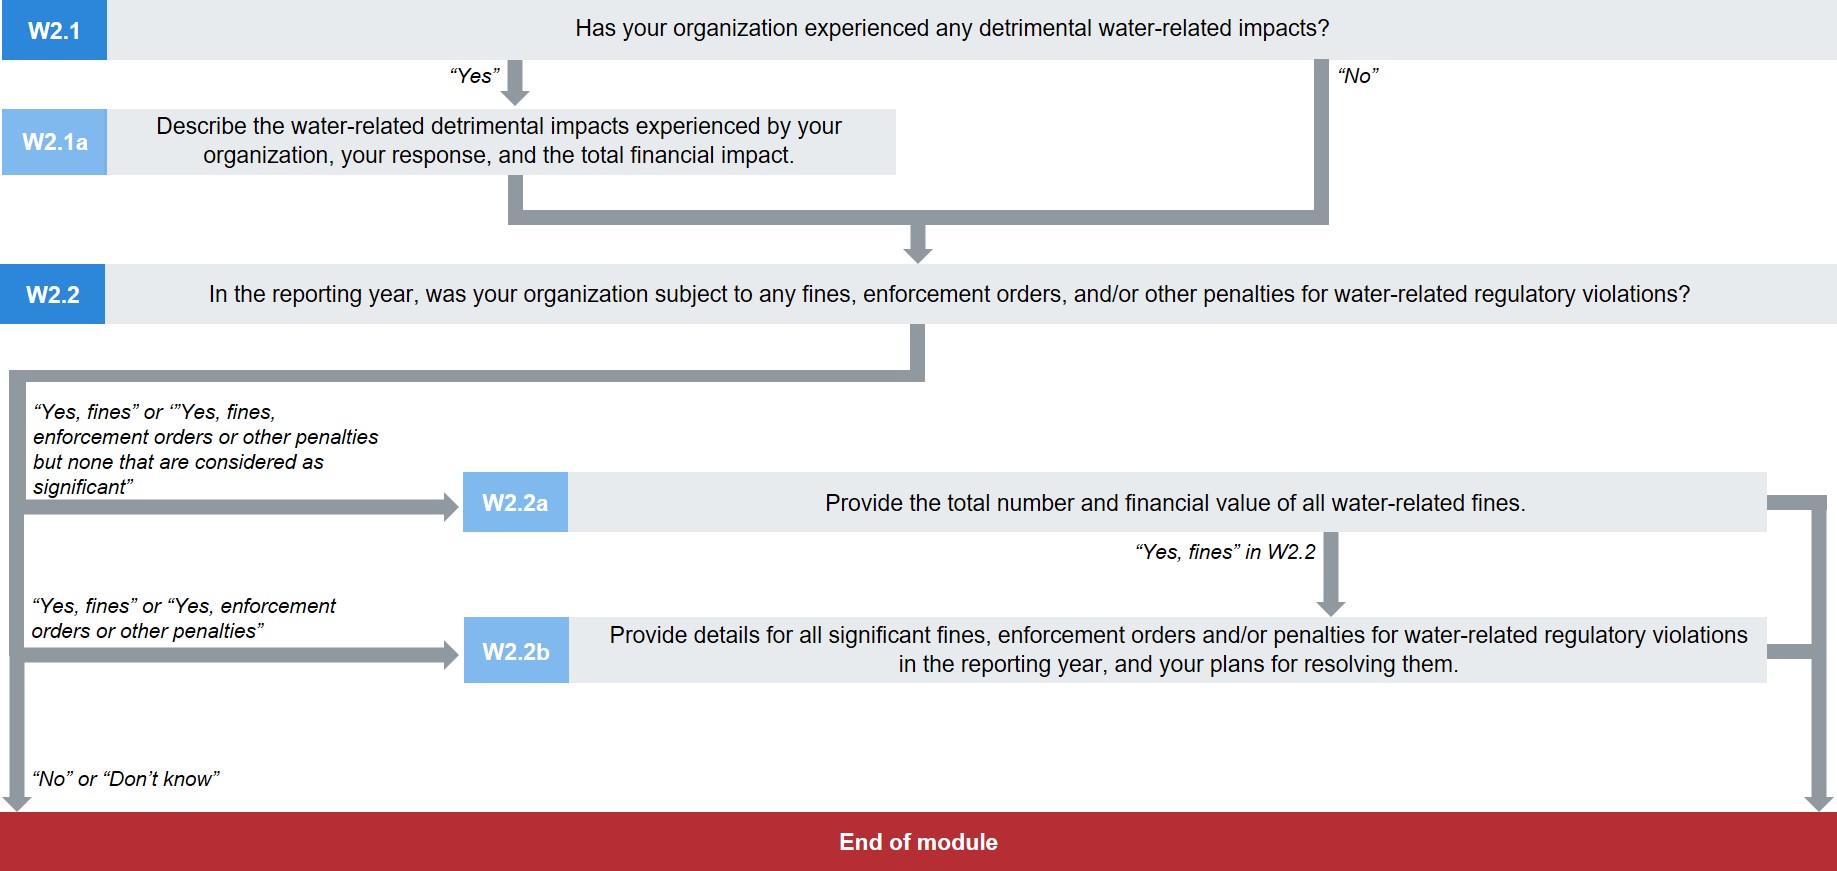
Pathway diagram - questions for minimum version questionnaire
This diagram shows the questions contained in module W2 that are included in the minimum version of the questionnaire. To access question-level guidance, use the menu on the left to navigate to the question.
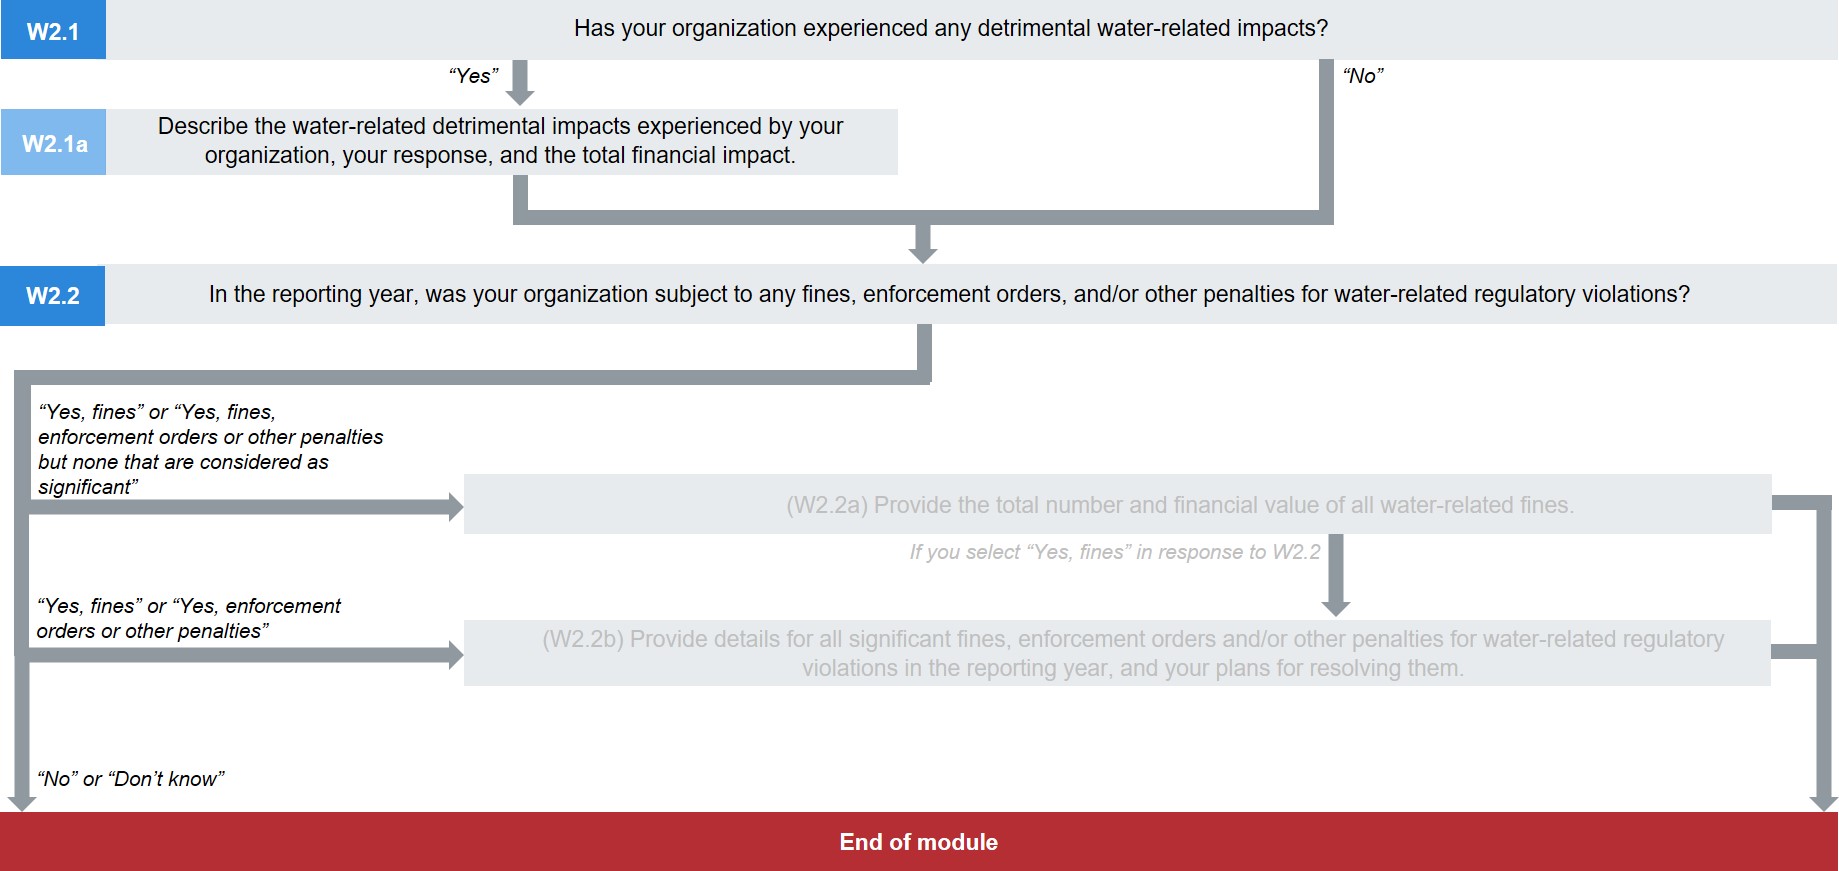
Recent impacts on your business
(W2.1) Has your organization experienced any detrimental water-related impacts?
Change from 2019
No change
Rationale
Past impacts are a useful indicator of inherent risks that your organization may be exposed to. Your response to this question lets CDP data users know whether your business was impacted by water-related issues during the reporting period. Follow up questions indicate how you responded and allow you to explain how you are building resilience.
Connection to other frameworks
CEO Water Mandate
Implications: External impacts
Response options
Select one of the following options:
Requested content
General
- Select ‘Yes’ if you have experienced any detrimental impacts in your business operations, revenue or expenditure in the reporting year that were related to water.
- For businesses, detrimental impacts may include direct financial impacts such as on production, revenue, or assets, but may also include any other impacts such as loss of a license, policy engagement, or brand image.
Explanation of terms
- Inherent risk; The risk that exists in the absence of controls, i.e. not taking into account any potential mitigation or management measures that could be implemented.
- Water-related impact: The effects on an organisation of a physical, regulatory, reputational or technological challenge, event or action related directly or indirectly to water. Note that the CEO Water Mandate’s Corporate Water Disclosure Guidelines, and the GRI standards, generally refer to “impacts” as the effects of the business on ecosystems and communities.
(W2.1a) Describe the water-related detrimental impacts experienced by your organization, your response, and the total financial impact.
Question dependencies
- This question only appears if you select “Yes” in response to W2.1.
Change from 2019
Minor change
Rationale
Past impacts are a useful indicator of inherent risks that your company may be exposed to. Your response strategy to past impacts informs CDP data users how you are attempting to prevent future impacts and build resilience. ‘Total financial impact’ is an important indicator of how your organization quantifies the importance of that water issue.
Connection to other frameworks
CEO Water Mandate
Implications: External impacts
Response options
Please complete the following table. The table is displayed over several rows for readability. You are able to add rows by using the “Add Row” button at the bottom of the table.
|
Country/Area
|
River basin
|
Type of impact driver
|
Primary impact driver
|
Primary impact
|
|
Select from:
- Country/area drop-down list
|
Select from:
- River basin drop-down list
- Not known
- Other, please specify
|
Select from:
- Physical
- Regulatory
- Reputation & markets
- Technology
|
Select from:
- Response drop-down options below table
|
Select from:
- Response drop-down options below table
|
Description of impact
| Primary response
| Total financial impact
| Description of response
|
|---|
Text field [maximum 1,500 characters]
| Select from:
- Response drop-down options below table
| Numerical field [enter a number from 0-999,999,999,999,999 using a
maximum of 2 decimal places]
| Text field [maximum 1,500 characters]
|
[Add Row]
Primary impact driver (column 4)
Physical
- Declining water quality
- Dependency on water intensive energy sources
- Drought
- Ecosystem vulnerability
- Flooding
- Inadequate infrastructure
- Increased levels of plastic in fresh water bodies
- Increased water scarcity
- Increased water stress
- Pollution incident
- Poorly managed sanitation
- Rationing of municipal water supply
- Supplier dependency on water intensive energy sources
- Seasonal supply variability/inter annual variability
- Severe weather events
- Change in land-use
- Soil degradation (food, beverage & tobacco sector only)
- Pollution of water bodies due to fertilizer, other chemical use or animal residues (food, beverage & tobacco sector only)
- Acid rock drainage and metal leaching (metals & mining sector only)
- Leaching of pollutants to groundwater bodies (metals & mining sector only)
- Rupture of tailings dams and toxic spills (metals & mining sector only)
- Other, please specify
Regulatory
- Changed product standards
- Higher water prices
- Increased difficulty in obtaining withdrawals/operations permit
- Lack of transparency of water rights
- Limited or no river basin/catchment management
- Mandatory water efficiency, conservation, recycling or process standards
- Poor coordination between regulatory bodies
- Poor enforcement of water regulation
- Increased difficulty in supplier obtaining withdrawals/operations permit
- Litigation against supplier
- Tighter regulatory standards
- Regulation of discharge quality/volumes
- Regulatory uncertainty
- Statutory water withdrawal limits/changes to water allocation
- Other, please specify
|
Reputation & markets
- Changes in consumer behavior
- Community opposition
- Inadequate access to water, sanitation, and hygiene services
- Increased stakeholder concern or negative stakeholder feedback
- Water-related litigation
- Negative media coverage
- Other, please specify
Technology
- Data access/availability
- Substitution of existing products with lower water impact options
- Transition to water efficient and low water intensity technologies and products
- Transition to water intensive, low carbon energy sources
- Unsuccessful investment in new technologies
- Transition to bio-based chemicals (chemicals sector only)
- Other, please specify
|
Primary impact (column 5)
- Brand damage
- Changing revenue mix and sources
- Constraint to growth
- Closure of operations
- Diminished ability to reduce GHG emissions
- Disruption to sales
- Fines, penalties or enforcement orders
- Impact on company assets
- Disruption to workforce management and planning
- Increased insurance premiums
- Increased cost of capital
- Increased compliance costs
|
- Increased operating costs
- Increased production costs
- Litigation
- Loss of license to operate
- Reduction or disruption in production capacity
- Reduced demand for products and services
- Reduction in capital availability
- Reduced revenues from lower sales/output
- Upfront costs to adopt/deploy new practices and processes
- Supply chain disruption
- Mine closure (metals & mining sector only)
- Other, please specify
|
Primary response (column 7)
- Adopt water efficiency, water reuse, recycling and conservation practices
- Amend the Business Continuity Plan
- Comply with local regulatory requirements
- Develop drought emergency plans
- Develop flood emergency plans
- Develop new products and/or markets
- Engage with customers
- Engage with local communities
- Engage with NGOs/special interest groups
- Engage with regulators/policymakers
- Engage with suppliers
- Establish site-specific targets
- Greater due diligence
- Implement internal pricing on water
- Implement nature-based solutions
- Improve alignment of our public policy influencing activity with our water stewardship commitments
- Improve maintenance of infrastructure
- Improve monitoring
- Improve pollution abatement and control measures
- Increase capital expenditure
- Increase geographic diversity of facilities
- Increase insurance coverage
- Increase investment in new technology
- Increase supplier diversification
- Introduce/strengthen water management incentives
- Purchase water quality credits
- Re-site facilities
- Secure alternative water supply
- Support river basin restoration
- Tighten supplier performance standards
- Use risk transfer instruments
- Utilize aquifer storage to accrue recharge credits
|
- Adopt alternative crop management strategies to reduce fertilizer and pesticide use (food, beverage & tobacco sector only)
- Adopt alternative livestock management practices (food, beverage & tobacco sector only)
- Adopt alternative livestock management practices to reduce use of veterinary products (food, beverage & tobacco sector only)
- Adopt better animal waste management practices (food, beverage & tobacco sector only)
- Adopt efficient fertilizer and pesticides management (food, beverage & tobacco sector only)
- Adopt soil conservation practices (food, beverage & tobacco sector only)
- Adopt sustainable irrigation practices (food, beverage & tobacco sector only)
- Promote the adoption of alternative crop management strategies to reduce fertilizer and pesticide use among suppliers (food, beverage & tobacco sector only)
- Promote the adoption of alternative livestock management practices among suppliers (food, beverage & tobacco sector only)
- Promote the adoption of alternative livestock management practices to reduce use of veterinary products among suppliers (food, beverage & tobacco sector only)
- Promote the adoption of better animal waste management practices among suppliers (food, beverage & tobacco sector only)
- Promote the adoption of efficient fertilizer and pesticide management among suppliers (food, beverage & tobacco sector only)
- Promote the adoption of soil conservation practices among suppliers (food, beverage & tobacco sector only)
- Promote the adoption of sustainable irrigation practices among suppliers (food, beverage & tobacco sector only)
- Promote the use of drought resistant crop varieties among suppliers (food, beverage & tobacco sector only)
- Reduce food waste throughout the value chain (food, beverage & tobacco sector only)
- Use drought resistant crop varieties (food, beverage & tobacco sector only)
- Other, please specify
|
Requested content
General
- This question requests information on the water-related detrimental impacts that your organization experienced in the reporting year, the driver of the impact, your response and the total financial impact.
- Each row in this table should report a primary impact driver for a primary impact, and your organization’s primary response.
- For a particular river basin, if you wish to report more than one impact driver or impact, use the “Add Row” function and enter this information. Please refrain from providing more than three impact drivers per river basin. Report the drivers causing the most substantive impacts.
Country/Area (column 1)
- From the drop-down menu provided, please select the country/area associated with the impact driver for the impact you are reporting.
- Note that a selection must be made for both column 1 and column 2. Your data will not be saved if either column is left blank.
River basin (column 2)
- From the drop-down options provided, select the river basin associated with the impact driver. If you do not see the basin required, select “Other, please specify” and write in the correct river basin using the text box provided.
- For companies withdrawing water from large confined aquifers that may not discharge to the river basin they are located in e.g. Ogallala aquifer in the United States, please select “Other, please specify” and type in the name of the local aquifer source. Ensure that the correct country/area name is selected in column 1 (Country/Area).
- You may want to put the sub-basin of a bigger river basin identified in the drop-down menu. In this case use the “Other, please specify” option in the following format: “Putumayo, Amazon”.
- If you select “Other, please specify”, provide a label for the river basin.
- For full instructions see the Introduction to CDP's water security reporting guidance.
- Note that a selection must be made for both column 1 and column 2. Your data will not be saved if either column is left blank.
Type of impact driver (column 3)
- Consider whether the impact you wish to report was primarily related to, triggered by or caused by, a physical water issue/event, regulatory issues or reputational/market issues.
- This will determine the list of impact drivers that appears in column 4.
- Note that a selection must be made for both column 3 and column 4. Your data will not be saved if either column is left blank.
Primary impact driver (column 4)
- CDP provides a list of impact drivers for responding companies to choose from. They are separated into three main groups: physical, regulatory, and reputational (see ‘Additional Information’).
- The drop-down options presented depend on the type of impact driver you selected in column 3.
- Note that the driver you select should relate the river basin selected in column 2.
- In the case that there may be more than one driver, or a chain of causes, for an impact, you should select what you consider to be the primary driver.
- If you do want to choose an additional driver for a river basin, you will need to add another row to report the details.
- If you select “Other, please specify”, provide a label for the primary impact driver.
- Note that a selection must be made for both column 3 and column 4. Your data will not be saved if either column is left blank.
Primary Impact (column 5)
- Select the primary water-related impact your organization felt in the reporting year due to the driver in column 4.
- Impacts can be operational or financial and can affect your organization, your consumers or other stakeholders.
- If none of the available options are suitable to your organization, please select “Other, please specify” and a text box will be available for you to complete.
- If you have identified multiple/secondary impacts, select the primary impact here and describe the secondary impacts in column 8.
- If you select “Other, please specify”, provide a label for the primary impact.
Description of impact (column 6)
- Explain the ways in which the impact was detrimental to your organization. For example, did it require additional spending to maintain normal output? Was output reduced?
- Include details as to the length of time your business was impacted or if it persists (e.g. severe drought was experienced for five months of the reporting year. Some processes were unable to operate.)
- If you are able to provide quantitative data relevant to the detrimental impact (e.g. proportion of sales lost) please do so.
Primary response (column 7)
- From the drop-down list, select the primary response strategy that most closely describes how your organization has responded to the impact driver in column 4.
- If your organization implemented/will implement more than one response strategy, you may provide details in column 8.
- If an appropriate response strategy is not listed, please select “Other, please specify” and a text box will be provided so that you can write in your own response.
Total financial impact (column 8)
- Enter a figure for total financial impact. This is the total cost to the business - so a sum of the financial implications of the impact itself plus the actual or anticipated cost of the response to deal with it.
- This figure should be in the same currency that you selected for all financial information disclosed throughout your response in question W0.4.
- If you do not know the financial impact, you may provide an estimate. Remember that a zero should not be used for an absence of data.
Description of response (column 9)
- Provide additional details of your organization’s response strategy. You may include any secondary response strategies.
- Include the timeframe expected for the response strategy to be implemented. Is the response underway, not yet implemented, or completed?
- Describe what difference the response has made/is likely to make, including:
- How effective the response has been/is expected to be in preventing the inherent impact driver reoccurring.
- How effective the response has been/is expected to be improving your organization’s resilience, so preventing future financial or operational impacts.
- Whether water security for your company is likely to improve as a result, at either the asset or corporate level.
- Whether water security for other users is likely to improve as a result.
- Whether the response contributes to the progress of other UN Sustainable Development Goals.
- Whether the response strategy involves any collective action initiatives.
- For companies indicating that they would be interested in having their public response data transferred to the Water Action Hub (see W11.2), we ask that you provide as much information about your response as possible, particularly local projects, including:
- Who else is involved in the joint project /initiative (such as names of organizations or government offices) or who you would like to work with (government agencies, other companies, NGOs, etc.)
- The geographic or other scale of the project.
- What the project seeks to accomplish including expected benefits for the watershed beyond the company.
-When the project started and if it has concluded or if it is continuing.
-If possible, the specific location of the project.
- Note that these criteria are not scored but are crucial to building a project for the Water Action Hub and without this detail the project may not be suitable to transfer to this platform.
- Provide details on the total financial impact your organization has suffered as a result of the impact and your response, including:
- Methods for calculating your answer to column 7 (including any assumptions the figure is dependent on).
- Whether this is a recurring or a fixed cost.
- What timescale this cost is likely to be.
- If you do not know the financial impact and you left column 7 blank, write “Impact not quantified financially” and give an explanation.
Explanation of terms
- Impact driver: The factor/ driving force causing the impact being reported. Impact drivers are typically physical (e.g. weather extreme events), regulatory, reputational and markets related, or technological.
Explanation of terms for chemical sector
- Bio-based chemicals (Chemical sector only): Bio-based products are wholly or partly derived from materials of biological origin, excluding materials embedded in geological formations and/or fossilized.
Explanation of terms for food, beverage & tobacco sector
- Alternative crop management strategies to reduce fertilizer and pesticide use (Food, beverage & tobacco sector only): Practices that aim to reduce the need for fertilizer or pesticide applications or that lead to greater efficiency in their application i.e. crop rotations, cover cropping, intercropping, etc.
- Alternative livestock management practices (Food, beverage & tobacco sector only): Livestock management refers to practices that aim to reduce water use and pollution from waste generated in animal husbandry operations e. g by reducing the amount of water needed, evaporation and amount of waste that needs cleaning, feed adequate fibre, reduce the time cattle spend on the yard.
- Animal waste (Food, beverage & tobacco sector only): Manure, slurries or other animal by-products derived from animal husbandry operations to be eliminated or discarded as no longer useful or required.
- Better animal waste management practices (Food, beverage & tobacco sector only): Practices that aim to minimize pollution and nutrient losses through leaching or runoff from animal manure, slurries and other by-products. This can be the result of practices that reduce the generation of waste, increase its re-use and recycling on and off-farm or the recovery of useful components.
- Efficient fertilizer and pesticides management (Food, beverage & tobacco sector only): Implementation of practices that aim at optimizing the application and minimizing the losses to environment of fertilizer and pesticies or their residues.
- Soil conservation practices (Food, beverage & tobacco sector only): Practices that deter the soil degradation in quantitiy or quality, decreasing erosion or nutrient depletion of the soils, i.e. reduced tillage, use of mulching or cover crops.
- Soil degradation (Food, beverage & tobacco sector only): Degradation of the topsoil quality related to soil loss from erosion processes of degradation from the nutrient loss or salinization.
- Sustainable irrigation practices (Food, beverage & tobacco sector only): Practices that optimize irrigation water use leading to a decrease in the total amount of water used in irrigation i.e. through more efficient application of water at the field or irrigation system levels.
Compliance impacts
(W2.2) In the reporting year, was your organization subject to any fines, enforcement orders, and/or other penalties for water-related regulatory violations?
Question dependencies
- Your response to W2.2 will determine which subsequent questions are presented in this section. If your response to W2.2 is amended, data in those dependent questions may be erased. In this case, be sure to re-enter data for all relevant questions. The guidance for each question indicates if it is a dependent question.
Change from 2019
No change
Rationale
Knowledge of compliance related fines and other non-financial penalties across your organization demonstrates an awareness by your organization of its impact on the local operating environment as well as the potential financial implications of its water management.
This information helps investors and other data users to gain some insight into the effectiveness of your control procedures at a corporate level.
Connection to other frameworks
CEO Water Mandate
Current state: Compliance
Response options
Select all that apply from the following options:
- Yes, fines
- Yes, enforcement orders or other penalties
- Yes, fines, enforcement orders or other penalties but none that are considered as significant
- No
- Don’t know
Requested content
General
- Note that this question asks about fines, penalties and/or enforcement orders that were issued to your company during the reporting year.
- You should not include information about fines and penalties that were issued to your company in a previous year but became payable in this year.
Explanation of terms
- Enforcement order: A non-financial restriction as punishment for a regulatory violation or other compliance offence. Examples of non-financial enforcement orders include removal of abstraction licenses or discharge consents.
- Fine: A specific type of penalty that requires payment of money as punishment for a regulatory violation or other compliance offence.
- Penalty: A punishment of any kind due to a regulatory violation or other compliance offence.
(W2.2a) Provide the total number and financial value of all water-related fines.
Question dependencies
- This question only appears if you select “Yes, fines” or “Yes, fines, enforcement orders or other penalties but none that are considered as significant” in response to W2.2.
Change from 2019
No change
Rationale
Providing aggregated information, for absolute numbers and the tracking of numbers of compliance-related fines, is evidence that your organization is monitoring its local operating environments and keeping track at corporate level.
Connection to other frameworks
CEO Water Mandate
Current state: Compliance
Response options
Please complete the following table:
|
Total number of fines
|
Total value of fines
|
% of total facilities/operations associated
|
Number of fines compared to previous reporting year
|
Comment
|
|
Numerical field [enter a number from 0-999,999,999,999]
|
Numerical field [enter a number from 0-999,999,999,999,999 using a
maximum of 2 decimal places]
|
Percentage field [enter
a percentage from 0-100 using a maximum of 2 decimal places]
|
Select from:
- Much lower
- Lower
- About the same
- Higher
- Much higher
- This is our first year of measurement
|
Text field [maximum 1,000 characters]
|
Requested content
Total number of fines (column 1)
- Note that this question asks about fines that were issued to your company during the reporting year.
- You should not include information about fines that were issued to your company in a previous year but became payable in this year.
Total value of fines (column 2)
- This figure should be in the same currency that you selected for all financial information disclosed throughout your response in question W0.4.
% of total facilities/operations associated (column 3)
- Indicate the percentage of your sites that were associated with the compliance-related fines reported in column 1. For example, if 10 facilities are listed in column 1 and you have 100 facilities worldwide, then the response here would be 10 percent.
Number of fines compared to previous year (column 4)
- Select the option most applicable to the change in the number of fines compared to the previous year. CDP does not define the categories in this menu as it is difficult to prescribe a threshold that is meaningful to all organizations. You may use column 5 to explain your selection and the threshold you applied.
- CDP recognizes that a change in the total number of fines does not equate to the change in magnitude of the total financial penalty.
Comment (column 5) (optional)
- You may use this column to provide details to help data users understand your response; such as an explanation for your reported trend or the relationship between the total number of fines and the total value of the fines, e.g., whether one fine accounts for a large part of the total financial penalty.
(W2.2b) Provide details for all significant fines, enforcement orders and/or other penalties for water-related regulatory violations in the reporting year, and your plans for resolving them.
Question Dependencies
- This question only appears if you select “Yes, fines” or “Yes, enforcement orders or other penalties” in response to W2.2.
Change from 2019
Minor change
Rationale
Providing these details of fines and other non-financial penalties, such as location and your plans for resolving them, demonstrates to CDP data users that your organization is keeping track at the corporate level and also that it has an awareness of impacts in their local operating environment.
Connection to other frameworks
CEO Water Mandate
Current state: Compliance
Response options
Please complete the following table. You are able to add rows by using the “Add Row” button at the bottom of the table.
|
Type of penalty
|
Financial impact |
Country/Area |
River basin
|
Type of incident
|
Description of penalty, incident, regulatory violation, significance and resolution
|
|
Select from:
- Fine
- Enforcement order
- Other penalty type, please specify
|
Numerical field [enter
a number from 0-999,999,999,999,999 using a maximum of 2 decimal places]
|
Select from:
- Country/area drop-down list
|
Select from:
- River basin drop-down list
- Not known
- Other, please specify
|
Select from:
- Spillage, leakage, or discharge of potential water pollutant
- Failure to monitor effluent
- Effluent limit exceedances
- Abstraction without a permit or abstraction that exceeded permit
- Other non-compliance with permits, standards, or regulations
- Incorrect administration of permits, standards, or regulations
- Other, please specify
|
Text field [maximum
1,000 characters]
|
[Add Row]
Requested content
General
- CDP does not provide guidance as to what constitutes a “significant” regulatory violation, as this will vary by local context and the nature of the business. However, it will usually imply a major impact on the environment, community and/or business(es).
- Organizations should develop a consistent use of the term throughout their response. If you need further guidance as to what constitutes “significant”, CDP recommends companies consider the general definition of “materiality” provided in the GRI Standards as a starting point. This definition puts the onus on companies to determine a materiality threshold based on internal, industry, and external stakeholder interests.
- Note: this question asks about fines, enforcement orders and/or penalties that your company was issued with during the reporting year. You should not include information about fines and penalties that were issued to your company in a previous but became payable in this year.
Type of penalty (column 1)
- If you select “Other, please specify”, provide a label for the type of penalty.
Financial value of penalty (column 2)
- Your response should include all costs related to the regulatory violation, i.e. financial penalties imposed on your organization, costs related to an enforcement order or any other operational or capital expenditure resulting directly to the violation itself or actions to prevent its reoccurrence, such as having to install new technology to meet the requirements of an enforcement order or employing new staff to monitor for compliance etc.
- This figure should be in the same currency that you selected for all financial information disclosed throughout your response in question W0.4.
Country/Area (column 3)
- Note that this is asking for the location of the incident associated with the penalty selected in column 1.
- If more than one country/area applies, please select a primary country/area and explain this in column 6.
- Note that a selection must be made for both column 3 and column 4. Your data will not be saved if either column is left blank.
River basin (column 4)
- Note that this is asking for the river basin associated with the incident that led to the penalty reported in column 1.
- From the drop-down options provided, select the appropriate river basin. If you do not see the basin required, select “Other, please specify” and write in the correct river basin using the text box provided.
- For companies withdrawing water from large confined aquifers that may not discharge to the river basin they are located in e.g. Ogallala aquifer in the United States, please select “Other, please specify” and type in the name of the local aquifer source. Ensure that the correct country/area name is selected in column 3 (Country/Area).
- You may want to put the sub-basin of a bigger river basin identified in the drop-down menu. In this case use the “Other, please specify” option in the following format: “Putumayo, Amazon”.
- If you select “Other, please specify”, provide a label for the river basin.
- For full instructions see the Introduction to CDP's water security reporting guidance.
- Note that a selection must be made for both column 3 and column 4. Your data will not be saved if either column is left blank.
Type of incident (column 5)
- Select the type of incident that is most applicable to the penalty selected in column 1.
- If you select “Other, please specify”, provide a label for the type of incident.
Description of penalty, incident, regulatory violation, significance, and resolution (column 6)
- Penalty: Your response here could include any details that would help CDP data users understand the fine, enforcement order or other penalty selected in column 1.
- Significance: You may include a description of how and why your organization is classifying the penalty in column 1 as significant for your organization.
- Incident and regulatory violation: For each penalty you list in column 1, you may give details of the incident and regulatory violation that resulted in the penalty, e.g.:
- more details on the incident/violation selected in column 5; e.g. the nature of a breach in an abstraction license or a discharge consent, or the nature of other water and wastewater related regulation violation.
- whether the penalty was for a single incident or multiple incidents, and the frequency with which it/they occurred.
- the impact the incident and the penalty had on your business, other water users and/or the natural environment; whether there were any criminal sanctions.
- Resolution: Please provide a brief description of how your organization has resolved or is planning to resolve the incident, including steps taken to ensure the regulatory violation is not repeated. This may include, for example, internal actions and/or external engagement such as: upgrading facilities, changing treatment methods, decreasing volume of discharge, increasing volumes of reused or recycled water, engaging with policymakers, or engaging with local communities. If your organization has a compliance assurance system in place, you may provide details.
W3 Procedures
Module Overview
This module requests information about the procedures that organizations have in place to manage issues salient to their sector and to understand inherent risk exposure. These management procedures are considered important for water security - independent of a company’s own perception or assessment of any associated net risk for their company. This is why we ask companies to answer these questions before disclosing whether they consider themselves exposed to substantive water-related risk and what those risks are.
Questions in sections W3.1 and W3.2 are targeted at specific sectors only and focus on water pollution issues.
As there is no globally recognized standard for water risk assessment, this module provides evidence as to the robustness, comprehensiveness and integrity of an organization’s risk assessment. Companies are asked to explain what processes and procedures have been implemented at the corporate level and other more local levels due to the importance of matching response strategies to the local context.
This data helps provides data users with confidence that the organization’s disclosure of water risks in module 4 is comprehensive.
Key changes
- Two new questions for metals & mining sector: W-MM3.2a and W-MM3.2b allow organizations to demonstrate their management of hazardous tailings dams.
- Modified guidance (W3.3a): Clarification of when to select "Full" coverage for risk assessment.
- Click here for a list of all changes made this year.
Sector-specific content
- Additional sections for all high impact sectors: W3.1.
- Additional section for Metals & Mining: W3.2.
- Additional drop-down options in W3.3a for Oil & Gas and Electric Utilities.
Pathway diagram - questions
This diagram shows the questions contained in module W3. To access question-level guidance, use the menu on the left to navigate to the question.
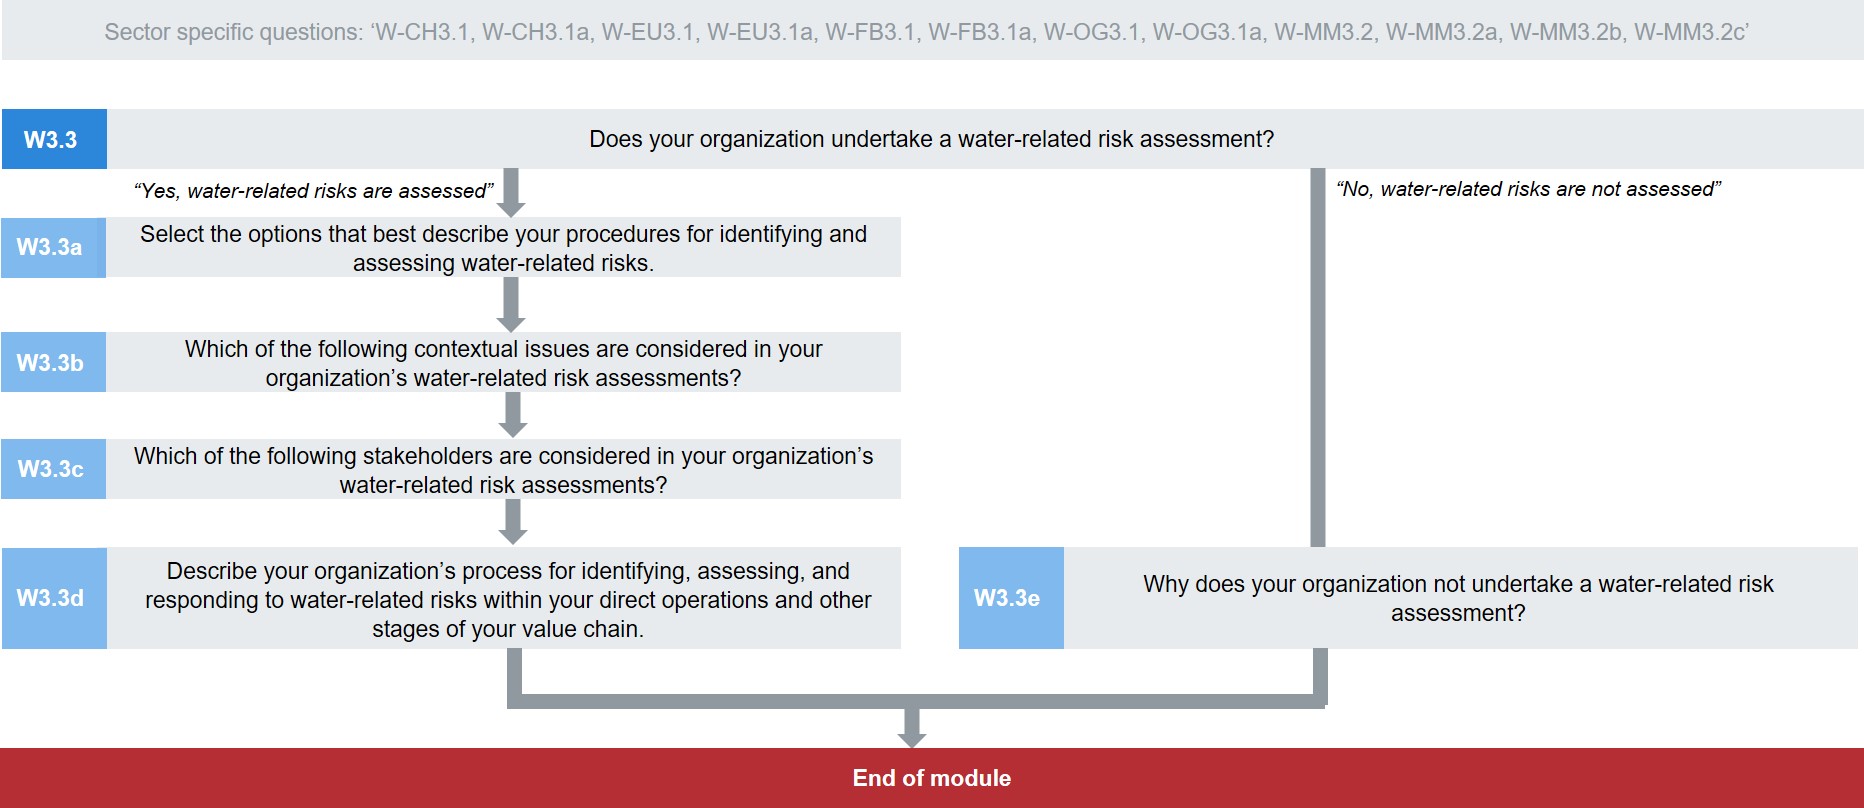
Pathway diagram - questions for minimum version questionnaire
This diagram shows the questions contained in module W3 that are included in the minimum version of the questionnaire. To access question-level guidance, use the menu on the left to navigate to the question.
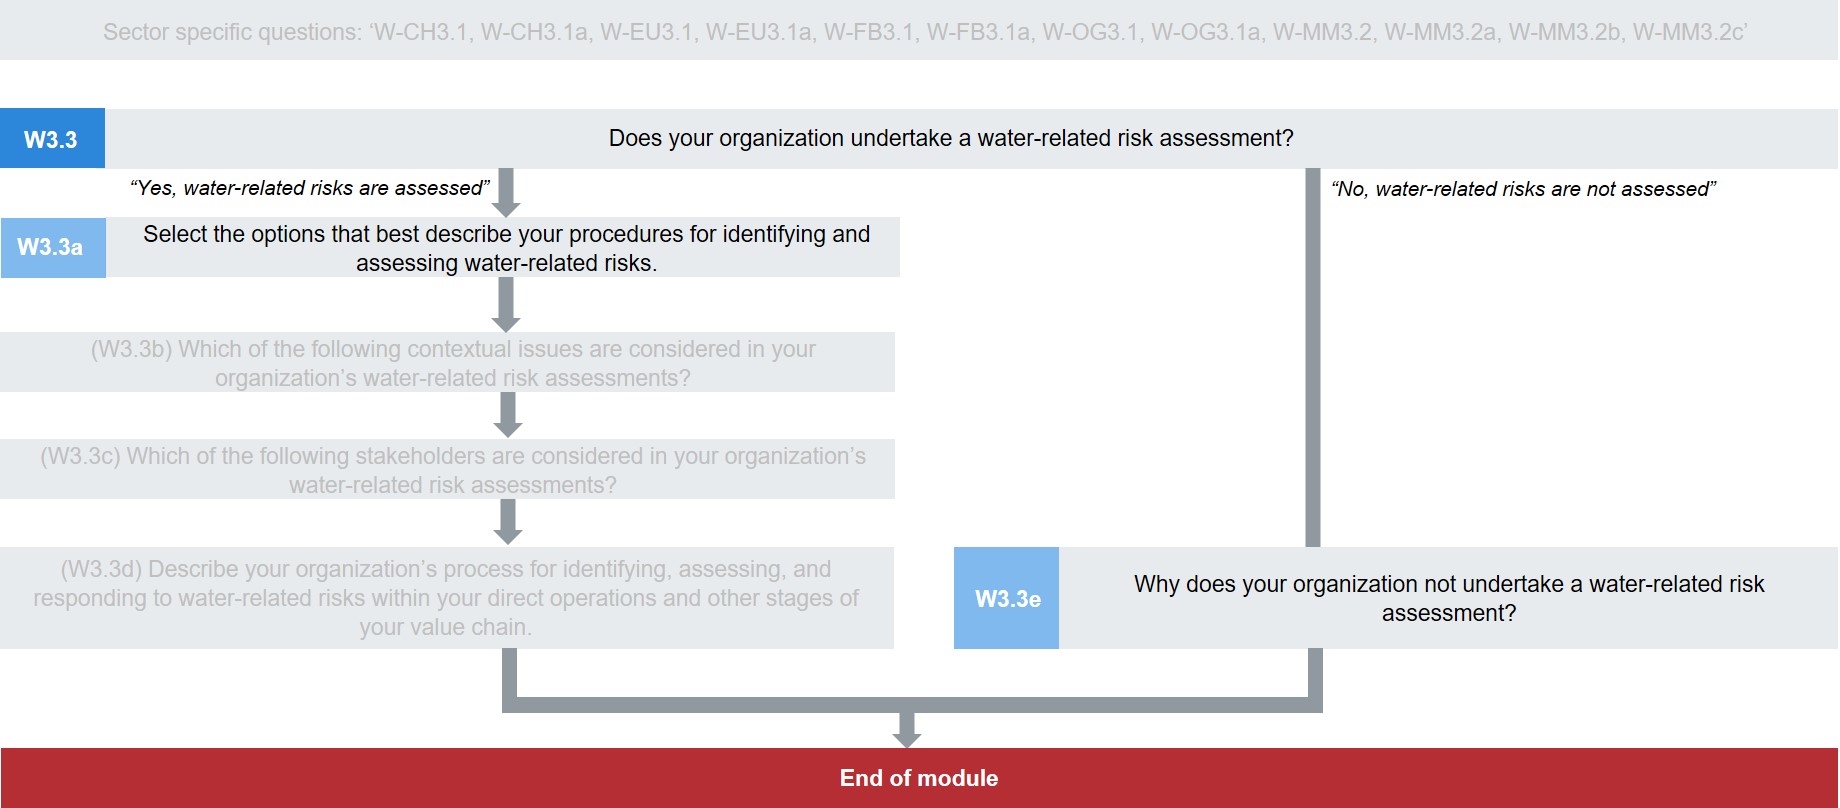
Pollutant management procedures
The questions in this section only apply to organizations with activities in certain sectors. Questions will not appear unless you have opted to view the following sector-specific questions:
- Food, beverage & tobacco
- Chemicals
- Oil & gas
- Electric utilities
(W-CH3.1) How does your organization identify and classify potential water pollutants associated with its activities in the chemical sector that could have a detrimental impact on water ecosystems or human health?
Change from 2019
No change
Rationale
Water pollution is a critical issue for the chemical sector. These questions allow organizations to show that they assess and understand the potential impacts associated with the substances they handle and the properties of their discharges, and take all necessary actions to prevent physical, chemical or biological contamination, not just in their own operations but also throughout their value chain, including the use-phase and final disposal of products.
Hazardous chemicals of concern pose a threat to the quality of surface and groundwater bodies and their dependent ecosystems. It is important that companies define and identify potential water pollutants linked to their business operations and products and effectively manage them.
Note: CDP recognizes that the diversity of the hazardous substances involved throughout the chemical sector’s value chain has meant that there are numerous methods to define potential water pollutants and assess the potential impacts on water quality in the chemical industry. The sector is without a universal standard or definition that can be applied and implemented across it entirely.
Response options
This is an open text question with a limit of 5,000 characters.
Requested content
General
- Provide company-specific details of the policies and processes your organization has in place that aim to identify and classify the potential water pollutants that may have detrimental impacts over water bodies and ecosystems.
- Include your general approach to determining:
- Which chemical substances, physical parameters or biological agents are considered as pollutants;
- How these pollutants are categorized, for example by level of concern; and
- The most relevant metrics and/or indicators used to identify these substances.
- Include information on the most relevant established standard and/or methodology you used for classification and include the rationale behind adopting it. You do not need to provide an exhaustive list of all standards involved.
- Explain what water-related impacts your procedures deal with and clarify how you assess overall impact in terms of chronic and acute toxicity, coverage, persistence, bioaccumulation, etc. You may wish to add an explanation about who you consider to be a potentially impacted party.
- You may also provide information on whether and how the procedures vary across your value chain.
- If you have processes in place for reviewing and updating the metrics or thresholds used, you may include this information.
- If your organization does not yet define potential water pollutants, or is in the process of doing so, include this information here. Provide the timelines of when these procedures will be implemented and the established standard and/or methodology you plan to use for the classification of the potential water pollutants.
Explanation of terms
- Potential water pollutants: Physical (including thermal), biological, or chemical agents (organic, inorganic substances or heavy metals) that have the direct or indirect potential to negatively modify/contaminate water bodies and/or water ecosystems or affect human health.
Example response
Our company manufactures and trades in textile and leather dyes and dyes intermediaries for our national market and import to EU, and we have developed a holistic ESG program that includes water pollution control management system across our operations in the textile dyes sector.
Our operations are certified ISO14001 and ISO14004.
Our pollution prevention plans identify, evaluate and monitor the products we handle and produce in our plants. Our policy is based on the principles of avoidance, reduction and mitigation, including waste minimization principle, and sets specific targets. This policy and plans are supported by the Chief Sustainability Officer and the regional board of directors. Our procedures are developed by the regional directors and the EHS managers and are annually reviewed and approved by the CSO.
We categorize key substances as those that can have severe toxic and ecotoxic effects, have high persistence in the natural environment and have the potential to bioaccumulate. In effluents we pay particular attention to the presence of heavy metals i.e. chromium (total and hexavalent).
We classify our products according to EU REACH regulation and GHS classification. These regulations set the characteristics of the products involved including, for example, toxicity, ecotoxicity and carcinogenicity. They also set the test and criteria to be used in the classification of the products following the OECD recommendations. The products we develop are classified as low acute and chronic toxicity (categories 4 and 5 of the GHS system) and chronic ecotoxicity for micro fauna and algae. None of our products are carcinogen.
Through our participation in sector bodies like the Basic Chemicals, Pharmaceuticals Cosmetics Export Promotion Council (CHEMEXIL) and the member of Gurjarat Dyestuffs Manufacturers Association (GDMA) we are updated on the new regulations or legislation in India and our export markets.
Our discharges to surface waters conform to the norms of the Indian Ministry of Environment set by the Central Pollution Control Board This involves the control of physical and chemical parameters as pH, BOD, COD and TSS.
We strive to follow the recommendations from the programme ‘Zero discharge of hazardous chemicals’ (ZDHC) in 75% of our operations. This sets concentrations limits in effluents, for example, of 0.5 mg/l and 1 mg/l for copper and zinc respectively and 80 mg/l for COD which is regarded as progressive practice. In comparison Indian regulations set maximum values in our effluents of 3 mg/l 5 mg/l and 250 mg/l for Copper, Zinc and COD respectively.
Additionally, since 2015 the procedures in our Gujarati plants evaluate the potential impacts on local communities due to the insufficient treatment of effluents in municipal water treatment plants. These risk assessments evaluate potential health impacts from the use or consumption of these waters. As a result, we have implemented pretreatment plants to eliminate heavy metals and most toxic pollutants like Cr from our wastewaters discharged to municipal treatment plants. By 2020 we will asses and implement such community risk assessment in our Kerala plants, thus covering all our operations.
We are engaging in supply chain initiatives with customers to increase the share of revenue from less-hazardous dyes. We follow the voluntary programme ZDHC which restricts a list of most harmful substances from the textile value chain. As a corporate goal, we are restricting our production of a set of Azo dyes for their potentially toxic effects and ecotoxicological effects over macro- and micro fauna and algae. We aim to fully eliminate them by 2025 but ensure that by 2020 their concentration in formulations is below 150ppm, recommended in the ZDHC initiative. Additionally, we research into improving the properties of our dyes, like the binding rate that allow lower dosages and cleaner effluents in the textile plants of our customers and offer a series of alternative dyes in our portfolio. These initiatives contribute to less damaging wastewater in the following stages of our product’s value chain.
(W-CH3.1a) Describe how your organization minimizes adverse impacts of potential water pollutants on water ecosystems or human health. Report up to ten potential pollutants associated with your activities in the chemical sector.
Change from 2019
No change
Rationale
In the chemical sector, chemical processing produces large quantities of wastewater and large amounts hazardous and toxic substances must be managed. If not managed correctly, this can pose a significant threat to water bodies and/or water ecosystems. Innovative water risk management strategies are critical to reducing water usage and contamination, safeguarding the quality of water resources for all users.
In addition, some products may also lead to severe pollution issues in their use-phase or as a consequence of inappropriate disposal. Residues or metabolites may also be a potential issue in some chemical products.
This question provides organizations with the chance to explain their company-specific management procedures put in place to minimize the potential impacts associated with the water pollutants identified. This will demonstrate to data users the organization’s commitment to address these water-related risks.
Response options
Please complete the following table. You are able to add rows by using the “Add Row” button at the bottom of the table.
| Potential water pollutant
|
Value chain stage
|
Description of water pollutant and potential impacts
|
Management procedures
|
Please explain
|
|
Text field [maximum 300 characters]
|
Select all that apply:
- Direct operations
- Supply chain
- Distribution network
- Product use
- Other, please specify
|
Text field [maximum of 2,500 characters]
|
Select all that apply:
- Compliance with effluent quality standards
- Measures to prevent spillage, leaching, and leakages
- Providing best practices instructions on product use
- Providing best practice guidance to suppliers
- Auditing supplier compliance to industry standards
- R&D into less harmful alternative products
- Management procedure under development
- No formal management procedure in
place
- Other, please specify
|
Text field [maximum of 2,500 characters]
|
[Add Row]
Requested content
General
- This question asks you to demonstrate your awareness of the potential pollutants relevant to the different stages of the value-chain, the impact they may have, and your strategy activities to manage them.
- Only include substances of greatest concern according to your approach described in W-CH3.1.
- You may report up to 10 potential water pollutants.
Potential water pollutant (column 1)
- Select the type of water pollutants identified as relevant to your organization according to your approach described in W-CH3.1.
- If several substances share similar characteristics, potential impacts and management procedures, you may report them together.
- If your organization does not yet define potential water pollutants or is in the process of doing so, respond “none” and explain this in column 5 (Please explain).
Value chain stage (column 2)
- If a value chain stage is not available within the drop-down list, please select “Other, please specify” to identify your value chain stage and provide a label for the value chain stage.
- If your response to column1 is a group of pollutants, please indicate here which stage of your value chain applies to each one.
- If your organization does not yet define potential water pollutants or is in the process of doing so, select the option “Other, please specify”, provide the label “no defined potential water pollutants” and explain this in column 5 (Please explain).
Description of water pollutant and potential impact (column 3)
- Use this column to provide details of how the pollutants selected in column 1 are linked to potential impacts on water bodies, ecosystems and/or human health.
- Specify within your description which chemicals (e.g. chlorine, sulfides, phenols etc.) or physical parameters (e.g. temperature, turbidity, etc.) have the potential to pollute water resources. Relate the potential impacts with the organization’s activities involved.
- Provide details of the potential impact, including pathways for the pollutants to reach ground- or surface water bodies i.e. improper storage and disposal of solid waste, an accidental spill during the manufacturing processes, distribution network or lack of or ineffective wastewater treatment.
- You may also comment on the potentially impacted parties identified (e.g. micro- or macrofauna or vegetation, local population) and the type of effects in terms of toxicity, coverage, persistence, bioaccumulation, etc.
- If your organization does not yet define potential water pollutants, or is in the process of doing so, respond “No defined potential water pollutants” and clarify further in column 5 (Please explain).
Management procedures (column 4)
- Select the most relevant procedures your business has in place to effectively manage the potential impacts identified.
- These procedures may be company-wide responses or those at the local, river-basin level. This can be specified in the column 5 (Please explain).
- If you select “Other, please specify”, please provide a label for the management procedure .in the text field provided.
Please explain (column 5)
- Use this field to provide further company-specific details of the procedure selected and how these procedures manage the risks of the potential impacts detailed.
- Include your rationale for the adoption of these procedures and how these manage the risks associated with the impact.
- Provide information on how the success of the procedure is evaluated. If the procedures are periodically reviewed, provide details of the periodicity and implementation of any change resulting from the review.
- You may add details on the scope of the procedure, for example whether the procedures are company-wide and applicable to all business operations or are specific to a set of facilities/river basins/stages of the value chain.
- You may include the most relevant management procedure official standards that you adhere to, and at what scope these are implemented, e.g. regional, company-wide, or river basins.
- If you selected the option "Other, please specify" in column 4 provide the rationale and objectives of the management procedures indicated.
- If your response to column1 is a group of pollutants, please indicate here if a management procedure applies to any particular pollutant.
- For those companies that do not yet have management procedures in place, or are in the process of doing so, please provide the timelines of when these will be implemented and how they are going to be used to minimize the impacts on substances of concern on water bodies.
- If you do not yet have a process in place to evaluate potential water pollutants or are in the process of doing so, explain it in this column.
Explanation of terms
- Potential water pollutants: Physical (including thermal), biological, or chemical agents (organic, inorganic substances or heavy metals) that have the direct or indirect potential to negatively modify/contaminate water bodies and/or water ecosystems or affect human health.
Example response
| Potential water pollutant
|
Value chain stage
|
Description of water pollutant and potential impacts
|
Management procedures
|
Please explain
|
Cr chromium
|
- Direct operations
- Product use
|
Chromium and in particular Cr VI has important toxic effects, acute and chronic if ingested and can cause severe irritation in contact with the skin. It is associated with our production of Cr-based dyes like Triphenylmethane and anthraquinoid. It can reach rivers and lakes through improper treatment of our effluents or incidents. It can also impact shallow aquifers that feed from those rivers and are used for local population water supply. Impacts can be higher in the pre-monsoon season when river and aquifer levels are lower and the concentration of pollutants is higher. Cr VI can be found in dilution or precipitated in the sediments and biota.
|
- Compliance with effluent quality standards
- Providing best practices instructions on product use
- Providing best practice guidance to suppliers
- R&D into less harmful alternative products
|
Our compliance with effluent quality standard and the strong operational procedures in effluent treatment plants minimize the risk of this chemical reaching population downstream in doses that can be harmful. We treat our effluents though subsequent chemical and physical treatment to reduce Chromium concentrations below the limit of 0.1 mg/lin 95% of our effluents.
We assign 20% of our R&D budget to less polluting alternatives. We work to develop products that maximize dye use efficiency in our customer’s operations by improving their fixation properties and alternative formulations like foam dyes. This allows our clients to adjust formulation doses more carefully.
|
|
Other heavy metals (Cu, Zn)
|
- Direct operations
- Product use
|
Heavy metals in our effluents are related to our production of dyes i.e. zinc sulphide pigments. Zn and Cu can cause skin and gastric acute and chronic effects if ingested.They can reach rivers and lakes through improper treatment of our effluents or incidents. They can also reach shallow aquifers that feed from those rivers and are used for local population water supply. Impacts can be higher in the pre-monsoon season when river and aquifer levels are lower and the concentration of pollutants is higher.
|
- Compliance with effluent quality standards
- Measures to prevent spillage, leaching and leakages
- R&D into less harmful alternative products
|
Our compliance with effluent quality standard and the strong operational procedures in effluent treatment plants minimize the risk of heavy metals reaching population downstream in doses that can be harmful. We treat our effluents though subsequent chemical and physical treatment to reduce Cu and Zn concentrations below the limits of 3 mg/l and 5 mg/l respectively in 95% of our effluents, as per the Indian legislation.
We assign 20% of our R&D budget to less polluting alternatives. We work to develop products that maximize dye use efficiency in our customer’s operations by improving their fixation properties and alternative formulations like foam dyes. This allows our clients to adjust formulation doses more carefully.
|
|
Azo dyes
|
- Direct operations
- Product use
|
Substances in which the azo group is cleavable can lead to acute and chronic toxicity in humans and ecotoxicity effects for fish, microfauna and algae. These pollutant is one of our products, although we have plans to phase them out. Their reaching to surface waters may come from accidental leakage or spilling or from the wastewaters from storage, pipes and tanks.
|
- Measures to prevent spillage, leaching and leakages
- Providing best practices instructions on product use
- R&D into less harmful alternative products
|
Our procedures for handling these substances and our risk management procedures aim at minimizing the possibility of these chemicals reaching surface waters in doses that can be harmful.
We assign 20% of our R&D budget to less polluting alternatives. We work to develop products that maximize dye use efficiency in our customer’s operations by improving their fixation properties and alternative formulations like foam dyes. This allows our clients to adjust formulation doses more carefully.
We engage with our customers to communicate the substitution of the most potentially toxic Azo dyes for other dyes and their correct handling.
|
(W-EU3.1) How does your organization identify and classify potential water pollutants associated with your business activities in the electric utilities sector that could have a detrimental impact on water ecosystems or human health?
Question dependencies
- This question only appears if “Electricity generation” is selected for question W-EU0.1a.
Change from 2019
No change
Rationale
In this sector most of the water demand is used for cooling purposes and returned to the environment with small changes. However, there is the potential for spills, accidents and non-compliance which poses a risk to water resources and their dependent ecosystems. The environmental impacts of thermal pollution are a key concern to the quality of surface water bodies.
The information requested allows organizations to show that they assess and understand the potential impacts associated with the substances they handle and the properties of their discharges, and take all necessary actions to prevent physical, chemical or biological contamination.
Hazardous chemicals of concern and physical properties of the discharges pose a threat to the quality of surface- and groundwater bodies and their dependent ecosystems. It is important that companies define and identify potential water pollutants linked to their business operations and products and are able to effectively manage these.
CDP recognizes that there are numerous ways to define “potential water pollutants” and assess the potential impacts on water quality linked to electric utilities sector activities. The sector does not yet have a universal standard or definition that can be applied and implemented across it entirely.
Response options
This is an open text question with a limit of 5,000 characters.
Requested content
General
- Provide company-specific details of the policies and processes your organization has in place that aim to identify and classify the potential water pollutants that may have detrimental impacts over water bodies and ecosystems.
- Include your general approach to determining:
- Which chemical substances, physical parameters or biological agents are considered as pollutants;
- How these pollutants are categorized, for example by level of concern; and
- The most relevant metrics and/or indicators used to identify these substances.
- Include information on the most relevant established standard and/or methodology you used for classification and include the rationale behind adopting it. You do not need to provide an exhaustive list of all standards involved.
- Explain what water-related impacts your procedures deal with and clarify how you assess overall impact in terms of chronic and acute toxicity, coverage, persistence, bioaccumulation, etc. You may wish to add an explanation about who you consider to be potential impacted party.
- You may also provide information on whether and how the procedures vary across power generation sources.
- If you have processes in place for reviewing and updating the metrics or thresholds used, you may include this information.
- If your organization does not yet define potential water pollutants, or is in the process of doing so, include this information here. Provide the timelines of when these procedures will be implemented and the established standard and/or methodology you plan to use for the classification of the potential water pollutants.
Explanation of terms
- Potential water pollutants: Physical (including thermal), biological, or chemical agents (organic, inorganic substances or heavy metals) that have the direct or indirect potential to negatively modify/contaminate water bodies and/or water ecosystems or affect human health.
(W-EU3.1a) Describe how your organization minimizes the adverse impacts of potential water pollutants associated with your activities in the electric utilities sector on water ecosystems or human health.
Question dependencies
- This question only appears if “Electricity generation” is selected for question W-EU0.1a.
Change from 2019
No change
Rationale
This question provides organizations with the chance to explain their company-specific management procedures put in place to minimize the potential impacts associated with the water pollutants identified. This will demonstrate to data users the organization’s commitment to address these water-related risks.
Response options
Please complete the following table. You are able to add rows by using the “Add Row” button at the bottom of the table.
| Potential water pollutant
|
Description of water pollutant and potential impacts
|
Management procedures
|
Please explain
|
|
Select from:
- Hydrocarbons
- Coal combustion residuals
- Radiation
- Contaminated cooling water
- Thermal pollution
- Other, please specify
- No potential water pollutants identified
|
Text field [maximum 2,500 characters]
|
Select all that apply:
- Compliance with effluent quality standards
- Measures to prevent spillage, leaching, and leakages
- Community/stakeholder engagement
- Emergency preparedness
- Management procedure under development
- No formal management procedure in place
- Other, please specify
|
Text field [maximum 2,500 characters]
|
[Add Row]
Requested content
General
- This question asks you to demonstrate your awareness of the potential pollutants related to your business, the impact they may have, and your activities to manage them.
- Only include substances of greatest concern according to your approach described in W-EU3.1. The potential water pollutants may vary depending upon the generation sources involved.
- You may report up to 10 potential water pollutants.
- If your organization has not yet identified potential water pollutants or is in the process of doing so, you may indicate this in column 1 (Potential water pollutant) and explain in column 4 (Please explain).
Potential water pollutant (column 1)
- For any water pollutant not listed, please use the "Other, please specify" option and provide your defined pollutant type. Note that in column 2 you may further specify the substances.
- If you select the option “No potential water pollutants identified”, columns 2 and 3 will not be presented.
Description of water pollutant and potential impacts (Column 2)
- Use this column to provide details of how the pollutants selected in column 1 are linked to the potential impacts on water bodies, ecosystems and/or human health.
- Specify within your description which products (e.g. fly ash from combustion), chemicals (e.g. chlorine, sulfides, ammonia, phenols etc.), metals (e.g. Arsenic, Selenium, Boron, Cadmium, Mercury, Lead etc.), or physical parameters (e.g. temperature, turbidity, etc.) have the potential to pollute water resources. Relate the potential water pollutants with the power generation sources.
- Provide details of the potential impact including pathways for the pollutants to reach ground- or surface water bodies, potentially impacted parties identified, type of effects in terms of toxicity, coverage, persistence, bioaccumulation, etc.
Management procedures (column 3)
- Select the most appropriate procedures your business has in place to effectively manage the potential impacts identified.
- These procedures may be company-wide responses or those at the local, river-basin level. This can be specified in the column 4 (Please explain).
- If your organization is in the process of have management procedures, you may indicate this here by selecting the option "Other, please specify" and clarify further in column 5 (Please explain).
Please explain (column 4)
- Use this field to provide further company-specific details of the procedure selected and how these procedures manage the risks of the potential impacts detailed.
- Include your rationale for the adoption of these procedures and how these manage the risks associated with the impact.
- Provide information on how the success of the procedure is evaluated. If the procedures are periodically reviewed, provide details of the periodicity and implementation of any change resulting from the review.
- You may add details on the scope of the procedure, for example whether these management procedures re company-wide procedures applicable to all business operations.
- You may include the most relevant management procedure official standards that you adhere to, and whether these are a river-basin, regional or company-wide adherence.
- If you selected the option "Other, please specify" in column 4 provide the rationale and objectives of the management procedures indicated.
- For those companies that do not yet have management procedures in place, or are in the process of doing so, please provide the timelines of when these will be implemented and how they are going to be used to minimize the impacts on substances of concern on water bodies.
- If you do not yet have a process in place to evaluate potential water pollutants or are in the process of doing so, explain it in this column.
Explanation of terms
- Potential water pollutants: Physical (including thermal), biological, or chemical agents (organic, inorganic substances or heavy metals) that have the direct or indirect potential to negatively modify/contaminate water bodies and/or water ecosystems or affect human health.
(W-FB3.1) How does your organization identify and classify potential water pollutants associated with its food, beverage, and tobacco sector activities that could have a detrimental impact on water ecosystems or human health?
Change from 2019
No change
Rationale
Water pollution is a critical issue for the food, beverage and tobacco sector. The information requested allows organizations to show that they assess and understand the potential impacts associated with the substances they handle and the properties of their discharges, and take all necessary actions to prevent physical, chemical or biological contamination in direct operations, as well as throughout their value chain.
Hazardous chemicals of concern pose a threat to the quality of surface and groundwater bodies and their dependent ecosystems. It is important that companies define and identify potential water pollutants linked to their business operations and products and effectively manage them.
Note: CDP recognizes that the diversity of the hazardous substances involved throughout this sector’s value chain has meant that there are numerous methods to define potential water pollutants and assess the potential impacts on water quality. The sector is without a universal standard or definition that can be applied and implemented across it entirely.
Response options
This is an open text question with a limit of 5,000 characters.
Requested content
General
- Provide company-specific details of the policies and processes your organization has in place that aim to identify and classify the potential water pollutants that may have detrimental impacts over water bodies and ecosystems.
- Include your general approach to determining:
- Which chemical substances, physical parameters or biological agents are considered as pollutants;
- How these pollutants are categorized, for example by level of concern; and
- The most relevant metrics and/or indicators used to identify these substances.
- Include information on the most relevant established standard and/or methodology you used for classification and include the rationale behind adopting it. You do not need to provide an exhaustive list of all standards involved.
- Explain what water-related impacts your procedures deal with and clarify how you assess overall impact in terms of chronic and acute toxicity, coverage, persistence, bioaccumulation, etc. You may wish to add an explanation about who you consider to be a potentially impacted party.
- You may also provide information on whether and how the procedures vary across your value chain or across commodities, produced or sourced.
- If you have processes in place for reviewing and updating the metrics or thresholds used, you may include this information.
- If your organization does not yet define potential water pollutants, or is in the process of doing so, include this information here. Provide the timelines of when these procedures will be implemented and the established standard and/or methodology you plan to use for the classification of the potential water pollutants.
Explanation of terms
- Potential water pollutants: Physical (including thermal), biological, or chemical agents (organic, inorganic substances or heavy metals) that have the direct or indirect potential to negatively modify/contaminate water bodies and/or water ecosystems or affect human health.
(W-FB3.1a) Describe how your organization minimizes the adverse impacts of potential water pollutants on water ecosystems or human health associated with your food, beverage, and tobacco sector activities.
Change from 2019
Minor change
Rationale
This question provides organizations with the opportunity to explain their company-specific management procedures put in place to minimize potential impacts associated with the water pollutants identified. This will demonstrate to data users the organization’s commitment to address these water-related risks.
Response options
Please complete the following table. You are able to add rows by using the “Add Row” button at the bottom of the table.
| Potential water pollutant
|
Activity/value chain stage
|
Description of water pollutant and potential impacts
|
Management procedures
|
Please explain
|
|
Select from:
- Wastewater and sludge with high organic or suspended solids content
- Fertilizers
- Pesticides and other agrochemical products
- Manure and slurries
- Other animal by-products
- Antibiotics and other veterinary products
- Food additives
- Chemicals formed during processing, storage and distribution (e.g., acrylamide, aflatoxins)
- Other, please specify
- No potential water pollutants identified
|
Select all that apply:
- Agriculture – direct operations
- Agriculture – supply chain
- Manufacturing – direct operations
- Manufacturing – supply chain
- Distribution – direct operations
- Distribution – supply chain
- Other, please specify
|
Text field [maximum of 2,500 characters]
|
Select all that apply:
- Animal waste management
- Livestock management
- Soil conservation practices
- Crop management practices
- Sustainable irrigation and drainage management
- Fertilizer management
- Pesticide management
- Calculation of fertilizer intensity data
- Substitution of pesticides for less toxic or environmentally hazardous alternatives
- Waste water management
- Adapt processing or cooking methods
- Change raw material inputs
- Product innovation
- Follow regulation standards
- Adapt food containers and packaging
- No formal management procedure in place
- Management procedure under development
- Other, please specify
|
Text field [maximum 2,500 characters]
|
[Add Row]
Requested content
General
- This question asks you to demonstrate your awareness of the potential pollutants related to your business, the impact they may have, and your activities to manage them.
- Only include substances of greatest concern according to your approach described in question W-FB3.1. The potential water pollutants may vary depending on the value chain stage considered.
- You may report up to 10 potential water pollutants.
Potential water pollutant (column 1)
- Select the type of water pollutants identified as relevant according to your approach described in W-FB3.1.
- For any water pollutant not listed, please use the "Other, please specify" option and provide a label for the defined pollutant type in the text field provided. Note that in column 3 you may clarify further the specific substances.
- If you select the option “No potential water pollutants identified”, columns 2, 3 and 4 will be not be presented. You may explain this choice in column 5.
Activity/value chain stage (column 2)
- If a value chain stage relevant to your organization is not listed, please select “Other, please specify” to identify your value chain phase. If you select “Other, please specify”, please provide a label for the activity/value chain stage in the text field provided.
Description of water pollutant and potential impacts (column 3)
- Use this column to provide details of how the pollutants selected in column 1 are linked to potential impacts on water bodies, ecosystems and/or human health.
- Specify within your description which chemicals (e.g. nitrates, dioxins, ammonia, etc.) or physical parameters (e.g. temperature, turbidity, etc.) have the potential to pollute water resources. You may relate the potential impacts with the activities involved at each stage of your products’ value chain.
- Provide details of the potential impact including pathways for the pollutants to reach ground- or surface water bodies i.e. leaching through the soil resulting from inadequate application, accidental spill or improper storage and disposal of wastes, lack of or ineffective wastewater treatment.
- You may also comment on the potentially impacted parties identified (e.g. micro- or macrofauna or vegetation, local population) and the type of effects in terms of toxicity, coverage, persistence, bioaccumulation, etc.
Management procedures (column 4)
- Select the most relevant procedures your business has in place to effectively manage the potential impacts identified.
- These procedures may be company-wide responses or those at the local, river-basin level. This can be specified in column 5 (Please explain).
- If you select “Other, please specify”, please provide a label for the management procedure in the text field provided.
Please explain (column 5)
- Use this field to provide further company-specific details of the procedure selected and how these procedures manage the risks of the potential impacts detailed.
- Include your rationale for the adoption of these procedures and how these manage the risks associated with the impact.
- Provide information on how the success of the procedure is evaluated. If the procedures are periodically reviewed, provide details of the periodicity and implementation of any change resulting from the review.
- You may add details on the scope of the procedure, for example whether the procedures are company-wide and applicable to all business operations or are specific to a set of facilities/river basins/stages of the value chain.
- Please include the most relevant management procedure official standards that you adhere to, and at what scope these are implemented i.e. regional, company-wide or river basins.
- If you selected the option "Other, please specify" in column 3 provide the rationale and objectives of the management procedures indicated.
- For those companies that do not yet have management procedures in place, or are in the process of doing so, please provide the timelines of when these will be implemented and how they are going to be used to minimize the impacts on substances of concern on water bodies.
- If you do not yet have a process in place to evaluate potential water pollutants or are in the process of doing so, explain it in this column.
Explanation of terms
- Potential water pollutants: Physical (including thermal), biological, or chemical agents (organic, inorganic substances or heavy metals) that have the direct or indirect potential to negatively modify/contaminate water bodies and/or water ecosystems or affect human health.
(W-OG3.1) How does your organization identify and classify potential water pollutants associated with its activities in the oil & gas sector that may have a detrimental impact on water ecosystems or human health?
Change from 2019
No change
Rationale
Water pollution is a critical issue for the oil & gas sector, and the information requested allows organizations to show that they assess and understand the potential impacts associated with the substances they handle and the properties of their discharges, and take all necessary actions to prevent physical, chemical or biological contamination.
Hazardous chemicals of concern pose a threat to the quality of surface- and groundwater bodies and their dependent ecosystems. It is important that companies define and identify potential water pollutants linked to their business operations and products and effectively manage them.
CDP recognizes that there are numerous ways to define “potential water pollutants” and assess the potential impacts on water quality linked to oil & gas sector activities. The sector does not yet have a universal standard or definition that can be applied and implemented across it entirely.
Response options
This is an open text question with a limit of 5,000 characters.
Requested content
General
- Provide company-specific details of the policies and processes your organization has in place that aim to identify and classify the potential water pollutants that may have detrimental impacts over water bodies and ecosystems.
- Include your general approach to determining:
- Which chemical substances, physical parameters or biological agents are considered as pollutants;
- How these pollutants are categorized, for example by level of concern; and
- The most relevant metrics and/or indicators used to identify these substances.
- Include information on the most relevant established standard and/or methodology you used for classification and include the rationale behind adopting it. You do not need to provide an exhaustive list of all standards involved.
- Explain what water-related impacts your procedures deal with and clarify how you assess overall impact in terms of chronic and acute toxicity, coverage, persistence, bioaccumulation, etc. You may wish to add an explanation about who you consider to be a potentially impacted party.
- You may also provide information on whether and how the procedures vary across business divisions.
- If you have processes in place for reviewing and updating the metrics or thresholds used, you may include this information.
- If your organization does not yet define potential water pollutants, or is in the process of doing so, include this information here. Provide the timelines of when these procedures will be implemented and the established standard and/or methodology you plan to use for the classification of the potential water pollutants.
Explanation of terms
- Potential water pollutants: Physical (including thermal), biological, or chemical agents (organic, inorganic substances or heavy metals) that have the direct or indirect potential to negatively modify/contaminate water bodies and/or water ecosystems or affect human health.
(W-OG3.1a) For each business division of your organization, describe how your organization minimizes the adverse impacts on water ecosystems or human health of potential water pollutants associated with your oil & gas sector activities.
Change from 2019
Minor change
Rationale
- Oil & gas companies handle large quantities of produced water, process waste water, drilling fluids, and storm water that can contain contaminants from various business activities, such as drilling, stimulation, separation, and dehydration.
- This question provides organizations with the chance to explain their company-specific management procedures put in place to minimize the potential impacts associated with the water pollutants identified. This will demonstrate to data users the organization’s commitment to address these water-related risks.
Response options
Please complete the following table. You are able to add rows by using the “Add Row” button at the bottom of the table.
| Potential water pollutant
|
Business division
|
Description of water pollutant and potential impacts
|
Management procedures
|
Please explain
|
|
Select from:
- Hydrocarbons
- Chemicals
- Drilling fluids
- Cuttings
- Other, please specify
- No potential water pollutants identified
|
Select all that apply:
- Upstream
- Midstream/Downstream
- Chemicals
- Other, please specify
|
Text field [maximum 2,500 characters]
|
Select all that apply:
- Compliance with effluent quality standards
- Measures to prevent spillage, leaching, and leakages
- Community/stakeholder engagement
- Emergency preparedness
- No formal management procedure in place
- Management procedure under
development
- Other, please specify
|
Text field [maximum 2,500 characters]
|
[Add Row]
Requested content
General
- This question asks you to demonstrate your awareness of the potential pollutants related to your business, the impact they may have, and your activities to manage them.
- Only include substances of greatest concern according to your approach described in question W-OG3.1. The potential water pollutants may vary depending upon business divisions involved.
- You may report up to 10 potential water pollutants.
- If your organization has not yet identified potential water pollutants or is in the process of doing so, you may indicate this in column 1 “Potential water pollutant “and explain in column 5 (Please explain).
Potential water pollutant (column 1)
- Select the type of water pollutants identified as relevant according to your approach described in W-OG3.1.
- For any water pollutant not listed, please use the "Other, please specify" option and provide your defined pollutant type. Note that in column 3 you may further specify the substances.
- If you select the option “no potential water pollutants identified”, columns 2, 3, and 4 will not be presented.
Business division (column 2)
- If you select “Other, please specify” provide a label for the business division.in the text field provided.
Description of water pollutant and potential impacts (column 3)
- Use this column to provide details of how the pollutants selected in column 1 are linked to potential impacts on water bodies, ecosystems and/or human health.
- Specify within your description which chemicals (e.g. sulfides, ammonia, phenols, etc.) or physical parameters (e.g. temperature, turbidity, etc.) have the potential to pollute water resources. Relate the potential impacts with the business division activities involved.
- Provide details of the potential impact including pathways for the pollutants to reach ground- or surface water bodies, potentially impacted parties identified, type of effects in terms of toxicity, coverage, persistence, bioaccumulation, etc.
Management procedures (column 4)
- Select the most relevant procedures your business has in place to effectively manage the potential impacts identified.
- If you select “Other, please specify”, please provide a label for the management procedure in the text field provided.
- These procedures may be company-wide responses or those at the local, river-basin level. This can be specified in the column 5 (Please explain).
Please explain (column 5)
- Use this field to provide further company-specific details of the procedure selected and how these procedures manage the risks of the potential impacts detailed.
- Include your rationale for the adoption of these procedures and how these manage the risks associated with the impact.
- Provide information on how the success of the procedure is evaluated. If the procedures are periodically reviewed, provide details of the periodicity and implementation of any change resulting from the review.
- You may add details on the scope of the procedure, for example whether the procedures are company-wide and applicable to all business operations or are specific to a set of facilities/river basins/stages of the value chain.
- You may include the most relevant management procedure official standards that you adhere to, and whether these are a river-basin, regional or company-wide adherence.
- If you selected the option "Other, please specify" in column 4 provide the rationale and objectives of the management procedures indicated.
- For those companies that do not yet have management procedures in place, or are in the process of doing so, please provide the timelines of when these will be implemented and how they are going to be used to minimize the impacts on substances of concern on water bodies.
- If you do not yet have a process in place to evaluate potential water pollutants or are in the process of doing so, explain it in this column.
Explanation of terms
- Potential water pollutants: Physical (including thermal), biological, or chemical agents (organic, inorganic substances or heavy metals) that have the direct or indirect potential to negatively modify/contaminate water bodies and/or water ecosystems or affect human health.
Other management procedures
The questions in this section only apply to organizations with activities in certain sectors. Questions will not appear unless you have opted to view the following sector-specific questions:
(W-MM3.2) By river basin, what number of active and inactive tailings dams are within your control?
Question dependencies
- This question only appears if you select "Mining" in response to W-MM0.1a.
Change from 2019
Minor change
Rationale
Ensuring the best management of tailings dams is a critical water-related issue for this sector. Tailings dams are commonly used in mining operations for storing water. They may be used to satisfy part of the water demand from the operation of the mine and to reduce pressure on freshwater resources.
At the same time, they can pose critical risks to the environment. These include dam failures and toxic spills which may lead to long-lasting impacts to human health and riverine ecosystems downstream. Operational requirements and local factors such as climate or landscape determine the dams’ type and design and subsequently the risk level for this task. Active and inactive tailings dams pose different risks, therefore requiring different management procedures.
These questions will demonstrate to data users that organizations understand these issues, are assessing the risks associated, and are taking action to prevent them.
Disclosure on the locations and state of the tailings dams will allow data users to relate this information to other responses in the CDP questionnaire that include country/region and basin specific information in section, i.e. W2 and W4.
Response options
Please complete the following table. You are able to add rows by using the "Add Row" button at the bottom of the table.
| Country/Area |
River basin
|
Number of tailings dams in operation
|
Number of inactive tailings dams
|
Comment
|
|
Select from:
- Country/area drop-down list
|
Select from:
- River basin drop-down list
- Not known
- Other, please specify
|
Numerical field [enter a number from 0-1,000 using no decimal
places]
|
Numerical field [enter a
number from 0-1,000 using no decimals places]
|
Text field [maximum 1,500 characters]
|
[Add Row]
Requested content
Country/Area (column 1)
- From the drop-down menu provided, please select a country/area for the location of your tailings dams.
- Note that a selection must be made for both column 1 and column 2. Your data will not be saved if either column is left blank.
River basin (column 2)
- From the drop-down options provided, please select a river basin for the location of your tailings dams. If you do not see a basin that applies to your organization, select "Other, please specify" and write in the correct river basin using the text box provided.
- You may want to put the sub-basin of a bigger river basin identified in the drop-down menu. In this case use the “Other, please specify” option in the following format: “Putumayo, Amazon”.
- For full instructions regarding this list see the Introduction to CDP's water security reporting guidance
- Note that a selection must be made for both column 1 and column 2. Your data will not be saved if either column is left blank.
Number of tailings dams in operation (column 3)
- Provide an aggregate figure for the number of active tailings dams you have in the country/area and river basin selected
- If you do have active tailing dams in a particular country/area and basin, but you cannot give a total figure, you may provide an estimation for the number of active dams and explain this in column 5. Do not enter a zero (0).
Number of inactive tailings dams (column 4)
- Provide an aggregate figure for the number of inactive tailings dams you have in the country/area and river basin selected
- If you do have inactive tailing dams in a particular country/area and basin, but you cannot give a total figure, you may provide an estimation for the number of inactive dams and explain this in column 5. Do not enter a zero (0).
Comment (column 5) (optional)
- Provide any further context to help data users understand your basin level disclosure. If you did not include the number of active or inactive tailings dams in the country/area or basin, please explain why this information is not available and if you have plans to collect it.
Explanation of terms
- Inactive tailings dams: Tasks in which the impoundment has become completely filled, or when tailings production has ceased.
- Tailings dams under control: Tasks for which the reporting company has ownership or operational control.
Example response
| Country/Region | River basin | Number of tailings dams in operation | Number of inactive tailings dams | Comment |
|---|
| Canada | Saguenay
(Riviere) | 1 | 2 | This is one of our longest-running operations
and we have started the planning for its closure. Our largest tailings dam,
St.Josephl I, has already been decommissioned and rehabilitation project is
underway with an investment of $21 mn. In the second tailings dam St. Joseph II
the engineering works to decommission have already started. The remaining
tailings storage task, Riviere I, is operational until full project operational
closure. |
| Canada | Athabasca
river basin, Mackenzie | 2 | 1 | Our open-pit, heap leach operations in the Crewe
area, Saskatchewan, reached its planned capacity in 2017. The operations are
expected to continue until 2025. Further exploration work aims at increasing
the resource and reserve base. |
| United States of America | Colorado | 1 | 0 | The Torrico valley project started exploration
development operations in 2015 to exploit the San Florian-Willies deposit. We
expect a capacity of 8,000 tonnes per day underground operation by 2020. After
initial operations of 6 years, the facility will develop additional tailings
storage tasks. |
| Peru | Majes | 3 | 1 | In the Majes river basin we have two operations,
in San David municipality and Cerro San Javier respectively. The latter was
acquired in 2010 after integration of the subsidiary “Oros del Peru S.A.”. The
integration involved an investment of $33 mn in renewed infrastructure and
capacitation in order for the operation to meet our EHS procedures. |
| Chile | Loa | 2 | 0 | In 2012 we started an evaluation process to
expand and improve the main existing tailings dam facility in the Cerro Chico
area with an investment of $28 mn. This allowed us to expand our copper-gold
operations. |
(W-MM3.2a) Do you evaluate and classify the tailings dams under your control according to the consequences of their failure to human health and ecosystems?
Question dependencies
- This question only appears if you report that you have any active or inactive tailings dams in W-MM3.2.
Change from 2019
New question
Rationale
Evaluating potential losses or damages to human health and ecosystems, irrespective of the perceived probability of failure, provides evidence to investors and other data users that an organization has an awareness of the severe risks as well as potential liabilities associated with poor management of tailings dams. It also helps data users interpret the disclosed information on management procedures for these tasks (dams).
If your organization responded to the Investor Mining and Tailings Safety Initiative 2019 disclosure request, you may find it useful to draw on that submission when completing these questions.
Response options
Please complete the following table:
| Evaluation of the consequences of tailings dam failure
|
Evaluation/Classification guideline(s)
|
Tailings dams have been classified as 'hazardous' or 'highly hazardous'
|
Please explain
|
Select from:
- Yes, we evaluate the consequences of tailings dam failure
- No, we do not currently evaluate the consequences of tailings dam failure but we plan to do so within the next two years
- No, we do not evaluate the consequences of tailings dam failure and have no plans to do so within the next two years
|
Select all that apply:
- Australian National Committee on Large Dams (ANCOLD)
- Canadian Dam Association (CDA)
- Ordinance 70.389/17 - Mining National Agency, Brazil
- Ghana Minerals Commission (LI 2182)
- South Africa SANS 10286
- Company-specific guidelines
- Other, please specify
|
Select from:
- Yes, tailings dams have been classified as 'hazardous' or 'highly hazardous' (or equivalent)
- None of our tailings dams have been classified as 'hazardous' or 'highly hazardous' (or equivalent)
- Don't know
|
Text field [maximum 1,500 characters]
|
Requested content
General
- There are a variety of guidelines for the evaluation of consequences of dams' failure. CDP does not prescribe any specific method.
Evaluation of the consequences of tailings dam failure (column 1)
- If you evaluate only a proportion of your facilities, select "Yes" and use the last column to provide additional information on the coverage.
Evaluation/Classification guideline(s) (column 2)
- These may be recommendations or regulations from industry bodies or public agencies, or your organization's own framework.
- If you use a company-specific framework you may indicate this here and provide further information on how you evaluate the potential consequences to human health and the environment in the "Please explain" column.
Please explain (column 4)
- Provide any additional information to help data users interpret the details you have provided on your evaluation and classification (even if no dams have been classified as 'hazardous' or 'highly hazardous'). For example:
- The rationale of your choice of guidelines for the evaluation;
- The minimum level used to classify a dam as 'hazardous'. For example, "we follow the ANCOLD framework, considering as 'hazardous' any dam classified as 'High B' or above";
- For the use of company-specific frameworks, please explain how consequences are evaluated;
- The frequency that evaluations are revised; or
- How the classifications inform the management procedures followed.
- If the evaluation does not cover all facilities, you should explain why this is the case and any plans to extend coverage.
- If you have selected “No“ in column 1, you should explain why you do not carry out such an evaluation, including any future plans to do so.
- Note: information on your dams classified as ‘hazardous’ or ‘highly hazardous’ is requested in W-MM3.2b.
Explanation of terms
- Tailings dams under your control: Tasks (dams) for which the reporting company has ownership or operational control.
Additional information
- An international standard for assessing the consequences of failure is under development. It is co-convened by the International Council on Mining and Metals (ICMM), the Principles for Responsible Investment (PRI) and the United Nations Environment Programme (UNEP).
- The Canadian Dam Association Safety guidelines, 2017 defines ‘consequences of failure’ as the ‘impacts on the downstream or upstream area of a dam as a result of failure of the dam or its appurtenances.
(W-MM3.2b) Provide details for all dams classified as 'hazardous' or 'highly hazardous'.
Question dependencies
- This question only appears if you select "Yes, tailings dams have been classified as 'hazardous' or 'highly hazardous' (or equivalent)" in response to W-MM3.2a.
Change from 2019
New question
Rationale
Providing details for ‘hazardous’ and ‘highly hazardous’ tailings dams demonstrates a commitment to transparency around the potentially devastating consequences of tailings dam failures.
Despite the existence of a variety of categorization systems and guidelines for evaluating the consequences of dam failure to human health and ecosystems, there is no standardized definition of what constitutes ‘Hazardous’ or ‘Highly hazardous’ tailings dams. Disclosing the guidelines used together with the current and planned impoundment volumes will also demonstrate data users that a company is aware of the potential risks and how this exposure may change in the near future.
Requesting information about the location of the dam will allow data users will to relate this information to other responses in the CDP questionnaire that include country and basin specific information.
The information requested in this question aligns with the request from the Investor Mining and Tailings Safety Initiative, Sustainability Accounting Standards Board (SASB) and Global Reporting Initiative (GRI). If you responded to the Investor Mining and Tailings Safety Initiative 2019 disclosure request, you may find it useful to draw on that submission when completing these questions.
Response options
Please complete the following table. You are able to add rows by using the "Add Row" button at the bottom of the table.
| Tailings dam name/identifier
|
Country/Area
|
River basin
|
Latitude |
Longitude |
Hazard classification
|
| Text field [maximum 100 characters] |
Select from:- Country/area drop-down list
|
Select from:- River basin drop-down list
- Other, please specify
|
Numerical field [enter a number from 0 to +/- 90.000000 using a maximum of six decimal places]
|
Numerical field [enter a number from 0 to +/- 180.000000 using a maximum of six decimal places]
|
Text field [maximum 100 characters] |
| Guideline(s) used
|
Tailings dam's activity
|
Current tailings storage impoundment volume (Mm3)
|
Planned tailings storage impondment volume in 5 years (Mm3)
|
Please explain |
Select all that apply:- Australian National Committee on Large Dams (ANCOLD)
- Canadian Dam Association (CDA)
- Ordinance 70.389/17 - Mining National Agency, Brazil
- Ghana Minerals Commission (LI 2182)
- South Africa SANS 10286
- Company-specific guidelines
- Other, please specify
|
Select from: |
Numerical field [enter a number from 0-999,999,999,999,999 using a maximum of 2 decimal places] |
Numerical field [enter a number from 0-999,999,999,999,999 using a maximum of 2 decimal places]
|
Text field [maximum 1,000 characters] |
[Add Row]
Requested content
General
- You may aggregate dams located in the same river basin, only if they all have the same hazard classification following the same standard and have the same activity status.
Country/Area (column 2)
- From the drop-down menu provided, please select the country/area for the location of each tailing dam.
- Note that a selection must be made for both column 2 and column 3. Your data will not be saved if either column is left blank.
River basin (column 3)
- If you do not see the basin required, select “Other, please specify” and write in the correct river basin using the text box provided.
- You may want to put the sub-basin of a bigger river basin identified in the drop-down menu. In this case use the “Other, please specify” option in the following format: “Putumayo, Amazon”.
- For full instructions
see the Introduction to CDP's water security reporting guidance.
- Note that a selection must be made for both column 2 and column 3. Your data will not be saved if either column is left blank.
Latitude (column 4)
- Enter the latitude coordinates for the task reported in column 1. Your response should be in the format of decimal degrees and can range from 0 to +/-90.000000.
- If you are aggregating dams, provide the coordinates for the facility with the largest total impoundment volume.
Longitude (column 5)
- Enter the longitude coordinates for the task reported in this row. Your response should be in the format of decimal degrees and can range from 0 to +/-180.000000.
- If you are aggregating dams, provide the coordinates for the facility with the largest total impoundment volume.
Hazard classification (column 6)
- Provide the label used for the hazard level that applies to this dam. For example, report ‘Very High’ if the dam is classified in the fourth level of the Canadian Dam Association consequence classification ratings.
- These may be recommendations or regulations from industry bodies or public agencies, or your company’s own framework.
- If you use a company-specific framework you may indicate this here and provide further information on how you evaluate the potential consequences to human heath and the environment in the “Please explain” column.
Current tailings storage impoundment volume (Mm3) (column 9)
- Report the volumes of materials impounded in the dam. This must be in millions of cubic meters.
- If you have aggregated several tasks you may aggregate the volumes stored.
- If you cannot provide a figure, for example because there are no records of the volumes impounded, you should provide an estimation and explain this in the last column ("Please explain"). Do not enter 0 (zero).
- Only enter 0 (zero) if activity in this dam started in the current reporting year or if the dam is not yet in operation.
Planned tailings storage impoundment volume in 5 years (Mm3) (column 10)
- Report the planned volumes of materials that will be impounded in the dam in 5 years' time in millions of cubic meters.
- If you have aggregated several tasks you may aggregate the planned volumes.
- If you cannot provide a figure, for example because there are no plans for volumes impounded, or for any other reason, provide an estimation and explain this in the last column (“Please explain”). Do not enter 0 (zero).
Please explain (column 11)
- Provide any relevant further information about the volumes provided, i.e., about their quantification, composition, disposal method, tasks in which they are generated, etc.
- If you have aggregated several dams within the same river basin you should clarify this here and provide the number of dams, including whether they are all associated to one or several mines. Provide the name of the mines as appropriate.
- Please state if the dam is under joint ownership or control.
Explanation of terms
- Inactive tailings dams: Tasks in which the impoundment has become completely filled, or when tailings production has ceased.
(W-MM3.2c) To manage the potential impacts to human health or water ecosystems associated with the tailings dams in your control, what procedures are in place for all of your dams?
Question dependencies
- This question only appears if you report that you have any active or inactive tailings dams in W-MM3.2.
Change from 2019
Revised question dependency (2019 W-MM3.2a)
Rationale
Sound governance and precautionary procedures are needed to address the potential risks linked to these tasks. Providing information on existing procedures will demonstrate to investors and data users that organizations are dealing with the potential risks associated with the tailings dams under their control.
The question provides organizations with the chance to indicate and explain their company-specific management procedures, how these procedures are set, their scope, and their efficacy.
Response options
Please complete the following table. You are able to add rows by using the “Add Row” button at the bottom of the table.
| Procedure
|
Detail of the procedure
|
Please explain
|
|
Select from:
- Acceptable risk levels
- Operating plan
- Life of facility plan
- Assurance program
- Change management process
- Approval
- Other management procedure
- No management procedure applies to all tailings dams
|
Select all that apply:
- Response drop-down options below table
|
Text field [maximum of 2,500 characters]
|
[Add Row]
Detail of the procedure (column 2)
|
Acceptable risk levels
- Establishment of site-level guidance and standards for acceptable risk levels based on an evaluation of potential chemical and physical risks
- Establishment of site-level guidance and standards for acceptable risk levels for third party safety in consultation with potentially affected communities, employees and relevant government bodies
- Establishment of site-level guidance and standards for acceptable risk levels across all life stages, including post-closure
- Establishment of company-wide standards for acceptable risk levels that folllow a company policy to eliminate or minimize water-related risks associated with tailings dams
- Other, please specify
Operating plan
- An operating plan that is aligned with your established acceptable risk levels and critical controls framework
- An operating plan that includes the operating constraints of the dam and its construction method
- An operating plan that considers the consequences of breaching the operating constraints of the dam
- An operating plan that includes periodic review of the foundations and slope materials
- An operating plan that evaluates the effectiveness of the risk management measures and whether performance objectives are being met
- Other, please specify
Life of facility plan
- A life of facility plan that identifies minimum specifications and performance objectives for the operating and closure phases
- A life of facility plan that includes an identification of potential chemical and physical risks from the design and construction phases
- A life of facility plan that considers post-closure land and water use
- A life of facility plan that details the financial and human resources needed
- Other, please specify
|
Assurance program
- An assurance program for the operating phase of the facility that details the procedures for the inspections, audits and reviews
- An assurance program for each phase of the facilities´ life that includes the frequency of the various levels of inspections, audits and reviews
- An assurance program for each phase of the facilities´ life that includes the scope of the various levels of inspections, audits and reviews
- An assurance program that details the competence requirements for the persons undertaking the inspections, audits and reviews
- An assurance program that includes an external audit covering the life of facility or the operating plans
- Other, please specify
Change management process
- Inclusion of a formal change management process for the construction phase of the facility
- Inclusion of a formal change management process for the operating phase of the facility
- Inclusion of a formal change management process for the closure and decommissioning phase of the facility
- Inclusion of a change management process in the assurance program
- Inclusion of the results from external audits of operating plans or life of facility plans into the change management process
- Other, please specify
Approval
- A policy to eliminate or minimize water-related risks associated with tailings dams is approved by a C-suite officer
- The operating plan and the life of facility plan are approved by the EHS manager
- The operating plan and the life of facility plan are approved by a C-suite officer
- The results of the assurance program and the change management process are approved by the EHS manager
- The results of the assurance program and the change management process are approved by a C-suite officer
- Other, please specify
Other management procedure
|
Requested content
General
- Provide information on the company-wide procedures that aim to mitigate the potential risks associated with tailings dams.
Procedure (column 1)
- Select a procedure that best applies for your company.
- Your selection will determine the list that is presented in column 2.
- If you select “Other management procedure”, provide a label for the procedure.
- If you select “No management procedure applies to all tailings dams”, please explain this in column 3.
Detail of the procedure (column 2)
- With reference to your selection in column 1, please select a procedure that best applies to your organization.
- If none of these options apply, select "Other, please specify" and provide details of the procedures in column 3. Provide a label for the detail of the procedure.
Please explain (column 3)
- Provide further details about your response to column 1 “procedure” and column 2 “detail of the procedure”. You may include:
- Rationale for implementing these procedures.
- The level at which they are set, if they are company-wide or site-specific, and the rationale for this.
- You may add details of the competence requirements for the persons implementing the procedures, especially those undertaking the inspections, audits, and reviews.
- Any plans to develop other related management procedures that apply to all facilities.
- A rationale for exceptions to company-wide implementation of the procedures and the scope of these exceptions.
- If you selected “No management procedure applies to all tailings dams” in column 1, explain why and give details of your approach.
- If you selected “Other, please specify” in column 2, explain why and give details of your approach
Example response
| Procedure
|
Detail of procedure
|
Please explain
|
| Acceptable risk levels
|
- Establishment of site-level guidance and standards for acceptable risk levels based on an evaluation of potential chemical and physical risks
- Establishment of site-level guidance and standards for acceptable risk levels for third party safety in consultation with potentially affected communities, employees and relevant government bodies
- Establishment of site-level guidance and standards for acceptable risk levels across all life stages including post-closure
- Establishment of acceptable risk levels that follow company policy to eliminate or minimize water-related risks associated with tailings dams
|
We developed a comprehensive tailings management system to ensure that all of our tailings storage facilities (TSF) meet company-wide TSF policy, both for our copper and gold operations. The TSF policy states our goal of minimizing the risks and our "No incidents" principle, and aligns with our aim to ensure long-term economic, social and environmental value locally and to our international stakeholders. The TSF policy serves as a framework to guide the development of site-specific risk procedures. The establishment of acceptable risk levels is a key part of this. These procedures are coordinated and reviewed by the regional offices in Canada, USA and South America, and approved by the board of directors. The risk levels are approved by the COO and CSO, and consulted on with a panel of key local stakeholders from public bodies, municipalities and statutory special interest groups. This allows us to design minimum requirements for our TSF informed by local characteristics, appropriate building, operational and decommissioning procedures. Risk levels are set for each of the stage of the TSF life cycle and take account of the likelihood of adverse safety and environmental impacts, potential chemical and physical impacts, the health of people, property, environment and infrastructure. For that, they consider worst case hydrological and operational scenarios. The acceptable risk levels are set through and identification and evaluation of critical control points after an assessment of risks from overflow and seepage from TSF, release of tailings material or liquor and abrupt failure.
|
| Operating plan
|
- An operating plan that includes the operating constraints of the dam and its construction method
- An operating plan that considers the consequences of breaching the operating constraints of the dam
- An operating plan that includes periodic review of the foundations and slope materials
- An operating plan that evaluates the effectiveness of the risk management measures and whether performance objectives are being met
|
Operating plans follow the recommendations of the Mining Association of Canada which we extend to the rest of our operations. The plans at each stage of the life cycle of the TSF take account of the results of the risk assessment. Hence, they include the evaluation of the performance of the TSF facilities under several operating and environmental scenarios, both within and outside the operating constraints of the dam.
Operating plan requirements are developed by the central office in Canada and the COO, and approved by the board of directors twice a year. They include the principles, minimum performance requirements and accountabilities. Each facility director develops the mine operating plan which integrates the TSF operating plan. This plan establishes the critical control points and sets performance objectives in alignment with the acceptable risk levels of the TSF. This way, we ensure the application of high-level standards for the plans and their integration into corporate strategy.
The integrity analysis includes the evaluation of the slope and foundation materials. In the places where the risk evaluation process has identified that surrounding areas may be a risk to the integrity of the TSF, these are also evaluated.
|
| Life of facility plan
|
- A life of facility plan that identifies minimum specifications and performance objectives for the operating and closure phases
- A life of facility plan that includes an identification of potential chemical and physical risks from the design and construction phases
- A life of facility plan that considers post-closure land and water use
- A life of facility plan that details the financial and human resources needed
|
The comprehensive tailings management system covers the full life-cycle of the facilities under our control. They are informed by the results of the assurance program and change management processes. The plans are coordinated and reviewed by the three regional offices, and approved by the COO and the board of directors. Life of facility plans are integrated into corporate strategic planning. The life of facility plans include the financial and human resources needed to support TSF construction, operation and decommissioning, and to meet performance objectives at each stage.
The expected land and water use post-closure is considered in the life of facility plan and also informs the performance objectives and acceptable risk levels.
|
| Assurance program
|
- An assurance program for each phase of the facilities´ life that includes the frequency of the various levels of inspections, audits and reviews
- An assurance program for each phase of the facilities´ life that includes the scope of the various levels of inspections, audits and reviews
- An assurance program that details the competence requirements for the persons undertaking the inspections, audits and reviews
- An assurance program that includes an external audit covering the life of facility or the operating plans
|
The assurance program sets out the procedures for the review of the state and hazard level of the TSF and critical control points against the acceptable risk levels at each stage of its life cycle. During the operational stage, detailed reviews are undertaken annually by the site's EHS officer. Independent external audits are undertaken at the start of the TSF operation, annually during the operational phase and at its decommissioning. The tailings management system and the risk assessment program detail the level of the inspections. Our operations in Saskatchewan (Canada) and Colorado (US) follow additional procedures specified by the provincial and state authorities.
Results of the internal reviews and external audits are delivered directly to the regional offices. The results are compiled and delivered annually to our central offices for approval by the COO and CSO.
The scope of evaluation and competency requirements of internal or external personnel involved in the assurance program is determined by results of the risk assessment for each TSF.
|
| Change management process
|
- Inclusion of a formal change management process for the construction phase of the facility
- Inclusion of a formal change management process for the operating phase of the facility
- Inclusion of a formal change management process for the closure and decommissioning phase of the facility
- Inclusion of a change management process in the assurance program
- Inclusion of the results from external audits of operating plans or life of facility plans into the change management process
|
Results of the assurance program, including the results of the external audits are incorporated annually by the facility directors and EHS managers into the life of facility plans. This review is approved by the regional directors and, as needed, integrated into the corporate strategy.
The documentation regarding the planning, design, construction, operation and the assurance program itself, as appropriate to each stage of the life cycle of the TSF, is revised and updated with the results of the assurance program. This ensures that the operational plans and the risk assessment procedures are current and that appropriate correction measures are taken effectively.
For example, after integration of the subsidiary "Oros del Peru S.A." a new life of facility plan was developed, and the operating plans and assurance program updated to follow our TSF policy. The acceptable risk levels were revised and additional critical control points implemented with new performance objectives.
|
| Approval
|
- A policy to eliminate or minimize water-related risks associated with tailings dams is approved by a C-suite manager
- The operating plan and the life of facility plan are approved by a C-suite manager
- The results of the assurance program and the change management process are approved by a C-suite manager
|
Ultimate responsibility for
tailings dams management rests on the CEO and the COO. The latter is responsible for the goal, scope and content of our corporate policy for the TSFs. Our COO is responsible for the
approval of the operating and life of facility plans, and their integration into
the business strategy plans in coordination with the CSO. Results of the assurance program are reported annually to the CSO and COO by the operational officers to the regional operational directors in Canada, USA and Chile, who are responsible for its final approval. |
Additional information
- The Canadian Mining Association’s initiative, Towards Sustainable Mining, provides a detailed protocol for the safe management of tailings dams.
- The International Council on Mining & Metals provides a governance framework of six key elements for maintaining the integrity of tailings storage facilities.
- The Initiative for Responsible Mining Assurance provides companies and interested parties with a detailed and mature set of behaviors for the safe management of these tasks (in their the Waste and Materials Management section of their standard).
Risk identification and assessment procedures
(W3.3) Does your organization undertake a water-related risk assessment?
Question Dependencies
- Your response to W3.3 prompts subsequent questions to be presented. If your organization does not currently incorporate a water risk assessment into its core business procedures you will be presented with question W3.3e. If your response to W3.3 is amended, data in those dependent questions may be erased. In this case, be sure to re-enter data for all relevant questions. The guidance for each question indicates if it is a dependent question.The guidance for each question indicates if it is a dependent question.
Change from 2019
No change
Rationale
CDP asks about water-related risk assessment so that data-users may gauge the thoroughness of your company's understanding of its risk exposure.
Connection to other frameworks
CEO Water Mandate
Implications: Business risks
Response options
Select one of the following options:
- Yes, water-related risks are assessed
- No, water-related risks are not assessed
Requested content
General
- if you have completed a water-related risk assessment for at least part of your operations or value chain, or
- if your organization has an integrated environmental risk assessment that considers any water-related risks among other environmental aspects.
- Only select "No" if you have not conducted any form of water-related risk assessment.
Explanation of terms
- Inherent risk: The risk that exists in the absence of controls, i.e. not taking into account any potential mitigation or management measures that could be implemented.
- Residual risk: The risk remaining after a specific action has been taken to manage the risk.
- Water-related risk: The possibility of an organization experiencing a water-related challenge (e.g., water scarcity, water stress, flooding, infrastructure decay, drought (adapted from the CEO Water Mandate's "Corporate Water Disclosure Guidelines").
(W3.3a) Select the options that best describe your procedures for identifying and assessing water-related risks.
Question dependencies
- This question only appears if you select “Yes, water-related risks are assessed” in response to W3.3.
Change from 2019
Minor change, Modified guidance
Rationale
Providing details of your water risk assessment coverage and procedures allows CDP data users to assess the thoroughness of your risk assessment and whether this is appropriate for the water dependency and risks that you disclose for each stage of your value chain.
Connection to other frameworks
CEO Water Mandate
Implications: Business risks
Response options
Please complete the following table:
|
Value chain stage
|
Coverage
|
Risk assessment procedure
|
Frequency of assessment
|
How far into the future are risks considered?
|
Type of tools and methods used
|
Tools and methods used
|
Comment
|
|
Direct operations
|
Select from:
|
Select from:
- Response drop-down options below table
|
Select from:
- More than once a year
- Annually
- Every two years
- Every three years or more
- Not defined
|
Select from:
- Up to 1 year
- 1 to 3 years
- 3 to 6 years
- More than 6 years
- Unknown
|
Select all that apply:
- Tools on the market
- Enterprise Risk Management
- International methodologies
- Databases
- Other
|
Select all that apply:
- Response drop-down options below table
|
Text field [maximum 1,500 characters]
|
|
Supply chain
|
|
|
|
|
|
|
|
|
Other stages of the value chain
|
|
|
|
|
|
|
|
Risk assessment procedure (column 3)
- Water risks are assessed as part of an enterprise risk management framework
- Water risks are assessed as part of other company-wide risk assessment system
- Water risks are assessed in an environmental risk assessment
|
- Water risks are assessed as a standalone issue
- Other, please specify
|
Tools and methods used (column 7)
Tools on the market
- Ecolab Water Risk Monetizer
- GEMI Local Water Tool
- Water Footprint Network Assessment tool
- WRI Aqueduct
- WWF Water Risk Filter
- SIWI Water Tool
- Ceres AquaGauge
- Other, please specify
Enterprise Risk Management
- COSO Enterprise Risk Management Framework
- ISO 31000 Risk Management Standard
- Other, please specify
International methodologies- Environmental Impact Assessment
- Life Cycle Assessment
- IPCC Climate Change Projections
- Alliance for Water Stewardship Standard
- Other, please specify
|
Databases
- FAO/AQUASTAT
- Maplecroft Global Water Security Risk Index
- Regional government databases
- UNEP Vital Water Graphics
- Other, please specify
Other
- Internal company methods
- External consultants
- National-specific tools or standards
- Other, please specify
- Don’t know
|
Requested content
General
- In this question, along with W3.3b and W3.3c, you are asked for information about the procedures and tools used for risk identification, information collection and assessment across your value chain. W3.3d asks for a rationale for your approach to risk assessment and the choice of procedures and tools you describe in this question.
Value chain stage (column 1)
- Other stages of the value chain (row 3): Companies are encouraged to carry out some level of risk assessment direct operations and suppliers. For example, this could include franchisees you engage on water risks and stewardship strategies.
Coverage (column 2)
- You would select 'Full' if you carry out at least an initial light touch assessment across the whole of your operations, supply chain or other value chain stage; for example to identify priority 'hot spots' that require a more comprehensive water risk assessment. You should give the specific details and rationale for your approach in W3.3d, such as what tiers of your supply chain are included and why.
- Select 'Partial' if certain elements of your direct operations, supply chain or other stages of your value chain are excluded from your risk assessment process. Explain your reasons in W3.3d.
- If you select ‘None’, columns 3, 4, 5, 6, and 7 will be disabled. Please provide an explanation in W3.3d.
Risk assessment procedure (column 3)
- For the stage of your value chain shown in column 1, indicate your company’s main procedure for identifying and assessing water-related risk. If multiple approaches apply, select the main or primarily applicable procedure and note this in column 8.
- If none of the available options are suitable, select “Other, please specify” to provide a label for the risk assessment procedure.
- You will be able to explain your approach and give a rationale in W3.3d.
- Note: “Enterprise risk management” is an established standardized framework for integrating sustainability risks into company risk assessment. See the ‘Explanation of terms’.
Type of tools and methods used/Tools and method used (columns 6-7)
- Your selection in column 6 will determine which tools/response options appear in column 7.
- If you select “Other, please specify”, provide a label for the tool or method used.
Comment (column 8) (optional)
- If ‘Partial’ is selected in column 2, provide the level of coverage, e.g. which geographies, business units, products or which tiers of supply chain.
- If “Other” tools are selected in column 7, you can give some details here.
- You will be able to explain your approach and give a rationale in W3.3d.
Explanation of terms
- Direct operations: Your organization’s operations include anything your company does itself for the purpose of producing goods and services and maintaining the functionality of the business. This covers any internal supply chains between your organization’s business units. For example, a business unit within your company that supplies components to another business unit within your company would be considered part of your organization’s own operations.
- Supply chain: Your organization’s supply chain is comprised of all external inputs to your operations, including materials, components, consumable inputs, and services. The scope of your supply chain may extend to multiple levels of supply, e.g. component suppliers and the suppliers of raw materials used to produce those components.
- Value chain stage: One part of the sequence of activities that provide value to or receive value from the organization’s products and services. This can include activities within the organization’s direct operations, or up or downstream of those operations; such as the supply chain, joint ventures, franchisees, product users.
- Risk management: Risk management involves understanding, analyzing and addressing risk to make sure organizations achieve their objectives. So it must be proportionate to the complexity and type of organization involved (Institute of Risk Management, 2016)
- Enterprise risk management: This is an integrated and joined up approach to managing risk across an organization and its extended network (Institute of Risk Management, 2016).
(W3.3b) Which of the following contextual issues are considered in your organization’s water-related risk assessments?
Question Dependencies
- This question only appears if you select “Yes, water-related risks are assessed” in response to W3.3.
Change from 2019
No change
Rationale
As an indication of the comprehensiveness of the risk assessment, CDP data users need to know which contextual issues inform your understanding of water related risks within the markets, jurisdictions and geographies you operate in, and which are considered relevant and why.
Response options
Please complete the following table:
| Contextual issue
|
Relevance & inclusion
|
Please explain
|
|
Water availability at a basin/catchment level
|
Select from:
- Relevant, always included
- Relevant, sometimes included
- Relevant, not included
- Not relevant, included
- Not relevant, explanation provided
- Not considered
|
Text field [maximum 2,500 characters]
|
|
Water quality at a basin/catchment level
|
|
|
|
Stakeholder conflicts concerning water resources at a basin/catchment level
|
|
|
|
Implications of water on your key commodities/raw materials
|
|
|
|
Water-related regulatory frameworks
|
|
|
|
Status of ecosystems and habitats
|
|
|
|
Access to fully-functioning, safely managed WASH services for all employees
|
|
|
|
Other contextual issues, please specify
|
|
|
Requested content
General
- When answering this question, consider which contextual issues are relevant for a water-related risk assessment for your organization.
- The table has fixed rows for different contextual issues which may be factored into your organization’s risk assessment. Complete each row with as much data as possible for each of the contextual issues.
- If any contextual issues are factored into your risk assessment and are not included in this table, in the last row select ‘Relevant, always included’ or ‘Relevant, sometimes included’ and provide details in column 3.
Relevance & inclusion (column 2)
- For each row, select the option that most accurately represents your organization’s inclusion of the contextual issue in your risk assessment.
- If no other contextual issues are included in your risk assessment, select ‘Not considered’ in the last row.
- Only select ‘Relevant, always included’ if the contextual issue is factored into your water risk assessment throughout your entire organization.
- If you select ‘Relevant, not included’ or ‘Not considered’, you should describe any future plans in column 3.
- Only select ‘Not relevant, included’ if your company considers the issue as not relevant for its water risk assessment but nevertheless continues to include it in assessment procedures. This may be for a number of reasons, such as the completeness of a standard or to facilitate future consideration.
- If you select ‘Not relevant, explanation provided’ you should use column 3 to explain why it is not currently relevant and if you anticipate it to be relevant in the future.
Please explain (column 3)
- Where a contextual issue is included in your company’s risk assessment, you should provide company-specific information regarding each row. This may include:
- why you include this information, and why this issue is important to your business
- how you assess this contextual issue to be relevant/how relevance is defined (e.g. the tool used in W3.3a)
- if, and why, the issue is covered for all three stages of your value chain
- if the issue is particularly relevant for specific organizational levels
- whether both current and emerging issues are included.
- If you have selected an option in column 2 to indicate that a contextual issue is not relevant or not included, please provide your explanation here.
- In W3.3d, you can also explain how this information on contextual issues is used for decision making.
Explanation of terms
- Contextual issue: External influences relevant to the organization’s water security and water-related risks.
- Water availability: The natural runoff (through groundwater and rivers) minus the flow of water that is required to sustain freshwater and estuarine ecosystems and the human livelihoods and well-being that depend on these ecosystems. Water availability typically varies within the year and also from year to year. Water availability might be reduced by decreases in both the water quantity and quality of water resources (adapted from the CEO Water Mandate's "Corporate Water Disclosure Guidelines").
Example response
| Contextual issue
|
Relevance & inclusion
|
Please explain
|
|
Water availability at a basin/catchment level
|
Relevant, always included
|
We consider this a highly relevant contextual issue for our organization across all stages of our operations and value chain. We evaluate surface water availability and ground water levels for the main aquifers that our operations are dependent upon and that we have an impact on. We use information gathered by our operational and EHS managers using our hydrological models, the river basin management plans plus the WRI’s Aqueduct and ICMM’s Climate Data Viewer Tool. When information is missing, our in-house hydrologists collaborate with national and regional research bodies on predictive models for groundwater levels in nearby aquifers. This is the case of, for example, the operations in the Saguenay river basin in Canada. This information is compiled into our Enterprise Risk Management system which is ISO 31000 aligned. Water availability is monitored by our Global Sustainability, EHS and our Global Quality Organization functions for our three offices in Canada, USA and Chile. Our sites have detailed current and predictive water balances in place for understanding current and future water management requirements, including water availability levels. For example, the Colorado river basin in which we operate our main production facility is predicted by WRI Aqueduct to become more stressed following a number of internal and external factors including our predicted future growth, urbanization in the Bloomfields-Little City conurbation and irrigation development in the Sandy Creek area along with more intense droughts. By considering different levels of these variables we have been able to develop a range of different future risk profiles and identify that stakeholder conflict poses a bigger risk than water availability under certain conditions.
|
|
Water quality at a basin/catchment level
|
Relevant, always included
|
We don’t require high quality water for most of our
operations. However, we monitor water quality upstream and downstream of our
operation for surface waters and sample water quality in nearby aquifers. When
information is missing, our in-house hydrologists collaborate with national and
regional research bodies. Our main water-related risks are associated with acid
rock drainage and heavy metals presence at some of our gold operations in
Colorado and Canada, and at copper operations in Chile. In greenfield operations,
before significant developments, or in the decommissioning phase, we establish
a baseline water quality status following the recommendations of the Canadian
Mining association to track progress.
This information is compiled into our Enterprise Risk Management system, which is ISO 31000 aligned. Water quality is monitored by our
Global Sustainability, EHS and our Global Quality Organization functions for
our three offices in Canada, USA and Chile. We are developing further
understanding to assess cumulative impacts in the river basins, currently and
after potential developments in the basin that may affect the water quality of
surface and groundwater. For instance, the
Rocky Plains are predicted by the WRI
Aqueduct to become more stressed following a number of internal and external
factors.
|
|
Stakeholder conflicts concerning water resources at a basin/catchment level
|
Relevant, sometimes included
|
As part of our risk assessment procedures, we identify local
stakeholders following our corporate level “Stakeholder engagement, sustainable
development and fair communities” policy statement. We use local NGOs as
consultants, and we record this information in our in-house tracking Enterprise
Risk Management system that is aligned with ISO 31000. This allows us to be
aware of potential conflicts, both current and future. We consider our key stakeholders to include
all water users that share the water resources or who may be affected by
potential pollution events. For every important new development, our site’s conduct specific consultations that follow the principles of free, prior and informed
consent. We engage our local
stakeholders in information and consultation sessions from the project planning
to operation and decommissioning phases and before important expansions of the
operations, including tailings storage facilities.
We have community and grievances mechanisms aligned with the
recommendations of the ICMM and the Canadian Mining Association that also help
us mitigate the risk of community opposition. This information is incorporated
into our risk assessment. The potential for future stakeholder conflicts
is difficult to forecast directly, so we use our analysis of future water availability
and quality as a proxy indicator to assess areas that have already been
identified as potential hotspots. For example, in our Colorado operations we
are starting to engage with local farmers’ associations and the river basin
agency to tackle impacts to a local aquifer shared by our site and the Sandy
Creek irrigators’ syndicate. |
|
Implications of water on your key commodities/raw materials
|
Relevant, sometimes included
|
Our water-related risk assessment considers our supplies of
our raw materials. The most significant
input to be impacted by water would be our energy consumption. Using the WRI Aqueduct, coupled with company
knowledge and national sources, we forecast whether a decrease in the
availability of water locally will affect the capacity to generate energy.
We evaluate the long-term water risks associated with bigger
projects like desalination plants we rely upon at some of our sites.
These projections are costly studies that we perform at the
evaluation phase of a plant and are only revised when major developments in our
production capacity are evaluated.
|
|
Water-related regulatory frameworks
|
Relevant, always included
|
The existing and potential regulatory frameworks for
water withdrawals, discharges, tariff changes, water costs, licensing of operations and drought management plans are
all key for our activities.
It is expected that local legislation will be reviewed to
reflect the growing need for strong water management in these areas. We are preparing for this by engaging
with state, river basin and local policy makers and stakeholders about the best
management plan for the region, and future changes to regulatory frameworks
are therefore a key component in our risk assessment procedures.
Our central legal department works with our three regional
offices on these matters, and relevant developments are incorporated into our
Enterprise Risk Management system to inform on-site management and strategic
corporate level.
For example, at our site in Peru, we have been evaluating the dispositions
from the National Water Agency, ANA, that may affect the withdrawal or
discharge permits. but have not
assessed this issue to be a risk. In our operations in Colorado, we have been
following closely the legislative development on the licensing of aquifer
recharge as a drought mitigation option, called the “Nichols” act.
|
|
Status of ecosystems and habitats
|
Relevant, always included
|
In accordance with our water policy, it is
essential for good water stewardship that we incorporate the impacts on the
local water dependent ecosystems into our risk assessments. To properly assess this risk, we employ company knowledge, collaboration with national or
international research bodies and community participation to identify the
potential natural areas that can be affected.
We evaluate the potential disruption to ecosystem functioning
of our water withdrawals, including the effects on the water table from
dewatering operations, from our water discharges and potential spillages.
Bio-monitoring surveys are conducted to detect any impact on the quality of
downstream water linked to heavy-metal presence or acidification.
We evaluate a vulnerability index of the natural areas
considering attributes like the dependency of other water users from the
resource, biodiversity richness, and qualitative valuation by a panel of local
stakeholders.
Preliminary studies on the future impacts are performed
using water scarcity indicators as a proxy of decreased availability and
dilution capacity that may increase the vulnerability of the ecosystems.
|
|
Access to fully-functioning, safely managed WASH services for all employees
|
Not relevant, included
|
Despite our assessments that show this is not a material
water-related risk for our operations, we include this element in our
workplace assessments at every operating location. This allows us to ensure the
health and safety of all our employees, and also as part of our corporate
responsibility to respect and ensure implementation of the human right to water
and sanitation. This is the baseline expectation of the UN Guiding Principles
for Business and Human Rights. We also use the WBCSD implementation guide for
Business Action for safe water, sanitation and hygiene to help us understand
our risks and possible actions, in addition to health and safety assessment
KPIs.
|
|
Other contextual issues, please specify
|
|
|
(W3.3c) Which of the following stakeholders are considered in your organization’s water-related risk assessments?
Question Dependencies
- This question only appears if you select “Yes, water-related risks are assessed” in response to W3.3.
Change from 2019
No change
Rationale
There are no international standards for water-related risk assessment, so companies need to identify which stakeholders are relevant to their business and their risk exposure. When considering your risk disclosure, it is useful for CDP data users to know if your consideration of stakeholders in your risk assessment process is appropriate for the importance rating you assigned to water in your indirect operations in W1.1 and enables a comprehensive understanding of water-related risks.
Response options
Please complete the following table:
| Stakeholder
|
Relevance & inclusion
|
Please explain
|
|
Customers
|
Select from:
- Relevant, always included
- Relevant, sometimes included
- Relevant, not included
- Not relevant, included
- Not relevant, explanation provided
- Not considered
|
Text field [maximum 2,500
characters]
|
|
Employees
|
|
|
|
Investors
|
|
|
|
Local communities
|
|
|
|
NGOs
|
|
|
|
Other water users at a basin/catchment level
|
|
|
|
Regulators
|
|
|
|
River basin management authorities
|
|
|
|
Statutory special interest groups at a local level
|
|
|
|
Suppliers
|
|
|
|
Water utilities at a local level
|
|
|
|
Other stakeholder, please specify
|
|
|
Requested content
General
- When answering this question, consider which stakeholders are relevant for a water-related risk assessment for your organization.
- The table has fixed rows for different stakeholders which may be factored into your organization’s risk assessment. Complete each row with as much data as possible for each of the stakeholders.
Stakeholder (column 1)
- If you are uncertain whether one of your stakeholders fits well into one of the categories listed here, please use the row anyway and explain the uncertainty in the last column.
- Note that ‘Water utilities at a local level’ includes municipal, industrial, and private water suppliers, and water utilities that treat municipal or industrial wastewater. Though the provision of water could be considered part of your supply chain, CDP distinguishes it from ‘Suppliers’ in this question due to its importance in the context of a water risk assessment.
- If your risk assessment considers stakeholders that are not included in this table, in the last row select ‘Relevant, always included’ or ‘Relevant, sometimes included’ in column 2 and provided details in the last column.
Relevance & inclusion (column 2)
- For each row, select the option that most accurately indicates the relevancy of the stakeholder for inclusion in your risk assessment.
- If no other stakeholders are included in your risk assessment, select ‘Not considered’ in the last row.
- Only select ‘Relevant, always included’ if the stakeholder was factored into your organization’s water risk assessment throughout the entire organization.
- If you select ‘Relevant, not included’ or ‘Not considered’ for any other row, you should describe any future plans in the last column.
- Only select ‘Not relevant, included’ if your organization considers the stakeholder as not relevant for its water risk assessment but nevertheless continues to include it in assessment procedures – for e.g., because of the need for completeness for a standard, or to facilitate future consideration of the stakeholder.
- If you select ‘Not relevant, explanation provided’ you should use the last column to explain why the stakeholder is not currently relevant and if you anticipate it to be relevant in the future.
Please explain (column 3)
- Where a stakeholder is included in your company’s risk assessment, you should provide company-specific information. This may include:
- why you include this stakeholder in your risk assessment procedure, and why they are important to your business
- how you assess this stakeholder to be relevant, and how relevance is defined
- if, and why, the stakeholder is covered for all three stages of your value chain
- if the stakeholder is particularly relevant for specific organizational levels or geographies
- whether this is a current or future stakeholder.
For example: “Our water withdrawals are low compared to other users in the Berg catchment, but we include local communities in our water-related risk assessment because many of our site employees’ families live locally to Cape Town and we have a public commitment to SDG 6 ‘clean water and sanitation for all’.
- Where a stakeholder is considered not relevant, please explain why this is the case. For example, there may not be a river basin authority (or equivalent body) in the locations where you operate, or this role may be otherwise performed by the regulator.
- In W3.3d, you can also explain how this information related to stakeholders is used for decision making.
Explanation of terms
- River basin management authorities: Any organization with public responsibility for managing and/or regulating any aspect of water for an entire river basin. This can include national, regional, or municipal bodies.
- Statutory special interest groups: Any body or organization which the company is obliged to consult with on water issues due to a statutory or regulatory requirement.
Example response
| Stakeholder
|
Relevance & inclusion
|
Please explain
|
| Customers
|
Not relevant, sometimes included
|
We have evaluated the
materiality of water-related risks downstream in our value chain. This was very
low but we continue to include this group in our risk assessment because we participate
in responsible/ethical sourcing programs with some of our gold customers, and
we are aligning with certification initiatives like the Responsible Jewelry
Council. We
expect that this stakeholder will be more relevant in the future, as consumer
demand for so-called sustainable minerals increases. |
| Employees
|
Relevant, always included
|
Employees are included
because they help our identification of water-related risks and opportunities
and may be impacted by our activities. Every employee is informed of our water
stewardship and our water management policies. We strive to continually improve
our water performance through training of all new employees and raising
awareness and review this annually. We have set
communications channels for employees to report water-related risks and
opportunities. Targets associated with water-related risk identification
and management are also included in performance contracts of relevant site- and
corporate-level managers. |
| Investors
|
Relevant, always included
|
Investors’ concern about
our water-related risks is central to our corporate strategy and represents a
risk to our capacity to access capital under satisfactory conditions. This is
why they are always included. We report water risks
and responses in our integrated annual sustainability reporting pack that is
sent to shareholders by our Investor Reporting team so our investors can assess
their investment. Our water-related performance is freely available in our web. This information is also provided to our
CEO, who has direct oversight of water-related issues, and our CFO. We expect that in the future investors’ involvement
and proactiveness will increase and we prepare ourselves with this perspective. |
| Local communities
|
Relevant, always included
|
As part of our risk assessments, we identify local communities with whom we share water resources, as they
represent the most material stakeholders for our water-related risks, following our “Stakeholder
engagement, sustainable development and happy communities” policy statement. This is led by our site EHS managers. This gives
us a good understanding of key issues in the river basin and allows us to
tackle proactively potential conflicts at an early stage. All our sites engage local communities in
accordance with the AA1000 stakeholder engagement principles and the guidelines
provided by ICMM. We invite them to information and consultation sessions in Community Advisory panels from the project planning to
operation and decommissioning phases. The
panels meet quarterly, or according to need. Before important expansions of the operations,
including tailings storage facilities, we engage in specific sessions and follow the principles of free, prior and informed
consent. |
| NGOs
|
Relevant, always included
|
NGOs are part of our
stakeholder engagement policy and are regarded as valuable partners to identify
and discuss water-related concerns and opportunities, and for maintaining strong
government and community relationships. We include NGOs in our risk
assessments and engage as a relevant stakeholder both at the local and corporate
levels.
At the corporate level, engagement
with international NGOs like WWF or TNC on our water policy helps strengthen
our approach.
We are part of the ICMM
and IRMA, which allow us to improve our processes.
At the regional and
national level, we engage with NGOs in specific projects to improve our
understanding of and tackle basin-wide challenges. For example, we are part of
a consortium with TNC, public bodies and water users in the Athabasca river
basin, to advance adaptive water management approaches and biodiversity
conservation. |
| Other water users at a
basin/catchment level
|
Relevant, always included
|
Along with local
communities, other water users in a river basin, particularly other mining
companies, represent an essential stakeholder for our water-related risks.
Regulatory, market and reputational risks to our company may arise from the
activities of these actors. As part of
risk identification, we discuss current issues with them in river basin
committees, where such bodies exist, or in Community Advisory panels, where
there are no similar bodies. We invite them to information and consultation sessions in Community Advisory panels from the project
planning to operation and decommissioning phases. The panels meet quarterly, or according to need. We also engage
before important expansions of the operations, including tailings storage
facilities.
This gives us a good
understanding of key issues in the river basin and allows us to tackle
proactively potential conflicts at an early stage. We expect these stakeholders to become more
relevant in the places where increased water stress levels are predicted. |
| Regulators
|
Relevant, always included
|
Regulations and
legislations affect our activities so we include regulators such as state/regional
governments, municipalities and ministries like the Department for Water and Sanitation.
For example, in Peru we include the geological institute (INGEMMET) into our
risk assessments.
Our central legal department works with our three regional offices on these
matters, and relevant developments are incorporated into our Enterprise Risk Management system to inform on-site management and strategic corporate level.
We engage with the regulators directly, or through our participation in
national industry association like the Mining Association of Canada on policy, resource planning and compliance issues.
Our engagement with the regulators is done regularly throughout the year in
face-to-face meetings and workshops. The specific topics relate to the water
risks associated to those watersheds as per our risk assessments. For example, in
Colorado, we engage with regulators on the development of legislation for the
use of aquifer recharge as a drought mitigation option. |
| River basin management
authorities
|
Relevant, always included
|
River basin management
and strong governance benefits our operations ensuring adequate supply and
minimizing water conflicts. Through our regional offices we participate in
river basin committees wherever they exist and any consultation processes
that river basin agencies set up for the revisions of the management plans or
in the events of activation of drought management plans.
Additionally, they are
invited to participate in our information and consultation sessions as relevant
to their activity. In some jurisdictions, like in our sites in
Saguenay River, we are exploring data-sharing agreements on water quality and
aquifer hydrology to strengthen our processes and achieve synergies. |
| Statutory special
interest groups at a local level
|
Relevant, always included
|
These
stakeholders are water users with whom we share the resource and hence, they
represent material stakeholders for our water-related risks.
We
discuss current issues with them in river basin committees, where such bodies
exist, or in Community Advisory panels, where there are no similar bodies. We
invite them to information and consultation sessions in
Community Advisory panels from the project planning to operation and
decommissioning phases. The panels meet quarterly, or according to
need. We also engage before important expansions of the operations,
including tailings storage facilities.
This gives us a good
understanding of key issues in the river basin and allows us to tackle
proactively potential conflicts at an early stage.
In
our Colorado operations we are starting to engage with local farmers’
associations and the river basin agency to tackle impacts to a local aquifer
shared by our site and the Sandy Creek irrigators’ syndicate. We expect these stakeholders to become more
relevant in the places where increased water stress levels are predicted. |
| Suppliers
|
Relevant, always included
|
Suppliers have not been
identified as exposing us to current material water-related risk. However, we
include our supply chain in risk assessments particularly in relation to the
supply of energy and infrastructure development. We also evaluate the impact of
extreme weather events to logistics. Currently we are developing our
understanding of water-related risks upstream of our value chain and we expect new
risks to be identified as a result. |
| Water utilities at a
local level
|
Relevant, always included
|
Water providers at the
local level are an important stakeholder as they are one of the main water
users downstream from our operations.
We
discuss current issues with them in river basin committees, where such bodies exist,
or in Community Advisory panels, where there are no similar bodies. We
invite them to information and consultation sessions in
Community Advisory panels from the project planning to operation and
decommissioning phases. The panels meet quarterly, or according to
need. We also engage before important expansions of the operations,
including tailings storage facilities. At our site in Peru we are exploring the possibility
to engage with the local water provider and other stakeholders in a Payment for
Ecosystem Services scheme where our water and land conservation activities may
benefit them. This is promoted by the National Water Agency (ANA) of the
country in collaboration with the regional government of Arequipa. This
engagement is expected to increase in the future as there is interest from the
authorities in promoting these plans. |
| Other stakeholder,
please specify
|
|
|
(W3.3d) Describe your organization’s process for identifying, assessing, and responding to water-related risks within your direct operations and other stages of your value chain.
Question dependencies
- This question only appears if you select “Yes, water-related risks are assessed” in response to W3.3.
Change from 2019
No change
Rationale
By providing an explanation for the steps and procedures that make up your risk assessment process, including identification, prioritizing and decision making, investors and other data users will know whether your organization has a robust approach to risk management. They will be able to consider whether it is optimal for your activities, and the locations and markets that you and your suppliers operate in.
Connection to other frameworks
CEO Water Mandate
Implications: Business risks
Response options
This is an open text question with a limit of 5,000 characters.
Requested content
General
- This question asks you to provide a rationale for your approach to risk assessment and to explain your choice of procedures and tools described in W3.3a, b and c. This should include an explanation of:
- Level of coverage:
- why you have chosen the level of coverage (how coverage is determined e.g. which tiers of supply chain), the horizon and tool for each of the 3 stages of the value chain.
- How risks are classified:
- at a company level, and at an asset level. Asset level is defined as anything below company level such as individual sites and subsidiaries.
- for the 3 different stages of your value chain.
- how decisions are made on the severity of the risk.
- Your decision-making process for risk response– including for e.g.:
- how the information collected, such as on contextual and stakeholder issues, is used in decision making.
- how decisions are made to mitigate, transfer, accept, or controls risks.
- references to risks terminology / approaches that you employ.
- Note that specific details of inherent risks and opportunities faced by your organization should be disclosed in Module 4.
- Note that your response to this question may refer to the position of employees relevant to your risk assessment process. In this case, do not include the name of any individual or any other personal data in your response.
Explanation of terms
- Inherent risk: The risk that exists in the absence of controls, i.e. not taking into account any potential mitigation or management measures that could be implemented.
- Residual risk: The risk remaining after a specific action has been taken to manage the risk.
- Risk procedures: The details of the steps that make up a risk identification, assessment and management process, such as frequency, geographic scope, tools used, issues addressed and stakeholders considered.
- Risk process: The combination of steps taken to identify, quantify, monitor, record, prioritize, and respond to risk to minimize its likelihood or impact so that business objectives can be met.
(W3.3e) Why does your organization not undertake a water-related risk assessment?
Question Dependencies
- This question only appears if you select “No, water-related risks are not assessed” in response to W3.3.
Change from 2019
No change
Rationale
Your company has received this questionnaire because it is believed to conduct activities with a high dependency on a stable supply of fresh water and/or has a significant potential for polluting freshwater resources. As such, investors are likely to consider that you are exposed to water-related risks.
A thorough risk assessment is integral to appropriately identifying, understanding and addressing water-related risks. Without undertaking a risk assessment, companies may be unable to determine the best ways to prepare for future uncertainties and liabilities.
Companies may have many reasons for not undertaking risk assessments, and CDP data users are interested in learning more about why this is the case for your company and the planning processes and contexts for this.
Response options
Please complete the following table:
| Primary reason
|
Please explain
|
|
Select from:
- We are planning to introduce a risk assessment process within the next two years
- Important but not an immediate business priority
- Judged to be unimportant, explanation provided
- Lack of internal resources
- Insufficient data on operations
- No instruction from management
- Other, please specify
|
Text field [maximum 1,500 characters]
|
Primary reason (column 1)
- Choose the option that best explains why your organization does not undertake a water-related risk assessment.
- If multiple options reasonably apply to your company, select the primary option in column 1 and explain any additional reasons in column 2.
- If you select “Other, please specify”, provide a label for the primary reason.
Please explain (column 2)
- Use this space to provide company-specific insight as to your selection in column 1.
- Your answer here should align with the importance you assign to water in W1.1.
- Describe any future plans to undertake a water risk assessment (or details of any risk assessment process currently underway) and the likely timescale for implementation. Include company-specific information in your description.
W4 Risks and opportunities
Module Overview
The structure of the water security questionnaire allows an organization to tell investors, customers and other data users about its water stewardship journey. With modules 1-3 complete, data users now understand the current state of an organization’s use of water and how water related risks are identified.
An understanding of the number, location and nature of inherent water risks is valuable for disclosing organizations, as well as CDP data users. Module W4 allows organizations to show that they have a clear awareness of the extent to which they are exposed to inherent water risks in their direct operations and other parts of their value chain.
CDP asks organizations to report substantive water-related risks, the potential impacts of those risks and share details of their associated response strategies. We also invite organizations to share any water-related operational or market opportunities being realized that could substantively benefit their business.
The financial related information requested in W4.1, W4.2, and W4.3 may help organizations with their climate-related disclosures in line with the TCFD recommendations. This information helps investors assess the potential impacts to valuations and the adequacy of the organization's risk response.
In module W5, organizations exposed to substantive risk are requested to provide facility-level information.
Note:
Providing information about inherent risk exposure rather than residual risk allows data-users to consider the potential impact and the appropriateness of the organization’s response. Water risk impacts the cost of doing business and may impact on stock volatility.
CDP asks about risks anywhere in your business that are substantive at the corporate level (not those that are significant only at the facility level, for example). We wish only to know about risks that have the ability to impact the business, financially, strategically or otherwise, at the corporate level.
You may wish to consult with your financial, legal, and/or compliance departments for advice on your organization’s general approach to the provision of forward-looking statements and information concerning risks.
Key changes
- Changes have been made to response options in this module. If you disclosed to CDP in the previous reporting year, please review your auto-populated responses carefully. It is your responsibility to ensure the accuracy and completeness of your current disclosure.
- Click here for a list of all changes made this year.
Sector-specific content
- W4.1c presents an additional column for Oil & Gas, Metals & Mining, Electric utilities.
- Sector specific additions to drop downs in risk tables: Metals & Mining, Food, Beverage & Tobacco, Chemicals.
- Sector specific additions to drop downs in opportunities table: Oil & Gas.
Pathway diagram - questions
This diagram shows the questions contained in module W4. To access question-level guidance, use the menu on the left to navigate to the question.
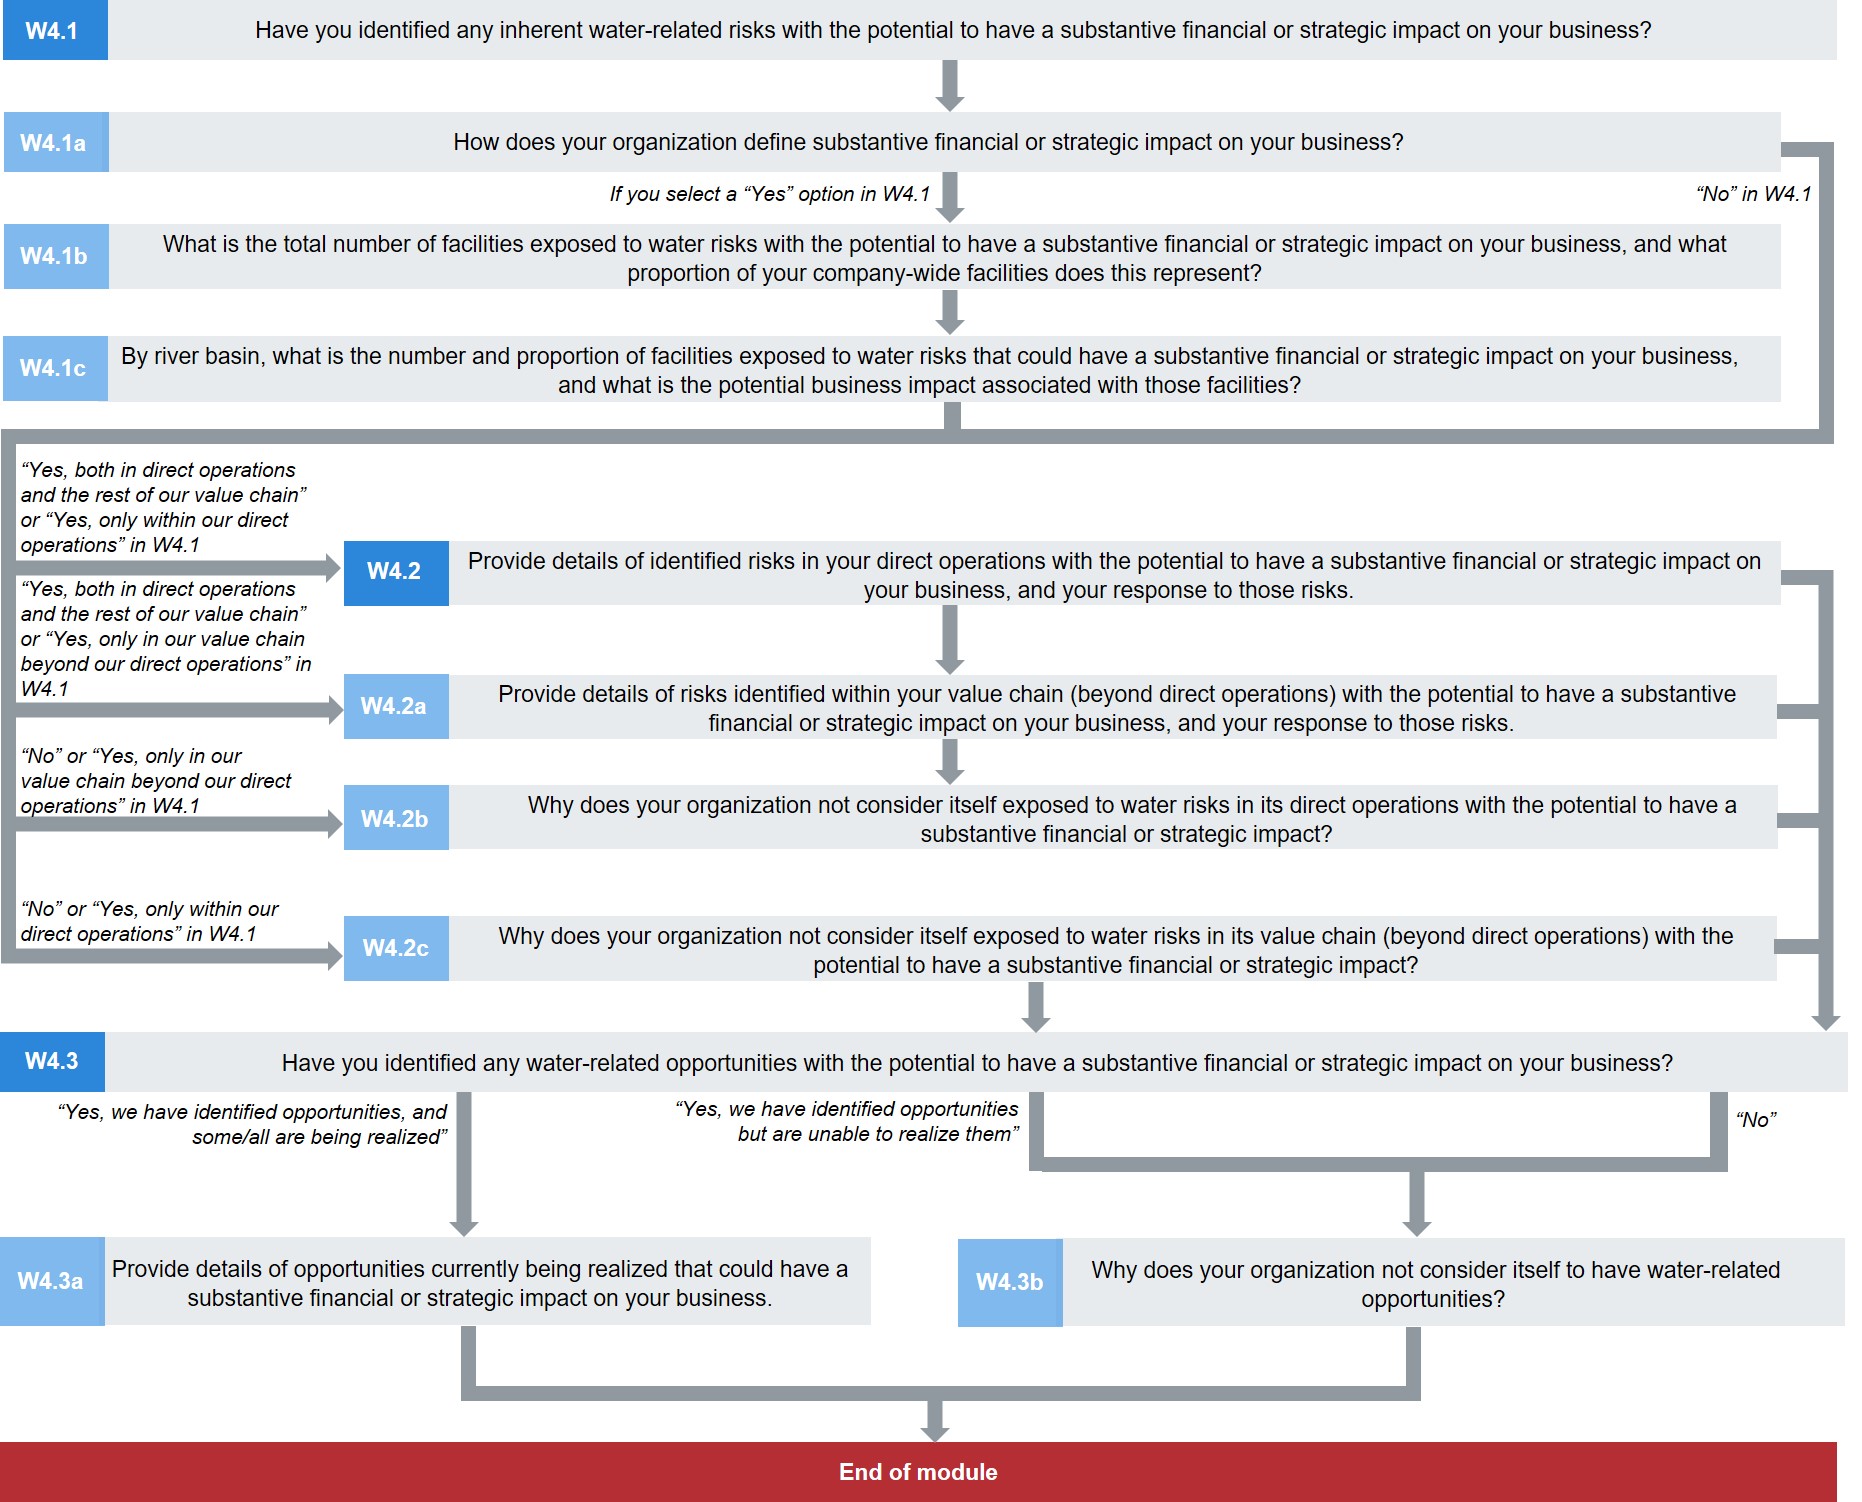
Pathway diagram - questions for minimum version questionnaire
This diagram shows the questions contained in module W4 that are included in the minimum version of the questionnaire. To access question-level guidance, use the menu on the left to navigate to the question.
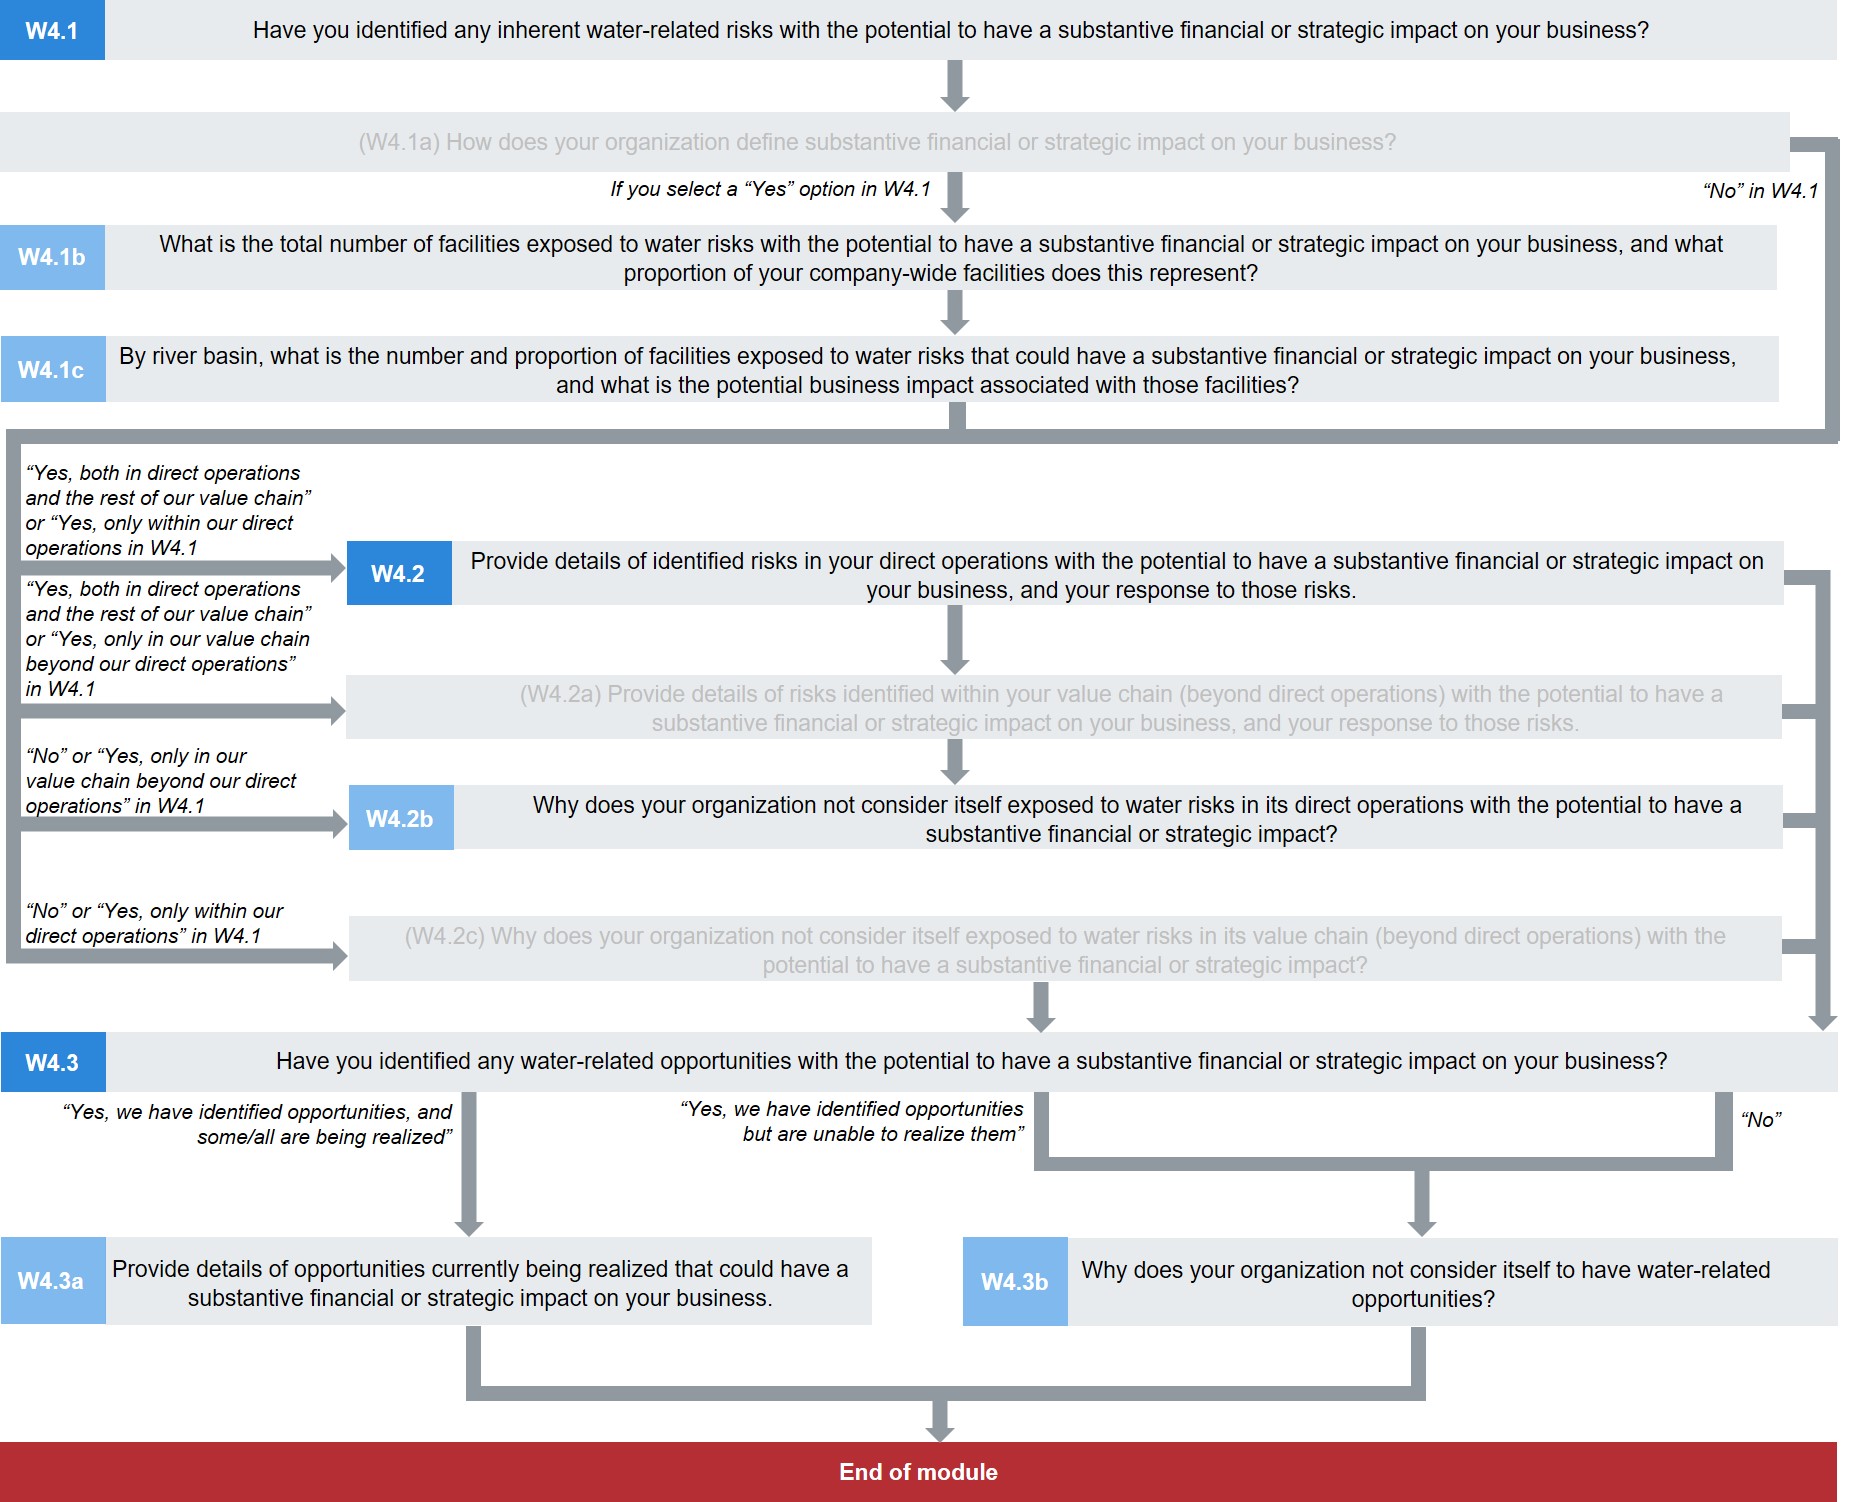
Risk exposure
(W4.1) Have you identified any inherent water-related risks with the potential to have a substantive financial or strategic impact on your business?
Question dependencies
- Your response to W4.1 will determine which subsequent questions are presented. If your response to W4.1 is amended, data in those dependent questions may be erased. In this case, be sure to re-enter data for all relevant questions. The guidance for each question indicates if it is a dependent question.
Change from 2019
No change
Rationale
Data users wish to know whether your organization has knowledge of any water risks across any part of your value chain that are substantive at the corporate level. This information is critical for guiding investments and actions to improve business resilience and water stewardship.
Note that we only request information on issues that are exposing your facilities, business units etc. to risks that have the potential to substantively impact, strategically as well as financially, on your business at the corporate level.
Connection to other frameworks
CEO Water Mandate
Implications: Business risks
Response options
Select one of the following options:
- Yes, both in direct operations and the rest of our value chain
- Yes, only within our direct operations
- Yes, only in our value chain beyond our direct operations
- No
Requested content
General
- Indicate if you have identified any inherent water-related risks, and in which part of your value chain; or select ‘No’ if none have been identified and explain why not (W4.2b and/or W4.2c will be presented).
- For the purposes of this response, the risks considered should only be those which:
- pose potential substantive financial or strategic impacts (as per the definition of “substantive” you provide in W4.1a)
- pose a risk at the corporate level, and not simply at the asset/business unit/geographic level at which they may occur
- are inherent (the risk that exists in the absence of controls, i.e. before taking into account any potential mitigation or management measures that have been or could be implemented).
- These risks may have the potential to impact on your organization either currently or in the future.
Explanation of terms
- Direct operations: An organization’s operations include anything it does itself for the purpose of producing goods and services and maintaining the functionality of the business. This covers any internal supply chains between the organization’s business units. For example, a business unit within a company that supplies components to another business unit within the company would be considered part of the organization’s direct operations.
- Inherent risk: The risk that exists in the absence of controls, i.e. not taking into account any potential mitigation or management measures that could be implemented.
- Residual risk: The risk remaining after a specific action has been taken to manage the risk.
- Substantive impact: An impact that has a considerable or relatively significant effect on an organization at the corporate level. This could include operational, financial or strategic effects that undermine the entire business or part of a business.
- Value chain: The entire sequence of activities or partners that provide value to or receive value from an organization’s products and services, either within, upstream or downstream of direct operations.
- Water-related risk: The possibility of an organization experiencing a water-related challenge (e.g., water scarcity, water stress, flooding, infrastructure decay, drought) (adapted from the CEO Water Mandate's "Corporate Water Disclosure Guidelines"). The extent of risk is a function of the likelihood of a specific challenge occurring and the severity of the challenge’s impact. The severity of impact depends on the intensity of the challenge, as well as the vulnerability of the organisation.
(W4.1a) How does your organization define substantive financial or strategic impact on your business?
Change from 2019
No change
Rationale
Explaining your threshold for including risk data in this disclosure provides critical context for CDP data users. What is considered as a substantive impact for a business will be different for each responding company, so before proceeding with any further questions in this module, it is important that companies explain how they define a substantive impact at the corporate level.
Response options
This is an open text question with a limit of 5,000 characters.
Requested content
General
- Describe and quantify, in detail, how your organization defines a ‘substantive impact’ on your business at the corporate level, in the context of a water-related risk.
- What constitutes a substantive impact will vary between companies. For example, a 1% reduction in profits could have a different effect on different companies depending on their respective profit margins. Companies are therefore asked to determine ‘substantive’ in the way that they would use for their business decision-making. For example, a substantive impact of relatively high magnitude could occur because of a large number for any one of the following aspects, or because of a small number for all three combines to create a larger impact:
- the proportion of business units affected
- the size of the impact on those business units
- the dependency of the organization on that unit
- the potential for shareholder or customer concern.
- The description of your definition should make clear the thresholds for:
- the magnitude
- probability
- frequency of the impact
- and how they are applied together.
- Include details of any metrics used and report how often these metrics are reviewed and updated.
- The substantive change may relate, for example, to operations, revenue or expenditure, assets & liabilities, or capital allocation. Examples of substantive change would be: the closure of two strategic facilities for which the probability is over 30%; a reduction of 10% in projected revenue; an unexpected prolonged drop in consumer interest over a busy shopping period.
- Indicate if your definition/thresholds/metrics relate to direct operations and/or other parts of your value chain.
- Note that in this question, we are not requesting:
- information about what is a substantive impact at the level of facilities, business units, etc; only about what is substantive for the company as a whole
- details of the risks your organization is exposed to, but to illustrate your response you should include at least one example of an impact at any level of your organization and why it is considered as substantive to your business.
Explanation of terms
- Substantive impact: an impact that has a considerable or relatively significant effect on an organization at the corporate level. This could include operational, financial or strategic effects that undermine the entire business or part of the business.
(W4.1b) What is the total number of facilities exposed to water risks with the potential to have a substantive financial or strategic impact on your business, and what proportion of your company-wide facilities does this represent?
Question dependencies
- This question only appears if you select any of the following options in response to W4.1:
- Yes, both in direct operations and the rest of value chain
- Yes, only within our direct operations
- Yes, only in our value chain beyond our direct operations
Change from 2019
No change
Rationale
Water is a local issue, and CDP data users want to know that companies are considering risks and impacts at the facility level. Reporting on the total number of facilities that expose your company to substantive risk and the proportion of your facilities that this represents provides a basic but useful indication of risk exposure.
Connection to other frameworks
CEO Water Mandate
Implications: Business risks
Response options
Please complete the following table:
| Total number of facilities exposed to water risk
|
% company-wide facilities this represents
|
Comment
|
|
Numerical field [enter a number from 0-1,000 using no decimals
or commas]
|
Select from:
- Less than 1%
- 1-25
- 26-50
- 51-75
- 76-99
- 100%
- Unknown
|
Text field [maximum 4,500]
|
Requested content
General
- This question only requests information about facilities exposed to risks with the potential to substantively impact your business at the corporate level (as defined in W4.1a). Do not count local risks unless they are substantive for the organization as a whole.
- Note that you are requested to disclose inherent risks – so include those that your organization is exposed to prior to the implementation of any response strategies.
- For the facilities you report here as being exposed to substantive water risk, W4.1c requests their river basin location.
Total number of facilities exposed to water risk (column 1)
- Defining facility: The term ‘facilities’ may be used broadly to refer to types of business operations as well as fixed buildings or factories. For example, organizations in the extractive industries might normally collate information by asset or business unit and may wish to define facility in this way.
- Aggregating facilities: Organizations may have hundreds of sites, such as in the hotel, construction, or retail industries. They may wish to report facilities by aggregate, rather than individual buildings or sites. For example, a hotel chain may wish to group hotels by grade or resort type. Rather than assessing each of its 20 hotels individually it may be more appropriate to combine 20 hotels within the same river basin into one ‘facility’, and then assessing this against its threshold for substantive change to the business described in W4.1a.
- Note the following on the aggregation of facilities:
- Due to the local nature of water risks and impacts, only facilities in the same river basin and the same jurisdiction may be aggregated. In the case of very large river basins, facilities in a single basin may face different regulatory as well as local physical risks so that aggregation would obscure an understanding of the organization's water dependency and risk exposure in the region.
- Organizations should consider aggregating facilities within a river basin if the corporate-level risk exposure due to a single local facility is not substantive but would be substantive in aggregate with other similar local facilities; for example, where water use in individual facilities is very small and therefore associated risks and impacts are more material at the river basin level, but is significant within the river basin as a whole.
- Aggregation of facilities should not be used where information on the risk exposure, or water accounting data, of the single facility would be meaningful and specific to that facility.
- There is a limit of 1,000 on the total number of facilities that you may report as being at risk. This is because you should only count facilities, or groups of facilities, that expose your organization to substantive risk - according to your definition in W4.1a. If you have more than 1,000 it may be that your definition of substantive risk in question W4.1a is extreme. You should consider aggregating some facilities in line with the above note and use the 'Comment' column to describe the aggregation.
% company-wide facilities this represents (column 2)
- Detail the proportion of your organization’s company-wide facilities exposed to substantive water risk - as represented by the number given in column 1. For example, the 11 facilities that are exposed to substantive water risk reported in column 1 may comprise 26-50% of your organization’s total facilities company-wide. You may estimate this data and use column 3 to state that this is the case.
- If you cannot provide this figure, select “unknown” and explain your response in column 3.
Comment (column 3) (optional)
- You may comment on how you have defined ‘facility’. If your organization does aggregate for reporting purposes, please state that this approach has been taken and briefly describe the methodology for aggregation.
- To help data users understand the number of facilities you have reported, please provide any further context. For example, you may wish to give a general, company-specific comment on the nature, severity and location of the corporate-level risks your company is exposed to, whether they result from any particular business activity, and the relationship between the inherent risk and your residual risk exposure. You may have reported that 60% of your facilities are exposed to inherent risks due to their location, but this represents only a 30% of your total output and the residual risk has been much reduced due to the introduction of new controls. It is helpful to data-users if you give company-specific information.
- Note that river basin level information about facilities at risk should be disclosed in W4.1c.
Explanation of terms
- Facility: “Facilities” may be used throughout this questionnaire as a broad term and not restricted to a particular site or grouping of fixed buildings and factories. For example, if your organization is in the extractive industries you might normally collate business information for assets or business units, and so you may wish to define ‘facility’ information in this way.
- Inherent risk: The risk that exists in the absence of controls, i.e. not taking into account any potential mitigation or management measures that could be implemented.
- Residual risk: The risk remaining after a specific action has been taken to manage the risk.
Example response
| Total number of facilities exposed to water risk
|
% company-wide facilities this represents
|
Comment
|
|
7
|
1-25
|
7/35 of our sites, representing 13% of global production,
have been identified as being exposed to substantive water risk. These
facilities are within a region of water stress. They specialize in producing an
important component linked to our technology hardware business unit due to
close links with suppliers of necessary raw materials. We classified all
our substantive risk sites using WRI’s
Aqueduct.
The facilities included here (detailed further in W5) are
the facilities that pose the biggest financial/strategic risk of impact to our
organization based on the definition we have given in W4.1a. We set a 7.5%
threshold of national production as a proxy for revenue given a full year of
lost production.
Note that for the purpose of reporting, our definition of
‘facility’ is the same as our definition for a site i.e. for which there could
be several different types of factory operating in the same location.
|
(W4.1c) By river basin, what is the number and proportion of facilities exposed to water risks that could have a substantive financial or strategic impact on your business, and what is the potential business impact associated with those facilities?
Question Dependencies
- This question only appears if you select any of the following options in response to W4.1:
- Yes, both in direct operations and the rest of our value chain
- Yes, only within our direct operations
- Yes, only in our value chain beyond our direct operations
- Note that W5 will request water accounting data for facilities located in the basins reported here.
Change from 2019
Minor change, Additional guidance
Rationale
This information provides a list of hot-spot basins for CDP data users to focus on when reviewing your CDP disclosure and enables a deeper understanding of the potential significance of the water risk exposure associated with each basin.
Knowing the percentage of facilities at risk for each basin and the potential impact of this risk exposure helps companies with decision making based on basin level issues. It allows financial planning at that level to take account of water issues and provides a powerful indicator to support river basin action and investment.
Assigning and understanding the amount of financial productivity that may be at risk from water-related issues in any one basin provides a powerful indicator for any business case for investment in those basins, and the potential significance of the water risk exposure associated with that basin.
Connection to other frameworks
CEO Water Mandate
Implications: Business risks
Response options
Please complete the following table. The table is displayed over several rows for readability. You are able to add rows by using the “Add Row” button at the bottom of the table.
|
Country/Area
|
River basin
|
Number of facilities exposed to water risk
|
% company-wide facilities this represents
|
|
Select from:
- Country/area drop-down list
|
Select from:
- River basin drop-down list
- Not known
- Other, please specify
|
Numerical field [enter a number from 0-1,000 using no decimals
or commas]
|
Select from:
- Less than 1%
- 1-25
- 26-50
- 51-75
- 76-99
- 100%
- Unknown
|
[METALS & MINING SECTOR ONLY]
Production value for the metals & mining activities associated with these facilities
| [ELECTRIC UTILITIES SECTOR ONLY]
% company’s annual electricity generation that could be affected by these facilities
| [OIL & GAS SECTOR ONLY]
% company’s global oil & gas production volume that could be affected by these facilities
| % company’s total global revenue that could be affected
| Comment
|
|---|
Numerical field [enter a number from 0-999,999,999,999 using a
maximum of 2 decimal places]
| Select from: - Less than 1%
- 1-25
- 26-50
- 51-75
- 76-99
- 100%
- Unknown
- Not applicable
| Select from: - Less than 1%
- 1-25
- 26-50
- 51-75
- 76-99
- 100%
- Unknown
- Not applicable
| Select from:
- Less than 1%
- 1-10
- 11-20
- 21-30
- 31-40
- 41-50
- 51-60
- 61-70
- 71-80
- 81-90
- 91-99
- 100%
- Unknown
| Text field [maximum 5,000 characters]
|
[Add Row]
Requested content
- Note: Organizations responding to a metals & mining sector request should refer to additional sector-specific guidance on this question at the end of the "Requested content" section.
General
- Consider risks with the potential to substantively impact your business at the corporate level. Do not consider local risks unless they are substantive for the organization as a whole. For example, a business may have 10 facilities in one river basin exposed to water risk, but only three of those might lead to a substantive impact to the business at the corporate level should they materialize. So, it is only those three facilities that should be reported.
- Note that you are requested to disclose inherent risk – so consider risks those that your facilities are exposed to prior to the implementation of any response strategies.
- Module 5 requests water accounting information for all the ‘facilities’ you disclose here as being exposed to substantive water risk.
- If you have facilities exposed to water risks in a basin which covers multiple countries, please add a new row for each country/region and disclose the number of facilities located in that country.
- Note that W4.2 and W4.2a ask for details of individual risk drivers, their impact and your response, so any information provided here should relate to the basin level.
- Oil & gas sector only: Data on the organization's production volume associated with these facilities will provide further information on the potential implications of the water risk exposure and assist with the assessment of the company's response.
- Electric utilities sector only: Data on the organization's annual electricity generation associated with these facilities will provide further information on the potential implications of the water risk exposure and assist with the assessment of the company's response.
Country/Area (column 1)
- Note that a selection must be made for both column 1 and column 2. Your data will not be saved if either column is left blank.
River basin (column 2)
- From the drop-down options provided, select the river basin where your facilities are exposed to substantive water risk. If you do not see a basin that applies to your organization, select “Other, please specify” and write in the correct river basin using the text box provided.
- For companies withdrawing water from large confined aquifers that may not discharge to the river basin they are located in e.g. Ogallala aquifer in the United States, please select “Other, please specify” and type in the name of the local aquifer source. Ensure that the correct country/area name is selected in column 1 (Country/Area).
- You may want to put the sub-basin of a bigger river basin identified in the drop-down menu. In this case use the “Other, please specify” option in the following format: “Putumayo, Amazon”.
- For full instructions regarding this list, see the Introduction to CDP's water security reporting guidance.
- Note that a selection must be made for both column 1 and column 2. Your data will not be saved if either column is left blank.
Number of facilities exposed to water risk (column 3)
- For the selected river basin, indicate the number of facilities exposing your company to a potential substantive impact. This number will have been included in the total figure you reported in W4.1b. We are not asking for the total number of facilities located within each river basin, only those facilities facing a water risk that could generate a substantive change in your business, operations, revenue or expenditure. A business may have 10 facilities in one river basin exposed to water risk. However, if just three of them might lead to a substantive impact to the business at the corporate level, it is only those three facilities that should be reported here.
- The term ‘facilities’ may be used broadly to describe different types of business operations as well as fixed buildings or factories. Please refer to the guidance for W4.1b.
- If you aggregated facilities in W4.1b when providing the total number of facilities that expose your organization to risk, you should apply that identical aggregation in this question so that the total number of facilities entered in column 3 equals the figure you provided in W4.1b and does not exceed 1,000.
- Note that W5.1 will request water accounting and other data for up to 50 facilities reported here.
% company-wide facilities this represents (column 4)
- This column asks for the proportion of your total company facilities represented by the facilities reported in column 3. For example, the 11 facilities reported in column 3 may comprise 6-10% of your organization’s total number of facilities globally.
- If you cannot provide this figure, select “unknown” and explain your response in the last column (Comment).
Electric utilities sector only: % company's annual electricity generation that could be affected by these facilities
- Only select "Not applicable" if no facilities in the basin generate electricity and explain this in the last column (Comment).
Oil & gas sector only: % company's global oil & gas production volume that could be affected by these facilities
- Only select "Not applicable" if no facilities in the basin are associated with your oil & gas sector activities and explain this in the last column (Comment).
% of company’s total global revenue
- This column seeks to answer the question: what proportion of your organization’s total global revenue is derived from the facilities listed in column 3? For example, 11 facilities reported in column 3 may deliver 16-30% of your organization’s total global revenue.
- This revenue may be at risk to some extent in the absence of an appropriate response strategy - if the facilities were unable to operate, for example.
- If you cannot provide this figure, please select “unknown”, or you may estimate the figure. Use the last column (Comment) to explain your response.
Comment (optional)
- Provide any further context to help data users understand your basin level disclosure. For example, you may wish to comment on the nature or severity of the risk in the river basin as a whole that these facilities are exposed to and the company’s approach to addressing these risks.
- Provide any further details you wish to add about the figure you have provided for the potential value at risk in these river basins. This will provide context for data-users.
- If you have used estimates in any response, please state this.
Sector-specific guidance for metals & mining sector
General
- This guidance is specific to companies responding to a metals & mining sector request. You should first read the guidance for this question that applies to all companies. This is additional to the general guidance and does not replace it.
- Data on the production value associated with these facilities will provide further information on the potential implications of the water risk exposure and assist with the assessment of the company’s response.
Production value for the metals & mining activities associated with these facilities
- For this information, consider the production value potentially exposed to inherent water-related risks in the river basin selected in column 2 (in the absence of an appropriate response strategy and if the facilities were unable to operate, for example)
- Provide a financial figure associated with the facilities at risk reported. This figure should be in the same currency that you selected for all financial information disclosed throughout your response in question W0.4.
- You may report '0' in this column if the facility at risk does not belong to the metals & mining sector and explain this in the last column (Comment).
- If the figure provided belongs to a facility not yet operational you may report '0' as this is the current production value, or you may provide the expected annual production value linked to this facility and explain either choice in the last column (Comment).
- In column 7, please explain the approach you have taken in reporting production value.
- If you cannot provide this figure, please leave this field blank and explain why in the last column (Comment).
Comment (optional)
- Please explain the approach you have taken in reporting production value. Provide details that will offer further clarification to data users on the value disclosed.
- If you are unable to provide the information of the production value for the metals & mining activities associated with these facilities, i.e. for reasons of anti-competition laws or any other legislative requirement, you may indicate this here.
Explanation of terms
- Revenue: Income arising in the course of an entity's ordinary activities (less discounts, allowances and returns) - before deducting costs for the goods/services sold and operating expenses to arrive at profit (based on the International Financial Reporting Standard).
Water-related risks and response
(W4.2) Provide details of identified risks in your direct operations with the potential to have a substantive financial or strategic impact on your business, and your response to those risks.
Question Dependencies
- This question only appears if you select one of the following options in response to W4.1:
- Yes, both in direct operations and the rest of our value chain
- Yes, only within our direct operations
Change from 2019
Minor change
Rationale
Your response to this question will allow CDP data users to see, in one place, details of the inherent water risks that your company is exposed to due to drivers associated with its direct operations within particular river basins, and also the estimated potential impact of the risk at the corporate level and your response strategy to address the risk.
Connection to other frameworks
CEO Water Mandate
Implications: Business risks
Response options
Please complete the following table. The table is displayed over several rows for readability. You are able to add rows to this table using the "Add row" button at the bottom of the table.
| Country/Area |
River basin
|
Type of risk
|
Primary risk driver
|
Primary potential impact
|
Company-specific description
|
Timeframe
|
|
Select from:
- Country/area drop-down list
|
Select from:
- River basin drop-down list
- Not known
- Other, please specify
|
Select from:
- Physical
- Regulatory
- Reputation & markets
- Technology
|
Select from:
- Response drop-down options below table
|
Select from:
- Response drop-down options below table
|
Text field [maximum 2,500 characters]
|
Select from:
- Current up to one year
- 1-3 years
- 4-6 years
- More than 6 years
- Unknown
|
| Magnitude of potential impact | Likelihood | Are you able to provide a potential financial impact figure? | Potential financial impact figure (currency) | Potential financial impact figure - minimum (currency) | Potential financial impact figure - maximum (currency) |
|---|
Select from:
- High
- Medium-high
- Medium
- Medium-low
- Low
- Unknown
| Select from:
- Virtually certain
- Very likely
- Likely
- More likely than not
- About as likely as not
- Unlikely
- Very unlikely
- Exceptionally unlikely
- Unknown
| Select from:
- Yes, a single figure estimate
- Yes, an estimated range
- No, we do not have this figure
| Numerical field [enter a number from 0-999,999,999,999,999 using a
maximum of 2 decimal places]
| Numerical field [enter a number from 0-999,999,999,999,999 using a maximum of 2 decimal places]
| Numerical field [enter a number from 0-999,999,999,999,999 using a maximum of 2 decimal places]
|
| Explanation of financial impact | Primary response to risk | Description of response | Cost of response | Explanation of cost of response |
|---|
Text field [maximum 2,500 characters]
| Select from:
- Response drop-down options below table
| Text field [maximum 2,500 characters]
| Numerical field [enter a number from 0-999,999,999,999,999 using a
maximum of 2 decimal places]
| Text field [maximum 2,500 characters]
|
[Add Row]
Primary risk driver (column 4)
Physical
- Declining water quality
- Dependency on water intensive energy sources
- Drought
- Ecosystem vulnerability
- Flooding
- Inadequate infrastructure
- Increased levels of plastic in fresh water bodies
- Increased water scarcity
- Increased water stress
- Pollution incident
- Poorly managed sanitation
- Rationing of municipal water supply
- Seasonal supply variability/inter annual variability
- Severe weather events
- Change in land-use
- Soil degradation (food, beverage & tobacco sector only)
- Pollution of water bodies due to fertilizer, other chemical use, or animal residues (food, beverage & tobacco sector)
- Acid rock drainage and metal leaching (metals & mining sector only)
- Leaching of pollutants to groundwater bodies (metals & mining sector only)
- Rupture of tailings dams and toxic spills (metals & mining sector only)
- Other, please specify
Regulatory
- Changed product standards
- Higher water prices
- Increased difficulty in obtaining withdrawals/operations permit
- Lack of transparency of water rights
- Limited or no river basin/catchment management
- Mandatory water efficiency, conservation, recycling or process standards
- Poor coordination between regulatory bodies
- Poor enforcement of water regulation
- Tighter regulatory standards
- Regulation of discharge quality/volumes
- Regulatory uncertainty
- Statutory water withdrawal limits/changes to water allocation
- Other, please specify
|
Reputation & markets
- Changes in consumer behavior
- Community opposition
- Inadequate access to water, sanitation, and hygiene services
- Increased stakeholder concern or negative stakeholder feedback
- Water-related litigation
- Negative media coverage
- Other, please specify
Technology
- Data access/availability
- Substitution of existing products with lower water impact options
- Transition to bio-based chemicals (chemicals sector only)
- Transition to water efficient and low water intensity technologies and products
- Transition to water intensive, low carbon energy sources
- Unsuccessful investment in new technologies
- Other, please specify
|
Primary potential impact (column 5)
- Brand damage
- Changing revenue mix and sources
- Constraint to growth
- Closure of operations
- Diminished ability to reduce GHG emissions
- Disruption to sales
- Fines, penalties or enforcement orders
- Impact on company assets
- Disruption to workforce management and planning
- Increased insurance premiums
- Increased cost of capital
- Increased compliance costs
|
- Increased operating costs
- Increased production costs
- Litigation
- Loss of license to operate
- Reduction or disruption in production capacity
- Reduced demand for products and services
- Reduction in capital availability
- Reduced revenues from lower sales/output
- Upfront costs to adopt/deploy new practices and processes
- Supply chain disruption
- Mine closure (metals & mining sector only)
- Other, please specify
|
Primary response to risk (column 15)
- Adopt water efficiency, water reuse, recycling and conservation practices
- Amend the Business Continuity Plan
- Comply with local regulatory requirements
- Develop drought emergency plans
- Develop flood emergency plans
- Develop new products and/or markets
- Engage with local communities
- Engage with NGOs/special interest groups
- Engage with customers
- Engage with suppliers
- Engage with regulators/policymakers
- Establish site-specific targets
- Greater due diligence
- Implement internal pricing on water
- Implement nature-based solutions
- Improve alignment of our public policy influencing activity with our water stewardship commitments
- Improve maintenance of infrastructure
- Improve monitoring
- Improve pollution abatement and control measures
- Increase capital expenditure
- Increase geographic diversity of facilities
- Increase insurance coverage
- Increase investment in new technology
- Increase supplier diversification
|
- Introduce/strengthen water management incentives
- Purchase water quality credits
- Re-site facilities
- Secure alternative water supply
- Support river basin restoration
- Tighten supplier performance standards
- Use risk transfer instruments
- Utilize aquifer storage to accrue recharge credits
- Adopt alternative crop management strategies to reduce fertilizer and pesticide use (food, beverage & tobacco sector only)
- Adopt alternative livestock management practices (food, beverage & tobacco sector only)
- Adopt alternative livestock management practices to reduce use of veterinary products (food, beverage & tobacco sector only)
- Adopt better animal waste management practices (food, beverage & tobacco sector only)
- Adopt efficient fertilizer and pesticide management (food, beverage & tobacco sector only)
- Adopt soil conservation practices (food, beverage & tobacco sector only)
- Adopt sustainable irrigation practices (food, beverage & tobacco sector only)
- Reduce food waste throughout the value chain (food, beverage & tobacco sector only)
- Use drought resistant crop varieties (food, beverage & tobacco sector only)
- Other, please specify
|
Requested content
General
- This question asks about water-related risk drivers associated with your direct operations and their potential to substantively impact your organization, currently or in the future. (W4.2a asks about risk drivers in the rest of your value chain and their potential impact on your organization).
- For the purposes of this response, the risks reported should only be those which:
- Expose your organization to substantive financial or strategic impacts to your business - such as to operations, revenue, or expenditure, assets and liabilities, or capital allocation (as per the definition of ‘substantive’ you provide in W4.1a);
- Pose a risk at the corporate level, and not simply at the asset/business unit/geographic level at which they may occur;
- Are inherent (a risk that exists in the absence of controls, so not taking into account any potential mitigation or management measures that have been or could be implemented).
- Use each row to report a primary risk driver and the potential substantive impact it could cause. If there is more than one impact, please select the primary impact. If there is more than one response to this risk, select the primary response.
- To report additional risk drivers or impacts associated with a basin, you are able to add a new row. Please report no more than 3 risk drivers or impacts per river basin and report the most substantive.
Country/Area (column 1)
- From the drop-down menu provided, please select the country/area associated with the driver of the risk you are reporting.
- Note that a selection must be made for both column 1 and column 2. Your data will not be saved if either column is left blank.
River basin (column 2)
- From the drop-down menu provided, please select the river basin associated with the driver of the risk you are reporting. If you select “Other, please specify”, provide a label for the river basin.
- For companies withdrawing water from large confined aquifers that may not discharge to the river basin they are located in e.g. Ogallala aquifer in the United States, please select “Other, please specify” and type in the name of the local aquifer source. Ensure that the correct country/area name is selected in column 1 (Country/Area).
- You may want to report the sub-basin for a main river basin that is listed. In this case select “Other, please specify” and use the following format: “Putumayo, Amazon”.
- Refer to the instructions in the Introduction to CDP’s water security reporting guidance for more details on how to response to ‘River basin’ columns.
- Note that a selection must be made for both column 1 and column 2. Your data will not be saved if either column is left blank.
Type of risk (column 3)
- Select the type of risk you would like to report. Your selection will determine the list of risk drivers that will appear in column 4.
- Note that a selection must be made for both column 3 and column 4. Your data will not be saved if either column is left blank.
Primary risk driver (column 4)
- The drop-down options presented are linked to the type of risk you selected in column 3.
- In the case that there may be more than one driver or a chain of causes for the potential substantive impact you are reporting, you should select what you consider to be the primary driver.
- If you do want to choose an additional driver for a river basin, you will need to add another row to report the details. Please refrain from providing more than three drivers per river basin.
- If you select “Other, please specify”, provide a label for the primary risk driver.
- Note that a selection must be made for both column 3 and column 4. Your data will not be saved if either column is left blank.
Primary potential impact (column 5)
- Select the option that best describes the primary potential impact to your company due to the risk driver reported in column 4.
- The impact must be substantive at the corporate level as defined in W4.1a.
- If there is more than one potential impact associated with a risk driver, you should select what you consider to be the primary impact and use column 6 to describe the secondary impacts. This could, for example, be increased costs, decreased revenue, or closure of operations. Impacts can be operational or financial and can affect your organization, your consumers or other stakeholders as well as your company.
- If you do want to choose an additional substantive impact for a river basin or a risk driver, you will need to add another row to report the details. Please refrain from providing more than three impacts per river basin.
- If you select “Other, please specify”, provide a label for the type of potential impact.
Company-specific description (column 6)
- Provide further contextual information on the risk driver selected in column 4, including more detail on its nature and location.
- Include a company-specific description of how the risk driver could impact your organization, including the nature of any secondary impacts. For example: “Our organization has found the increased seasonal water stress in the Limpopo river basin to be a risk with the potential to constrain planned growth in steel production in the region. More immediately, this could lead to periodic suspensions of operations and a substantial financial impact equating to $100,000 a day. Any major delays in production would hinder our ability to meet our contractual agreements with customers and importantly our ability to win new business”.
Timeframe (column 7)
- Select the timeframe in which the inherent risks would be most likely to materialize. It is acknowledged that there is likely to be a higher degree of uncertainty associated with long-term risks. For example, you may consider you company to be at risk due to increasing pollution levels but this is unlikely to impact your business within the next 5 years. In this case you would select ‘4-6 years’.
Magnitude of potential impact (column 8)
- The magnitude describes the extent to which the impact, if it occurred, would affect your business. You should consider the business as a whole. This means that the potential magnitude of the impact can be a combination of the scale of the damage and your organization’s state of resilience prior to responding to the risk.
- Magnitude of impact will vary from company to company. For example:
- Two companies may have identical facilities located on a coast in an area which is vulnerable to flooding. However, if company A relies on that facility for 90% of its production capacity and company B relies on it for only 40% of its production capacity, the magnitude of impact due to the same flooding damage will be comparatively higher on company A than on company B;
- A 1% reduction in profits will have different effects on different companies depending on the profit margins on which they work.
- As it is not possible for CDP to accurately define terms for magnitude of impact, companies are asked to determine and report magnitude using a qualitative 5 point scale from High to Low. Factors to consider when classifying the magnitude of the impact on your organization include:
- The proportion of business units affected;
- The size of the impact on those business units;
- The dependency of the company on those units;
- The potential for shareholder or customer concern.
- An impact could have a relatively high magnitude for the company as a whole because of a large effect in one of these aspects or small effects in all four combining to create a larger impact.
- The magnitude should align with the proportion of global revenue at risk you reported in W4.1c for the river basin associated with the impact (selected in column 2). For example, if 50% of global revenue could be affected by water risk in the Yellow River basin then the magnitude for a risk reported in the Yellow River basin should align.
- If the financial impact has not been assessed by your organization, please select ‘Unknown’.
Likelihood (column 9)
- Likelihood refers to the probability of the inherent impact occurring within the time frame reported in column 7. In the case of an inherent risk, the probability of the impact might be similar to the probability of the risk event (the risk driver) itself.
- Likelihood along with the magnitude are the building blocks for quantifying and prioritizing risk.
- The terms used to describe likelihood are taken from the Intergovernmental Panel on Climate Change’s (IPCC) 2013 report and are consistent across all CDP information requests.
- As a guide to quantifying likelihood on a % basis, we suggest:
- Virtually certain (greater than 99% probability);
- Very likely (greater than 90% probability);
- Likely (greater than 66% probability);
- More likely than not (greater than 50% probability);
- About as likely as not (between 33% and 66% probability);
- Unlikely (less than 33% probability);
- Very unlikely (less than 10%);
- Exceptionally unlikely (less than 1% probability);
- Unknown.
- For example, you may consider your company to be potentially exposed to a risk of water rationing in the next ‘4-6 years’ which would cause an impact of high magnitude - but the risk is not considered very likely to materialize. You would select ‘unlikely’. Alternatively, if the risk related to a piece of new legislation which has already been prepared in draft form, the likelihood of the impact associated with that risk occurring will be relatively high and you would select ‘very likely’.
Are you able to provide a potential financial impact figure? (column 10)
- Your selection will determine whether column 11 or columns 12 and 13 will be presented.
- It is acknowledged that these figures will be estimates.
- If you are unable to provide a figure for a financial impact, you may use column 14 (‘Explanation of financial impact’) to provide a description of the impact in relative terms; for example, as a percentage relative to a stated or publicly available figure, or give a qualitative estimate of the financial impact.
Potential financial impact figure (currency) (column 11)
- Provide a single figure for the inherent financial impact of the risk (before taking into consideration any controls you may have in place to mitigate the impacts). This figure should be in the same currency that you selected in question W0.4 for all financial information disclosed throughout your response.
- An example would be the value of stranded assets or the value lost due to halted production (before taking into consideration any insurance coverage that might compensate you).
Potential financial impact figure - minimum/maximum (currency) (columns 12, 13)
- Provide the estimated range for the inherent financial impact (before taking into consideration any controls you may have in place to mitigate the impact).This figure should be in the same currency that you selected in question W0.4 for all financial information disclosed throughout your response.
- Potential financial impact figure - minimum (currency) use this field to report the lower point of your estimated financial impact associate with the risk. For example, if the range is from US $5,000 to $50,000, ‘5,000’ should be reported here.
- Potential financial impact figure - maximum (currency) use this field to report the upper point of your estimated financial impact associate with the risk. For example, if the range is from US $5,000 to $50,000, ‘50,000’ should be reported here.
Explanation of financial impact (column 14)
- Use this field to explain the figure(s) provided in 'Potential financial impact' (columns, 10, 11, 12).
- Describe how you arrived at this figure (or range), including:
- What approach was employed to calculate the figure;
- Any assumptions the figure is dependent on;
- The likely timescale for the financial impact.
- If 'We do not have this figure' was selected in column 10, use this column to provide a description of the financial impact in the relative terms (for example as a percentage relative to a stated or publicly available figure) or give a qualitative estimate of the financial impact. Otherwise, if you have no information about the financial impact, please state “The impact has not been quantified financially”.
Primary response to risk (column 15)
- Select the response strategy that most closely describes how your organization expects to respond to the reported risk. If there is no appropriate response strategy for your organization included in the list, please select “Other, please specify” and add your own response label.
- If you select “Other, please specify”, provide a label for the primary response to risk.
Description of response (column 16)
- Provide additional details of your organization’s response to mitigate, control, transfer or accept the risk associated with the driver reported in this row. You may include any secondary response strategies.
- Include the timeframe expected for the response strategy to be implemented. Is the response underway, not yet implemented, or completed? What is the projected progress for lowering risidual risk?
- Describe the difference the response has made/is likely to make. This may include:
- How effective the response has been/is expected to be in preventing the inherent risk driver reoccurring, or for improving your organization’s resilience at the asset or corporate level, so preventing future financial, operational or strategic impacts;
- Whether water security for your company is likely to improve as a result, at either the asset or corporate level;
- Whether water security for other users is likely to improve as a result;
- Whether the response contributes to the progress of other UN Sustainable Development Goals;
- Whether the response strategy involves any collective action initiatives.
- Report whether the response strategy involves any collective action initiatives, or if it contributes to the progress of a UN Sustainable Development Goal.
- For those who indicate in W11.2 that they would be interested in having their public response data transferred to the Water Action Hub, we ask that you provide as much information about your response as possible, particularly local projects, including:
- Who else is involved in the joint project /initiative (such as names of organizations or government offices) or who you would like to work with (government agencies, other companies, NGOs, etc.);
- The geographic or other scale of the project;
- What the project seeks to accomplish including expected benefits for the watershed beyond the company;
- When the project started and if it has concluded or if it is continuing;
- If possible, the specific location of the project.
Note that these criteria are not scored but are crucial to building a project for the Water Action Hub and without this detail the project may not be suitable to transfer to this platform.
Cost of response (column 17)
- Provide a quantitative figure for the cost of your risk response actions. If there are no costs to responding to the risk, enter '0'. If the value you have reported is an estimate, please state this in column 18 (Explanation of cost of response).
- If you cannot provide an absolute value, you may use column 18 to provide a percentage value.
- This figure should be in the same currency that you selected for all financial information disclosed throughout your response in question W0.4.
Explanation of cost of response (column 18)
- Use this field to explain the figure provided in column 17. Please describe how you derived this figure, including:
- What approach was taken to arriving at the cost of your response strategy;
- If it is an estimate;
- Any assumptions the figure is dependent on;
- The likely timescale for the cost of response.
- In case no figure is provided in column 17, provide a description of the cost in relative terms or give a qualitative estimate of the cost of the response. Otherwise, if you have no information about the financial impact, please write “cost of response not quantified at corporate level".
Explanation of terms
- Direct operations: An organization’s operations include anything it does itself for the purpose of producing goods and services and maintaining the functionality of the business. This covers any internal supply chains between the organization’s business units. For example, a business unit within a company that supplies components to another business unit within the company would be considered part of the organization’s direct operations.
- Inherent risk: The risk that exists in the absence of controls, i.e. not taking into account any potential mitigation or management measures that could be implemented.
- Physical risk: Risk driven by water stress or scarcity (too little water), flooding (too much water) or pollution (lower water quality). Disruption in water supply or decline in water quality can adversely affect operations where water is used for production, irrigation, material processing, cooling, washing and cleaning, and personal consumption. Physical risks can adversely affect production or cause damage to physical assets.
- Note that weather events such as snow, or physical events such as high tide or earthquakes, are not a water risks in themselves but may cause water risks. If snow or earthquakes cause flooding, then it is the flooding that is the water risk and should be reported as such. However, snow, high tide and earthquakes could be considered water risks if they could cause predictable disruption to water supply or have groundwater impacts. For example, if heavy snow on property is common it could cause pollution release incidents when it melts if not managed properly.
- Regulatory risk: Risks driven by an expected or unexpected change or uncertainty, in law or regulation that may have direct or indirect impacts on a company. A change in law or regulation can increase the costs of operating a business, reduce the attractiveness of an investment, or change the competitive landscape in which a company operates. Water regulatory measures may include, among others, new water permit structures, rate changes to control withdrawals and discharge, redistribution of water to various users, and restrictions on pollutant types and levels.
- Reputational risk: Risk driven by litigation, product risks due to changes in consumer behavior, and risks that may impact decisions made by investors, consumers and current/potential employees concerning a company.
- Residual risk: The risk remaining after a specific action has been taken to manage the risk.
- Risk driver: The factor/ driving force that could cause the potential impact. Risk drivers are typically physical (e.g. weather extreme events), regulatory, reputational and markets related, or technological.
- Technological risk: Risk driven by technological improvements or innovations; for example, those that support water security or the transition to a lower-carbon, energy-efficient economic system.
- Water scarcity: Refers to the volumetric abundance, or lack thereof, of freshwater resources. Scarcity is human driven; it is a function of the volume of human water consumption relative to the volume of water resources in a given area. As such, an arid region with very little water, but no human water consumption would not be considered scarce, but rather “arid.” Water scarcity is a physical, objective reality that can be measured consistently across regions and over time. Water scarcity reflects the physical abundance of freshwater rather than whether that water is suitable for use. For instance, a region may have abundant water resources (and thus not be considered water scarce), but have such severe pollution that those supplies are unfit for human or ecological uses.
Explanation of terms for chemical sector
- Bio-based chemicals (Chemical sector only) : Bio-based products are wholly or partly derived from materials of biological origin, excluding materials embedded in geological formations and/or fossilized.
Explanation of terms for food, beverage & tobacco sector
- Alternative crop management strategies to reduce fertilizer and pesticide use (Food, beverage & tobacco sector only): Practices that aim to reduce the need for fertilizer or pesticide applications or that lead to greater efficiency in their application i.e. crop rotations, cover cropping, intercropping, etc.
- Alternative livestock management practices (Food, beverage & tobacco sector only): Livestock management refers to practices that aim to reduce water use and pollution from waste generated in animal husbandry operations e. g by reducing the amount of water needed, evaporation and amount of waste that needs cleaning, feed adequate fibre, reduce the time cattle spend on the yard.
- Animal waste (Food, beverage & tobacco sector only): Manure, slurries or other animal by-products derived from animal husbandry operations to be eliminated or discarded as no longer useful or required.
- Better animal waste management practices (Food, beverage & tobacco sector only): Practices that aim to minimize pollution and nutrient losses through leaching or runoff from animal manure, slurries and other by-products. This can be the result of practices that reduce the generation of waste, increase its re-use and recycling on and off-farm or the recovery of useful components.
- Efficient fertilizer and pesticides management (Food, beverage & tobacco sector only): Implementation of practices that aim at optimizing the application and minimizing the losses to environment of fertilizer and pesticies or their residues.
- Soil conservation practices (Food, beverage & tobacco sector only): Practices that deter the soil degradation in quantitiy or quality, decreasing erosion or nutrient depletion of the soils, i.e. reduced tillage, use of mulching or cover crops.
- Soil degradation (Food, beverage & tobacco sector only): Degradation of the topsoil quality related to soil loss from erosion processes of degradation from the nutrient loss or salinization.
- Sustainable irrigation practices (Food, beverage & tobacco sector only): Practices that optimize irrigation water use leading to a decrease in the total amount of water used in irrigation i.e. through more efficient application of water at the field or irrigation system levels.
Example response
| Country/Area | River basin | Type of risk | Primary risk driver | Primary potential impact |
|---|
| India | Godavari | Physical | Declining water quality | Closure of operations |
| Indonesia | Sungai Kapuas | Regulatory | Statutory water withdrawal limits/changes to
water allocation | Constraint to growth |
| Japan | Mogami | Reputation and markets | Changes in consumer behavior | Brand damage |
| Kyrgyzstan | Issyk-Kul | Physical | Increased levels of
plastic in freshwater bodies | Reduced
revenues from lower sales/output |
Company-specific description
| Timeframe
| Magnitude of potential impact
| Likelihood
| Are you able to provide a potential financial impact figure? | Potential financial impact figure (currency)
|
|---|
| The increased algae in the Godavari may affect our ability to pump water at our Nanded based sites. An inflow of good quality freshwater for cooling and discharge dilution is essential for our data centers to operate, as they represent 15% of our operations. Without it, we would have to perform intermittent shutdowns while we clean the water intakes, and this would lead to significant financial impacts to our business through reduced output. | Current - up to one year | Low-medium | Probable | Yes, a single figure estimate | 300,000.00 |
| Municipal water supply is over-stretched and new conditions of industrial water use are being drafted by the West Kalimantan government. Stricter water use limits may be imposed on water-intensive businesses like our paper mills which require a sufficient water provision to operate. If these new limits are in effect during peak annual production periods, we would experience a significant delay in production, decrease in customer satisfaction, and be unable to perform according to contractual agreements. Reduced output of this magnitude could result in a revenue decrease up to US $ 200,000 per day. | 4-6 years | Medium | Highly probable | Yes, a single figure estimate | 1,450,000.00 |
| When making beverage purchase decisions, consumers in the Japanese market are taking account of the producers’ corporate efforts to conserve shared water resources and its transparency around this. If consumers were to gain the mistaken impression that the group did not make efforts to conserve water resources, or if they felt that such efforts were insufficient, our brands would lose consumers’ trust. Over time, this could lead to a significant decrease in sales of soft drinks, estimated to be up to 15% of annual revenue. | More than 6 years | High | Unlikely
| Yes, an estimated range |
|
| Plastic pollution in water bodies globally (both rivers and oceans) is increasingly in the public eye, and products containing microplastics and plastic fibers are contributing to the issue. As one of the largest manufacturers of athletic leisurewear, we recognize our role in this issue. We have identified a risk that our product sales will be affected by increasing consumer demand for plastic-free beauty products. Secondary impacts include company brand damage from association with the plastic pollution issue, especially in our main market of Germany. | Current - up to one year | Medium | Probable | Yes, an estimated range |
|
| Potential financial impact figure - minimum (currency) | Potential financial impact figure - maximum (currency) | Explanation of financial impact | Primary response to risk | Description of response | Cost of response | Explanation of cost of response |
|---|
| | In 2018, our Nanded site saw intermittent shutdowns as
a result of high algae levels. During this time our organization made heavy
losses as a direct result, and this figure is based on that but adjusted for
inflation, changes to interest rates and the value of the Euro. This is the
potential impact prior to implementing our response. | Increase capital
expenditure | This was a 0.05% one-off investment in mitigation technology i.e. algae detection equipment
in order to minimize impact on critical periods of water use. This includes the
installation of cleaning grids and algae retention systems. We expect this to
improve water security, not just at our facilities in Maharashtra, but for the wider
environment including other stakeholders in the basin. We are currently
implementing this system and it will be completed by March 2021. | 100,000.00 | This was a
one-off investment of EUR 100,000, however maintenance costs may decrease if
monsoon rainfall is lower next year. |
| | Calculated
the number of days per year which could have seen limited supplies of water. As
peak production times vary inter-annually we took these as potentially all
occurring in peak production. This was calculated from 2012 onwards to givie the average
potential annual impact. | Comply with local regulatory
requirements
| We
plan to research and implement a general water efficiency strategy for
facilities in all water stressed locations by the end of 2020. This will be tailored to local conditions. We have set targets to reduce water withdrawals from 8% to 3% in all facilities located in the Kapuas river basin. | 350,000.00 | Financial investment will depend on location and
facility, but our West Kalimantan facilities have been flagged as a high priority by our
Environmental Management System. Estimated US $ 500,000 – 200,000 per site. Cost estimate is based on
previous implementation in 2 similar pulp facilities in Malaysia and Thailand,
with installation of water recycling equipment and training local engineers as
the key expenditure items. |
| 400,000,000.00 | 600,000,000.00 | Based
on our current market share and our internal risk analysis we have estimated
that in the event of a high magnitude dip in consumer demand, 15% of our
market value could be lost. There are high margins of error to this however,
and it is primarily based on case studies of historical analogues and research
from the University of Mogami. | Engage with NGOs/special interest groups | As well as
disclosing information on the group’s water management practices and
environmental performance, we work to promote sustainable water management and
conserve water resources with NGOs active at the local level - such as WWF-Japan so
that all local water users and environmental eco-systems can access sufficient
amounts of good quality water. Our goal is to preserve 400 million liters of water a year for the Mogami river basin system and move our operations out of areas with water stress over the next seven years. We have started a marketing campaign in Japan and Taiwan on these water conservation commitments and our work towards achieving a water secure future as a major beverage retailer.
| 20,000,000.00 | Annual
expenditure on information disclosure and water management activities amounts
to approximately 20 million yen in the reporting year. |
| 10,000,000.00 | 14,000,000.00 | We estimate the potential decrease in sales of beauty products could be of
the order of 12 million over the next 10 years. This is based on market
research we commissioned on consumer preferences with regard to
environmentally-conscious beauty products, combined with our global sales data. | Develop
new products and/or markets | Our company always seeks to innovate in accordance
with changing attitudes and ways of doing business. Plastic pollution is
unacceptable and we have committed to phasing out all plastics from our
products by 2025. We have already begun work on this effort, starting with a
year-long trial of plastic-free products in Spain, one of our largest markets.
We have also invested US$5 million in a five year research program to develop
new plastic-free and resource efficient materials. To manage the residual risk
form our existing products already in the market, we are working with washing
machine manufacturers to develop filtration systems that would prevent the
discharge of microplastics to the environment during the wash cycle. These
efforts align with SDG6’s target to reduce industrial wastewater volumes and
improve water quality globally (6.3.1 and 6.3.2). | 9,000,000.00 | We
estimate that we are spending a total of US$9.5 million over the next five
years on efforts to reduce this risk. This includes US$5 million for the
R&D program, approximately US$500,000 on collaboration efforts with washing
machine manufacturers, and US$4 million in the roll out and expansion of the
trial of plastic-free products. |
(W4.2a) Provide details of risks identified within your value chain
(beyond direct operations) with the potential to have a substantive financial
or strategic impact on your business, and your response
to those risks.
Question Dependencies
- This question only appears if you select one of the following options in response to W4.1:
- Yes, both in direct operations and the rest of our value chain
- Yes, only in our value chain beyond our direct operations
Change from 2019
Minor change
Rationale
Your response to this question will allow CDP data users to see, in one place, details of the inherent water risks that your company is exposed to due to drivers associated with its value chain within particular river basins, and also the estimated potential impact of the risk at the corporate level and your response strategy to address the risk.
Connection to other frameworks
CEO Water Mandate
Implications: Business risks
Response options
Please complete the following table. The table is displayed over several rows for readability. You are able to add rows to this table using the "Add row" button at the bottom of the table.
| Country/Area |
River basin
|
Stage of value chain | Type of risk
|
Primary risk driver
|
Primary potential impact
|
Company-specific description
|
Timeframe
|
|
Select from:
- Country/area drop-down list
|
Select from:
- River basin drop-down list
- Not known
- Other, please specify
|
Select from:- Supply chain
- Use phase
- Other, please specify
|
Select from:
- Physical
- Regulatory
- Reputation & markets
- Technology
|
Select from:
- Response drop-down options below table
|
Select from:
- Response drop-down options below table
|
Text field [maximum 2,500 characters]
|
Select from:
- Current up to one year
- 1-3 years
- 4-6 years
- More than 6 years
- Unknown
|
| Magnitude of potential impact | Likelihood | Are you able to provide a potential financial impact figure? | Potential financial impact figure (currency) | Potential financial impact figure - minimum (currency) | Potential financial impact figure - maximum (currency) |
|---|
Select from:
- High
- Medium-high
- Medium
- Medium-low
- Low
- Unknown
| Select from:
- Virtually certain
- Very likely
- Likely
- More likely than not
- About as likely as not
- Unlikely
- Very unlikely
- Exceptionally unlikely
- Unknown
| Select from:
- Yes, a single figure estimate
- Yes, an estimated range
- No, we do not have this figure
| Numerical field [enter a number from 0-999,999,999,999,999 using a
maximum of 2 decimal places]
| Numerical field [enter a number from 0-999,999,999,999,999 using a maximum of 2 decimal places]
| Numerical field [enter a number from 0-999,999,999,999,999 using a maximum of 2 decimal places]
|
| Explanation of financial impact | Primary response to risk | Description of response | Cost of response | Explanation of cost of response |
|---|
Text field [maximum 2,500 characters]
| Select from:
- Response drop-down options below table
| Text field [maximum 2,500 characters]
| Numerical field [enter a number from 0-999,999,999,999,999 using a
maximum of 2 decimal places]
| Text field [maximum 2,500 characters]
|
[Add Row]
Primary risk driver (column 5)
Physical
- Declining water quality
- Supplier dependency on water intensive energy sources
- Drought
- Ecosystem vulnerability
- Flooding
- Inadequate infrastructure
- Increased levels of plastic in fresh water bodies
- Increased water scarcity
- Increased water stress
- Pollution incident
- Poorly managed sanitation
- Rationing of municipal water supply
- Seasonal supply variability/inter annual variability
- Severe weather events
- Soil degradation (food, beverage & tobacco sector only)
- Pollution of water bodies due to fertilizer, other chemical use, or animal residues(food, beverage & tobacco only)
- Acid rock drainage and metal leaching (metals & mining sector only)
- Leaching of pollutants to groundwater bodies (metals & mining sector only)
- Rupture of tailings dams and toxic spills (metals & mining sector only)
- Other, please specify
Regulatory
- Changed product standards
- Higher water prices
- Increased difficulty in supplier obtaining withdrawals/operations permit
- Lack of transparency of water rights
- Limited or no river basin/catchment management
- Litigation against supplier
- Mandatory water efficiency, conservation, recycling or process standards
- Poor coordination between regulatory bodies
- Poor enforcement of water regulation
- Tighter regulatory standards
- Regulation of discharge quality/volumes
- Regulatory uncertainty
- Statutory water withdrawal limits/changes to water allocation
- Other, please specify
|
Reputation & markets
- Changes in consumer behavior
- Community opposition
- Inadequate access to water, sanitation, and hygiene services
- Increased stakeholder concern or negative stakeholder feedback
- Water-related litigation
- Negative media coverage
- Other, please specify
Technology
- Data access/availability
- Substitution of existing products with lower water impact options
- Transition to bio-based chemicals (chemicals sector only)
- Transition to water efficient and low water intensity technologies and products
- Transition to water intensive, low carbon energy sources
- Unsuccessful investment in new technologies
- Other, please specify
|
Primary potential impact (column 6)
- Company brand damage
- Changing revenue mix and sources
- Constraint to growth
- Closure of company operations
- Diminished ability to reduce value chain GHG emissions
- Disruption to sales due to value chain disruption
- Fines, penalties or enforcement orders
- Impact on company assets
- Disruption to workforce management and planning
- Increased insurance premiums
- Increased cost of capital
- Increased compliance costs
|
- Increased operating costs
- Increased production costs due to changing input prices from supplier
- Litigation
- Loss of license to operate
- Reduction or disruption in production capacity
- Reduced demand for products and services
- Reduction in capital availability
- Reduced revenues from lower sales/output
- Upfront costs to adopt/deploy new practices and processes
- Supply chain disruption
- Mine closure (metals & mining sector only)
- Other, please specify
|
Primary response to risk (column 16)
Direct operations
- Develop new products and/or markets
- Improve alignment of our procurement policy influencing activity with our water stewardship commitments
- Include in Business Continuity Plan
- Increase capital expenditure
- Increase investment in new technology
- Purchase water quality credits
- Other, please specify
Upstream
- Increase our insurance coverage
- Increase supplier diversification
- Map supplier water risk
- Tighten supplier performance standards
- Use risk transfer instruments
- Reduce food waste throughout the value chain (food, beverage & tobacco sector only)
- Other, please specify
|
Supplier engagement
- Develop supplier drought emergency plans
- Develop supplier flood emergency plans
- Establish supplier performance targets
- Increase supplier reporting on water
- Introduce/strengthen water management incentives for suppliers
- Promote adoption of waste water management procedures among suppliers
- Promote greater due diligence among suppliers
- Promote investment in infrastructure and technologies for water saving, re-use and recycling among suppliers
- Promote the use of insurance among suppliers
- Work with supplier to engage with local communities
- Promote the adoption of alternative crop management strategies among suppliers to reduce use of fertilizers and pesticides (food, beverage & tobacco sector only)
- Promote the adoption of alternative livestock management practices among suppliers (food, beverage & tobacco sector only)
- Promote the adoption of alternative livestock management practices among suppliers to reduce use of veterinary products (food, beverage & tobacco sector only)
- Promote the adoption of better animal waste management among suppliers (food, beverage & tobacco sector only)
- Promote the adoption of soil conservation practices among suppliers (food, beverage & tobacco sector only)
- Promote the adoption of sustainable irrigation practices among suppliers (food, beverage & tobacco sector only)
- Promote efficient fertilizer and pesticide management among suppliers (food, beverage & tobacco sector only)
- Promote the use of drought resistant crop varieties among suppliers (food, beverage & tobacco sector only)
- Other, please specify
Downstream
- Implement nature-based solutions
- Improve pollution abatement and control measures
- Increase/review infrastructure investment
- Support river basin restoration
- Work with supplier to engage with customers
- Work with supplier to engage with NGOs/special interest groups
- Work with supplier to engage with regulators/policymakers
- Reduce food waste throughout the value chain (food, beverage & tobacco sector only)
- Other, please specify
|
Requested content
General
- This question asks about risk drivers associated with your value chain beyond your direct operations. Consider which risks drivers have the potential to substantively impact your organization at the corporate level, either currently or in the future, and what the response has been. (W4.2 asks about water-related risk drivers in your direct operations.).
- For the purposes of this response, the risks reported should only be those which:
- Expose your organization to substantive financial or strategic impacts to your business - such as to operations, revenue, or expenditure, assets and liabilities, or capital allocation (as per the definition of “substantive” you provide in W4.1a);
- Pose a risk at the corporate level, and not simply at the asset/business unit/geographic level at which they may occur;
- Are inherent (a risk that exists in the absence of controls, so not taking into account any potential mitigation or management measures that have been or could be implemented).
- Use each row to report a primary risk driver and the potential substantive impact it could cause. If there is more than one impact, please select the primary impact. If there is more than one response to this risk, select the primary response.
- To report additional risk drivers or impacts associated with a basin, you are able to add a new row. Please report no more than 3 risk drivers or impacts per river basin and report the most substantive.
Country/Area (column 1)
- From the drop-down menu provided, please select the country/area associated with the driver of the risk you are reporting.
- Note that a selection must be made for both column 1 and column 2. Your data will not be saved if either column is left blank.
River basin (column 2)
- From the drop-down options provided, select the river basin associated with the driver of the risk you are reporting. If you select “Other, please specify”, provide a label for the river basin.
- For companies withdrawing water from large confined aquifers that may not discharge to the river basin they are located in e.g. Ogallala aquifer in the United States, please select “Other, please specify” and type in the name of the local aquifer source. Ensure that the correct country/area name is selected in column 1 (Country/Area).
- You may want to report the sub-basin for a main river basin that is listed. In this case select “Other, please specify” and use the following format: “Putumayo, Amazon”.
- Refer to the instructions in the Introduction to CDP’s water security reporting guidance for more details on how to response to ‘River basin’ columns.
- Note that a selection must be made for both column 1 and column 2. Your data will not be saved if either column is left blank.
Stage of value chain (column 3)
- Select the stage of the value chain where you have identified a risk with the potential to impact your business either currently or in the future.
- If you select “Other, please specify”, provide a label for the stage of value chain.
Type of risk (column 4)
- Select the type of risk you would like to report. Your selection will determine the list of risk drivers that will appear in column 5.
- Note that a selection must be made for both column 4 and column 5. Your data will not be saved if either column is left blank.
Primary risk driver (column 5)
- The drop-down options presented are linked to the type of risk you selected in column 4.
- In the case that there may be more than one driver or a chain of causes for the potential substantive impact, you should select what you consider to be the primary driver.
- If you do want to choose an additional driver for a river basin, you will need to add another row to report the details. Please refrain from providing more than three risk drivers per river basin.
- If you select “Other, please specify”, provide a label for the primary risk driver.
- Note that a selection must be made for both column 4 and column 5. Your data will not be saved if either column is left blank.
Primary potential impact (column 6)
- Select the option that best describes the primary potential impact to your company due to the risk driver reported in column 5.
- The impact must be substantive at the corporate level as defined in W4.1a.
- If there is more than one potential impact associated with a risk driver, you should select what you consider to be the primary impact and describe the secondary impacts in column 7. This could, for example, be increased costs, decreased revenue, or closure of operations. Impacts can be operational or financial and can affect your organization, your consumers or other stakeholders as well as your company.
- If you do want to choose an additional substantive impact for a river basin or a risk driver, you will need to add another row to report the details. Please refrain from providing more than three impacts per river basin.
- If you select “Other, please specify”, provide a label for the stage of type of potential impact.
Company-specific description (column 7)
- Provide further contextual information on the risk driver selected in column 5, including more detail on its nature and location.
- Include a company-specific description of how the risk driver will impact your organization, including the nature of any secondary impacts.
Timeframe (column 8)
- Select the timeframe in which the inherent risks would be most likely to materialize. It is acknowledged that there is likely to be a higher degree of uncertainty associated with long-term risks. For example, you may consider you company to be at risk due to increasing pollution levels but this is unlikely to impact your business within the next 5 years. In this case you would select ‘4-6 years’.
Magnitude of potential impact (column 9)
- The magnitude describes the extent to which the impact, if it occurred, would affect your business. You should consider the business as a whole. This means that the potential magnitude of the impact can be a combination of the scale of the damage and your organization’s state of resilience prior to responding to the risk.
- Magnitude of impact will vary from company to company. For example:
- Two companies may have identical facilities located on a coast in an area which is vulnerable to flooding. However, if company A relies on that facility for 90% of its production capacity and company B relies on it for only 40% of its production capacity, the magnitude of impact due to the same flooding damage will be comparatively higher on company A than on company B;
- A 1% reduction in profits will have different effects on different companies depending on the profit margins on which they work.
- As it is not possible for CDP to accurately define terms for magnitude of impact, companies are asked to determine and report magnitude using a qualitative 5 point scale from High to Low. Factors to consider when classifying the magnitude of the impact on your organization include:
- The proportion of business units affected;
- The size of the impact on those business units;
- The dependency of the company on those units;
- The potential for shareholder or customer concern.
- An impact could have a relatively high magnitude for the company as a whole because of a large effect in one of these aspects or small effects in all four combining to create a larger impact.
- The magnitude should align with the proportion of global revenue at risk you reported in W4.1c for the river basin associated with the impact (selected in column 2). For example, if 50% of global revenue could be affected by water risk in the Yellow River basin then the magnitude for a risk reported in the Yellow River basin should align.
- If the financial impact has not been assessed by your organization, please select ‘Unknown’.
Likelihood (column 10)
- Likelihood refers to the probability of the impact occurring within the time frame reported in column 8. In the case of an inherent risk, the probability of the impact might be similar to the probability of the risk event (the risk driver) itself.
- Likelihood along with the magnitude are the building blocks for quantifying and prioritizing risk.
- The terms used to describe likelihood are taken from the Intergovernmental Panel on Climate Change’s (IPCC) 2013 report and are consistent across all CDP information requests.
- As a guide to quantifying likelihood on a % basis, we suggest:
- Virtually certain (greater than 99% probability);
- Very likely (greater than 90% probability);
- Likely (greater than 66% probability);
- More likely than not (greater than 50% probability);
- About as likely as not (between 33% and 66% probability);
- Unlikely (less than 33% probability);
- Very unlikely (less than 10%);
- Exceptionally unlikely (less than 1% probability);
- Unknown.
- For example, you may consider your company to be potentially exposed to a risk of water rationing in the next ‘4-6 years’ which would cause an impact of high magnitude - but the risk is not considered very likely to materialize. You would select ‘unlikely’. Alternatively, if the risk related to a piece of new legislation which has already been prepared in draft form, the likelihood of the impact associated with that risk occurring will be relatively high and you would select ‘very likely’.
Are you able to provide a potential financial impact figure? (column 11)
- Your selection will determine whether column 12 or columns 13 and 14 will be presented.
- It is acknowledged that these figures will be estimates.
- If you are unable to provide a figure for a financial impact, you may use column 15 (‘Explanation of financial impact’) to provide a description of the impact in relative terms; for example, as a percentage relative to a stated or publicly available figure, or give a qualitative estimate of the financial impact.
Potential financial impact figure (currency) (column 12)
- Provide a single figure for the inherent financial impact of the risk (before taking into consideration any controls you may have in place to mitigate the impacts). This figure should be in the same currency that you selected in question W0.4 for all financial information disclosed throughout your response.
- An example would be the value of stranded assets or the value lost due to halted production (before taking into consideration any insurance coverage that might compensate you).
Potential financial impact figure - minimum/maximum (currency) (columns 13, 14)
- Provide the estimated range for the inherent financial impact (before taking into consideration any controls you may have in place to mitigate the impact).This figure should be in the same currency that you selected in question W0.4 for all financial information disclosed throughout your response.
- Potential financial impact figure - minimum (currency) use this field to report the lower point of your estimated financial impact associate with the risk. For example, if the range is from US $5,000 to $50,000, ‘5,000’ should be reported here.
- Potential financial impact figure - maximum (currency) use this field to report the upper point of your estimated financial impact associate with the risk. For example, if the range is from US $5,000 to $50,000, ‘50,000’ should be reported here.
Explanation of financial impact (column 15)
- Use this field to explain the figure(s) provided in 'Potential financial impact' (columns 12, 13, 14).
- Describe how you arrived at this figure (or range), including:
- What approach was employed to calculate the figure;
- Any assumptions the figure is dependent on;
- The likely timescale for the financial impact.
- If 'We do not have this figure' was selected in column 11, use this column to provide a description of the financial impact in the relative terms (for example as a percentage relative to a stated or publicly available figure) or give a qualitative estimate of the financial impact. Otherwise, if you have no information about the financial impact, please state “The impact has not been quantified financially”.
Primary response to risk (column 16)
- Select the response strategy that most closely describes how your organization expects to respond to the reported risk. If there is no appropriate response strategy for your organization included in the list, please select “Other, please specify” and add your own response label.
- If you select “Other, please specify”, provide a label for the primary response to risk.
- Note that you will be required to make two selections for this column. One for the risk response type and one for the primary response to risk. Your data will not be saved if one selection is left blank.
Description of response (column 17)
- Provide additional details of your organization’s response to mitigate, control, transfer or accept the risk associated with the driver reported in this row. You may include any secondary response strategies.
- Include the timeframe expected for the response strategy to be implemented. Is the response underway, not yet implemented, or completed? What is the projected progress for lowering residual risk?
- Describe the difference the response has made/is likely to make. This may include:
- How effective the response has been/is expected to be in preventing the inherent risk driver reoccurring, or for improving your organization’s resilience at the asset or corporate level, so preventing future financial, operational or strategic impacts;
- Whether water security for your company is likely to improve as a result, at either the asset or corporate level;
- Whether water security for other users is likely to improve as a result;
- Whether the response contributes to the progress of other UN Sustainable Development Goals;
- Whether the response strategy involves any collective action initiatives.
- Report whether the response strategy involves any collective action initiatives, or if it contributes to the progress of a UN Sustainable Development Goal.
- For those who indicate in W11.2 that they would be interested in having their public response data transferred to the Water Action Hub, we ask that you provide as much information about your response as possible, particularly local projects, including:
- Who else is involved in the joint project /initiative (such as names of organizations or government offices) or who you would like to work with (government agencies, other companies, NGOs, etc.);
- The geographic or other scale of the project;
- What the project seeks to accomplish including expected benefits for the watershed beyond the company;
- When the project started and if it has concluded or if it is continuing;
- If possible, the specific location of the project.
- Note that these criteria are not scored but are crucial to building a project for the Water Action Hub and without this detail the project may not be suitable to transfer to this platform.
Cost of response (column 18)
- Provide a quantitative figure for the cost of your risk response and management actions. If there are no costs to responding to and managing the risk, enter '0'. If the value you have reported is an estimate, please state this in column 19 (Explanation of cost of response).
- If you cannot provide an absolute value, you may use column 19 to provide a percentage value.
- This figure should be in the same currency that you selected for all financial information disclosed throughout your response in question W0.4.
Explanation of cost of response (column 19)
- Use this field to explain the figure provided in column 18. Please describe how you derived this figure, including:
- What approach was taken to arriving at the cost of your response strategy;
- If it is an estimate;
- Any assumptions the figure is dependent on;
- The likely timescale for the cost of response.
- In case no figure is provided in column 18, provide a description of the cost in relative terms or give a qualitative estimate of the cost of the response. Otherwise, if you have no information about the financial impact, please write “cost of response not quantified at corporate level".
Explanation of terms
- Inherent risk: The risk that exists in the absence of controls, i.e. not taking into account any potential mitigation or management measures that could be implemented.
- Physical risk: Risk driven by water stress or scarcity (too little water), flooding (too much water) or pollution (lower water quality). Disruption in water supply or decline in water quality can adversely affect operations where water is used for production, irrigation, material processing, cooling, washing and cleaning, and personal consumption. Physical risks can adversely affect production or cause damage to physical assets.
- Note that weather events such as snow, or physical events such as high tide or earthquakes, are not a water risks in themselves but may cause water risks. If snow or earthquakes cause flooding, then it is the flooding that is the water risk and should be reported as such. However, snow, high tide and earthquakes could be considered water risks if they could cause predictable disruption to water supply or have groundwater impacts. For example, if heavy snow on property is common it could cause pollution release incidents when it melts if not managed properly.
- Regulatory risk: Risks driven by an expected or unexpected change or uncertainty, in law or regulation that may have direct or indirect impacts on a company. A change in law or regulation can increase the costs of operating a business, reduce the attractiveness of an investment, or change the competitive landscape in which a company operates. Water regulatory measures may include, among others, new water permit structures, rate changes to control withdrawals and discharge, redistribution of water to various users, and restrictions on pollutant types and levels.
- Reputational risk: Risk driven by litigation, product risks due to changes in consumer behavior, and risks that may impact decisions made by investors, consumers and current/potential employees concerning a company.
- Residual risk: The risk remaining after a specific action has been taken to manage the risk.
- Risk driver: The factor/ driving force that could cause the potential impact. Risk drivers are typically physical (e.g. weather extreme events), regulatory, reputational and markets related, or technological.
- Technological risk: Risk driven by technological improvements or innovations; for example, those that support water security or the transition to a lower-carbon, energy-efficient economic system.
- Water scarcity: Refers to the volumetric abundance, or lack thereof, of freshwater resources. Scarcity is human driven; it is a function of the volume of human water consumption relative to the volume of water resources in a given area. As such, an arid region with very little water, but no human water consumption would not be considered scarce, but rather “arid.” Water scarcity is a physical, objective reality that can be measured consistently across regions and over time. Water scarcity reflects the physical abundance of freshwater rather than whether that water is suitable for use. For instance, a region may have abundant water resources (and thus not be considered water scarce), but have such severe pollution that those supplies are unfit for human or ecological uses.
Value chain (beyond direct operations): The sequence of activities or partners, either upstream or downstream of direct operations, that provide value to or receive value from an organization’s products and services; for example, suppliers, product users and franchisees.
Explanation of terms for chemical sector
- Bio-based chemicals (Chemical sector only): Bio-based products are wholly or partly derived from materials of biological origin, excluding materials embedded in geological formations and/or fossilized.
Explanation of terms for food, beverage & tobacco sector
- Alternative crop management strategies to reduce fertilizer and pesticide use (Food, beverage & tobacco sector only): Practices that aim to reduce the need for fertilizer or pesticide applications or that lead to greater efficiency in their application i.e. crop rotations, cover cropping, intercropping, etc.
- Alternative livestock management practices (Food, beverage & tobacco sector only): Livestock management refers to practices that aim to reduce water use and pollution from waste generated in animal husbandry operations e. g by reducing the amount of water needed, evaporation and amount of waste that needs cleaning, feed adequate fibre, reduce the time cattle spend on the yard.
- Animal waste (Food, beverage & tobacco sector only): Manure, slurries or other animal by-products derived from animal husbandry operations to be eliminated or discarded as no longer useful or required.
- Better animal waste management practices (Food, beverage & tobacco sector only): Practices that aim to minimize pollution and nutrient losses through leaching or runoff from animal manure, slurries and other by-products. This can be the result of practices that reduce the generation of waste, increase its re-use and recycling on and off-farm or the recovery of useful components.
- Efficient fertilizer and pesticides management (Food, beverage & tobacco sector only): Implementation of practices that aim at optimizing the application and minimizing the losses to environment of fertilizer and pesticies or their residues.
- Soil conservation practices (Food, beverage & tobacco sector only): Practices that deter the soil degradation in quantitiy or quality, decreasing erosion or nutrient depletion of the soils, i.e. reduced tillage, use of mulching or cover crops.
- Soil degradation (Food, beverage & tobacco sector only): Degradation of the topsoil quality related to soil loss from erosion processes of degradation from the nutrient loss or salinization.
- Sustainable irrigation practices (Food, beverage & tobacco sector only): Practices that optimize irrigation water use leading to a decrease in the total amount of water used in irrigation i.e. through more efficient application of water at the field or irrigation system levels.
(W4.2b) Why does your organization not consider itself exposed to water risks in its direct operations with the potential to have a substantive financial or strategic impact?
Question Dependencies
- This question only appears if you select “No” or “Yes, only in our value chain beyond our direct operations” in response to W4.1.
Change from 2019
No change
Rationale
A risk assessment may identify no substantive water-related risks. This conclusion is important to disclose and explain. Knowing why your organization has concluded that it is not exposed to risks is crucial for data users to understand your business. This is especially relevant if you responded to W1.1 by rating water as important to your direct operations.
Response options
Please complete the following table:
| Primary reason
|
Please explain
|
|
Select from:
- Risks exist, but no substantive impact anticipated
- Evaluation in progress
- Not yet evaluated
- Other, please specify
|
Text field [maximum 2,500 characters]
|
Requested content
Primary reason (column 1)
- Choose the option that best explains why your organization does not consider itself exposed to any water-related risks in your direct operations with the potential to have a substantive financial or strategic impact on your business - given your own definition of substantive reported in W4.1a.
- If none of the reasons listed are applicable, select "Other, please specify" and fill in the text box with the appropriate reason.
Please explain (column 2)
- Your explanation should include company-specific details such as:
- your evaluation process that is in progress
- or reasons why you have not yet conducted a risk assessment
- or why no substantive impacts to your organization are anticipated due to water-related risks that have been identified in your direct operations.
(W4.2c) Why does your organization not consider itself exposed to water risks in its value chain (beyond direct operations) with the potential to have a substantive financial or strategic impact?
Question dependencies
- This question only appears if you select “No” or “Yes, only within our direct operations” in response to W4.1.
Change from 2019
No change
Rationale
A risk assessment may identify no substantive water-related risks. This conclusion is important to disclose and explain. Knowing why your organization has concluded that it is not exposed to risks is crucial for data users to understand your business. This is especially relevant if you responded to W1.1 by rating water as important to your value chain.
Response options
Please complete the following table:
|
Primary reason
|
Please explain
|
|
Select from:
- Risks exist, but no substantive impact anticipated
- Evaluation in progress
- Not yet evaluated
- Lack of visibility of supply chain
- Other, please specify
|
Text field [maximum 2,500 characters]
|
Requested content
Primary reason (column 1)
- Choose the option that best explains why your organization does not consider itself exposed to any water-related risks anywhere in your value chain (beyond direct operations) with the potential to have a substantive financial or strategic impact on your business - given your own definition of substantive reported in W4.1a.
- If none of the reasons listed are applicable, select "Other, please specify" and fill in the text box with the appropriate reason.
Please explain (column 2)
- Your explanation should include company-specific details such as:
- your evaluation process that is in progress for your value chain
- or reasons why you have not yet conducted a risk assessment for your value chain
- any plans to improve supplier visibility
- or why no substantive impacts to your organization are anticipated due to water-related risks that have been identified in your value chain.
Water-related opportunities
(W4.3) Have you identified any water-related opportunities with the potential to have a substantive financial or strategic impact on your business?
Question dependencies
- Your response to W4.3 will determine which subsequent questions are presented. If your response to W4.3 is amended, data in those dependent questions may be erased. In this case, be sure to re-enter data for all relevant questions. The guidance for each question indicates if it is a dependent question.
Change from 2019
No change
Rationale
Changes in water management, availability, climatic conditions and other physical, market or regulatory developments related to water may pose commercial or other opportunities to some companies. CDP data users are interested in understanding how companies are approaching and capitalizing on potential water-related opportunities, especially those with market significance and financial value.
Connection to other frameworks
CEO Water Mandate
Implications: Business risks
Implications: Business opportunities
Response options
Select one of the following options:
- Yes, we have identified opportunities, and some/all are being realized
- Yes, we have identified opportunities but are unable to realize them
- No
Request content
General
- Consider whether your organization has identified water-related opportunities that could have a substantive impact on your business at the corporate level. Also consider whether or not the opportunities are being realized.
- Select one of the ‘Yes’ options if water presents a strategic, operational or market opportunity that is substantively benefiting, or has the potential to substantively benefit, your organization.
- The opportunities may:
- be commercial or operational in nature
- be driven at the asset, business unit, geographic or other level
- bring direct financial benefits
- bring other kinds of benefits, such as policy influence, strengthening of reputation, or reduced environmental impact
- also be of benefit to other water users; for example through stewardship or collective action programs that address shared risks or aim to secure water for all.
- Select ‘Yes, we have identified opportunities, and some/all are being realized’ if your organization has taken action to pursue any substantive opportunities. More details will be requested in W4.3a.
- Select ‘Yes, we have identified opportunities but are unable to realize them’ if your organization has not taken action to pursue any substantive opportunities. More details will be requested in W4.3b.
- Only select ‘No’ if you have not identified any substantive opportunities.
Explanation of terms
- Substantive impact: An impact that has a considerable or relatively significant effect on an organization at the corporate level. This could include an operational, financial or strategic effect on the entire business or part of a business
(W4.3a) Provide details of opportunities currently being realized that could have a substantive financial or strategic impact on your business.
Question dependencies
- This question only appears if you select “Yes, we have identified opportunities, and some/all are being realized” in response to question W4.3.
Change from 2019
Minor change
Rationale
Investors and data users are interested to know if you are realizing the opportunities stemming from changes in water availability, climatic conditions, and other water-related developments and their potential financial impact. Details related to these opportunities can be important when evaluating businesses' plans and environmental strategies.
Connection to other frameworks
CEO Water Mandate
Implications: Business risks
SDG
Goal 6: Clean water and sanitation
Response options
Please complete the following table. You are able to add rows by using the “Add Row” button at the bottom of the table.
|
Type of opportunity
|
Primary water-related opportunity
|
Company-specific description & strategy to realize opportunity
|
Estimated timeframe for realization
|
Magnitude of potential financial impact
|
|
Select from:
- Efficiency
- Resilience
- Products and services
- Markets
- Other
|
Select from:
- Response drop-down options below table
|
Text field [maximum 2,500 characters]
|
Select from:
- Current - up to 1 year
- 1 to 3 years
- 4 to 6 years
- More than 6 years
- Unknown
|
Select from:
- Low
- Low-medium
- Medium
- Medium-high
- High
- Unknown
|
Are you able to provide a potential financial impact figure? | Potential financial impact figure (currency) | Potential financial impact figure - minimum (currency) | Potential financial impact figure - maximum (currency) | Explanation of financial impact
|
|---|
Select from: - Yes, a single figure estimate
- Yes, an estimated range
- No, we do not have this figure
| Numerical field [enter a number from 0-999,999,999,999,999 using a maximum of 2 decimal places]
| Numerical field [enter a number from 0-999,999,999,999,999 using a maximum of 2 decimal places]
| Numerical field [enter a number from
0-999,999,999,999,999 using a maximum of 2 decimal places]
| Text field [maximum 2,500 characters]
|
[Add Row]
Primary water-related opportunity (column 2)
|
Efficiency
- Cost savings
- Improved water efficiency in operations
- Water recovery from sewage management
- Improved field recovery factor (oil & gas sector only)
- Other, please specify
Resilience
- Increased resilience to impacts of climate change
- Increased supply chain resilience
- Resilience to future regulatory changes
- Other, please specify
Products and services
- New R&D opportunities
- Increased sales of existing products/services
- Sales of new products/services
- Reduced impact of product use on water resources
- Other, please specify
|
Markets
- Expansion into new markets
- Improved community relations
- Improved staff retention
- Improved customer satisfaction
- Increased brand value
- Increased shareholder value
- Strengthened social license to operate
- Stronger competitive advantage
- Other, please specify
Other
|
Requested content
General
- For the purposes of this response, the opportunities reported should only be those which currently or potentially have a positive substantive impact on your business at the corporate level, directly or indirectly.
- You should only report opportunities which you are currently taking action to realize.
- The opportunities may:
- Be commercial or operational in nature;
- Be driven at the asset, business unit, geographic or other level;
- Bring direct financial benefits;
- Bring other kinds of benefits, such as policy influence, strengthening of reputation, or reduced environmental impact;
- Also be of benefit to other water users; for example through stewardship or collective action programs that address shared risks or aim to secure water for all.
Type of opportunity/Primary water-related opportunity (columns 1, 2)
- The drop-down options presented in column 2 depend on the type of opportunity you selected in column 1.
- If you select “Other, please specify”, provide a label for the primary water-related opportunity.
- Other examples of opportunity types are provided in the Additional Information row.
Description of opportunity & strategy to realize opportunity (column 3)
- Include details of the opportunity:
- A description of the actual or anticipated positive benefit for your organization, for example, a description of the strategic or financial impact;
- Where in the organization the benefit applies, e.g. - company-wide, to a certain location, geographic scale, business line, stage of your value chain, or with a particular product or service;
- What is driving the opportunity and where in the in the organization the opportunity originates, e.g. - company-wide, to a certain location, geographic scale, business line, stage of your value chain, or with a particular product or service.
- Describe how you have defined ‘substantive’ impact in the context of an opportunity, and reference the definition of substantive impact you gave in W4.1a if applicable.
- With reference to your organization specifically, describe the strategy your organization has in place to take advantage of the opportunities and include an example of the strategy in action, if possible. Actions might include, for example, developing new product lines to address water challenges or increased demand for certain product lines due to changing consumer attitudes; or strengthening catchment relationships in order to realize a collective action opportunity.
Estimated timeframe for realization (column 4)
- This refers to the estimated timeframe it will take to realize the opportunity from the current reporting year. Your organization may have already begun work in previous years to realize this opportunity.
Magnitude of potential financial impact (column 5)
- Indicate your understanding of the magnitude of the financial benefit that has arisen or will arise due to this opportunity. Your response should be in terms of your entire organization, rather than a local asset/business unit/geography.
- This is an estimate of the inherent potential financial benefit of the opportunities i.e. before taking into consideration any processes you may have in place to capitalize on the opportunity.
- The ‘magnitude’ of the potential benefit arising from a financial value will vary in scale and metric from company to company, so it is not possible for CDP to accurately define the listed terms for magnitude. For example, two companies may report a potential financial impact figure of $500,000. For company A this could represent a 1% increase in profits, but a 15% increase in revenue for company B.
- For this reason, companies are asked to determine and report magnitude using a qualitative 5-point scale from High to Low, and then give more details in column 7.
- If the financial impact has not been assessed by your organization, please select ‘Unknown’.
Are you able to provide a potential financial impact figure? (column 6)
- Your selection will determine whether column 7 or columns 8 and 9 will be presented.
- It is acknowledged that these will be estimates and, where possible, assumptions made in arriving at a financial impact figure should be stated column 10.
- If you are unable to provide a figure for a financial impact, you may use column 10 ('Explanation of potential financial impact') to provide a description of the impact in relative terms; for example, as a percentage relative to a stated or publicly available figure, or give a qualitative estimate of the financial impact.
Potential financial impact figure (currency) (column 7)
- Provide a single figure for the financial impact of the opportunity. This figure should be in the same currency that you selected in question W0.4 for all financial information disclosed throughout your response.
Potential financial impact figure - minimum/maximum (currency) (columns 8, 9)
- Provide the estimated range for the financial impact of the opportunity. This figure should be in the same currency that you selected in question W0.4 for all financial information disclosed throughout your response.
- Potential financial impact figure - minimum (currency) use this field to report the lower point of your estimated financial impact associated with the risk. For example, if the range is from US $5,000 to $50,000, ‘5,000’ should be reported here.
- Potential financial impact figure - maximum (currency) use this field to report the upper point of your estimated financial impact associated with the risk. For example, if the range is from US $5,000 to $50,000, ‘50,000’ should be reported here.
Explanation of potential financial impact figure (column 10)
- Comment on your selection in column 5, how you arrive at that assessment of magnitude and the assumptions made in calculating the financial figure(s) provided in 'Potential financial impacts' (columns 7, 8, 9).
- Include any further information with regards to the information provided, including for example the geographic scale associated with the potential financial impact.
- If 'We do not have this figure' was selected in column 6, use this column to provide a description of the financial impact in relative terms (for example as a percentage relative to a stated or publicly available figure) or give a qualitative estimate of the financial impact. Otherwise, if you have no information about the financial impact, please state 'The impact has not been quantified financially'.
Example response
|
Type of opportunity
|
Primary water-related opportunity
|
Company-specific description & strategy to realize opportunity
|
Estimated timeframe for realization
|
Magnitude of potential financial impact
|
|
Markets
|
Increased brand value
|
Our strategy for increasing our brand value is to develop innovative new
products which help people adapt to water scarcity.
We plan to leverage our
sector leader status with an extensive marketing campaign targeting new and
existing customers in emerging markets in Brazil and India with our new water
efficient household wet appliance line – Wash N’Go. This new appliance line
will help save approximately 30-40 L of water per household per day.
|
1 to 3 years
|
Low-medium
|
| Efficiency |
Cost savings |
water use by increasing
water recycling will lead to lower costs and associated taxes across our South
African facilities; reducing wastewater loading will reduce costs for treatment
and disposal across our South African facilities. Wehave already installed water efficient measures at 10% of our South
African facilities in the past 18 months. We aim to install water efficient technologies in our entire portfolio of South African facilities by 2022/23. |
1 to 3 years |
Medium-high |
| Products and services |
Sales of new products/services |
Over 95% of our product water footprint occurs in the product use phase,
and we are focusing on developing and increasing our sales of types of product
that are the least water intensive and have the most potential for dramatic
reductions in product water use i.e. laundry, cleaning and cosmetics.
For example, we are developing our new brand SURF detergent and this will
reduce the volume of water needed for handwashes by around 10L, decreasing the
number of rinses by around a quarter per wash. Marketing in regions with water
stress is already in place to realize this opportunity for new sales.
|
1 to 3 years |
Low-medium |
| Resilience |
Increased supply chain resilience |
recognize that investing
in the enhancement of water efficiency in our supply chain can improve the resilience
of our business and provide financial return. In 2012, we started investing in these
improvements through an annual fund of around $25m. Business cases are
submitted by suppliers for each project, and projects are then selected on
their contribution in terms of $/m3 of water saved. Priority is given
to sites in water stressed areas. For example, in 2018 the fund sanctioned a
project to install rainwater harvesting, filter upgrades and more efficient
heat pumps at one of our most water stressed sites. These interventions will
improve local resilience by saving up to 14,000m³ of water or 18% of the sites’
total use per year. |
1 to 3 years |
Low |
Are you able to provide a potential financial impact figure? | Potential financial impact figure (currency) | Potential financial impact figure - minimum (currency) | Potential financial impact figure - maximum (currency) | Explanation of financial impact |
|---|
Yes, a single figure estimate | 150,000,000.00 |
|
| Revenue from an increased market share in these countries is forecasted
to be in the region of US $150 million. We have already rolled out this strategy
in 10 major Indian cities and seen an increased market share of 0.5%. The magnitude of this
is based on our latest valuation. |
| Yes, a single figure estimate | 6,000,000.00 | | | Based on the measures we have already
installed water at 10% of our South African facilities in the past 18 months with
a resulting cost saving of ZAR 200,000 from reduced water charges, we have been able to estimate
the full program could result in savings of up to ZAR 2 million per year once
implemented. We expect this will require three years to be fully realized and
will reduce our annual water utilities spend by approximately 30%. |
| Yes, a single figure estimate | 1,900,000.00 | | | Based on internal research into the market for such
products, and estimating the potential financial impact of new products using
future water-smart technologies and portfolio shifts towards low-water or
waterless formats in our Home Care and Beauty & Personal Care categories, we
estimate this could yield around $1.5-2.4 billion incremental sales by 2025. |
| Yes, an estimated range | | 350,000.00 | 450,000.00 | Over the course of the projects’ lifetimes of 12
years the total cost saving is estimated to be within 12.5% of $400k. Savings
will mostly be accumulated through reduced water and utility costs. This is a
low magnitude opportunity compared to others realized in the reporting year. |
Additional information
Examples of opportunities:
Efficiency
- Cost savings: Reducing water use through water efficiency, recycling or re-use of wastewater, may provide savings by reducing energy use, water bills or the need for discharge permits.
- Improved water efficiency: Reducing water use through improving process and/or procedures. Improved water efficiency can lead to cost savings, increased brand value, or the creation of a new product or service. Efficiency gains are consistently set as targets for large corporations and can be used across different sectors as a relative measure of water use.
Resilience
- Climate change resilience: Investing in solving water-related challenges such as poor water infrastructure, implementing flood risk strategies or catchment restoration for example, may have the dual purpose of sustaining important operational inputs such as water supply or product distribution as well as ensuring resilience against climate change.
- Collective action: By engaging with other water users in local catchments or working with policy makers for example, business may share in the value created from tackling difficult local water challenges in a collective manner.This is an opportunity to influence how water is used locally and help ensure the sustainability of business locally in the face of water challenges such as increasing water scarcity.
- Ensuring supply chain resilience: Water challenges may provide greater impetus to invest in ensuring supply chain resilience ensuring the long-term resilience of current and future growth strategies.
Products and services
- Sales of new products and services: Local water issues in certain markets e.g. poor water quality in China, may create greater demand for new products e.g. domestic water filters. Designing new products or services in response to increasing water challenges.
- Research & Development (R&D): Water challenges may provide greater impetus to fund specific research areas.
- Improved community relations: By being transparent about water use and engaging with the local community to understand and alleviate concerns about water issues, a business may maintain their social licence to operate and possibly grow their business in the future locally.
Markets
- Stronger competitive advantage: By investing in solving water-related challenges or water-related innovation, may put some businesses ahead of their competitors or help capture greater market share.
- Stronger competitive advantage: The introduction of new standards, for example, for water use and quality of effluent discharged, can provide a competitive advantage to those organizations well prepared to quickly implement changes.
- Increased brand value: By associating a company’s brand in a positive way with consumer interest in local water issues, a company might accrue increased brand value. For example, by selling products that promote water-efficiency in water-scarce regions, consumer confidence may grow in a brand and prompt consumers to buy other products from the same brand. This might provide a commercial advantage over a competitor, increasing market share or helping to position a company in new markets, ultimately increasing sales and revenue.
- Increased shareholder value: By taking action on water that ensures the sustainability of your business, whether through brand reputation, operational improvements or safeguarding against regulatory changes may contribute directly or indirectly to increased shareholder value.
- Staff retention: By associating a company’s brand in a positive way in local water issues, a company can maintain a working environment that supports current staff. By enhancing staff job satisfaction, a company can substantially reduce costs in hiring and training new staff.
- Social license to operate: Working with local communities or maintaining/improving brand reputation with customers or the general public in relation to water issues may help to maintain a social license to operate in regions of increasing water stress.
Other
- Carbon management: Greater investment in water efficiency can contribute to a reduction in carbon emissions and help achieve emission reduction targets especially in industries that are water-intensive.
- Implementing adequate sanitation: Investment in building adequate sanitation protects the surrounding water bodies, the environment, and community from infectious disease. Circular sanitation systems can provide additional returns in the form of recycled water, energy, or fertilizers.
(W4.3b) Why does your organization not consider itself to have water-related opportunities?
Question dependencies
- This question only appears if you select “No” or “Yes, we have identified opportunities but are unable to realize them” in response to W4.3.
Change from 2019
No change
Rationale
Investors and other data users are interested to know whether you are aware of water-related opportunities. An explanation of why your organization has concluded that it is not exposed to opportunities is crucial for understanding how your business strategy is aligned with water issues.
Response options
Please complete the following table:
| Primary reason
|
Please explain
|
|
Select from:
- Opportunities exist, but we are unable to realize them
- Opportunities exist, but none with potential to have a substantive financial or strategic impact on business
- Evaluation in progress
- Judged to be unimportant
- No instruction from management to seek out opportunities
- Not yet evaluated
- Other, please specify
|
Text field [maximum
2,500 characters]
|
Requested content
Primary reason (column 1)
- Select the reason that best describes why you consider your organization not exposed to water-related opportunities, or why you have been unable to realize them.
- If you select “Other, please specify”, provide a label for the reason.
Please explain (column 2)
- Explain further why there are no apparent water opportunities for your company how you assessed them, and if relevant to your selection in column 1:
- give reasons why your organization considers there to be no water-related opportunities for your organization
- make reference to how you defined “opportunities
- include how you have defined ‘substantive’ impact in the context of an opportunity and reference the definition of substantive impact you gave in W4.1a if applicable
- describe when you will next repeat an assessment of opportunities
- include specific reasons why you have not yet conducted a risk assessment/why it is considered unimportant for your business
- provide any other company-specific details such as your evaluation process.
W5 Facility-level water accounting
Module Overview
The module is only presented if companies have reported in W4 that they have facilities exposing the company to risk. It asks companies to disclose water accounting data at facility level – only for sites exposing the company to a potential substantive change (as defined in W4.1a and reported in W4.1c). This is why this accounting data is requested after risks have been disclosed and is not included with the corporate level accounting questions in Module 1.
Data users are interested in a company’s ability to measure, monitor, and disclose this granular accounting data as a proxy for sound risk assessment and management at the facility and corporate level. Limiting this disclosure to ‘at risk’ facilities helps a company to focus its understanding of how it uses and impacts water resources at ‘hotspot’ locations. Given the local nature of water risks, reporting at this level is considered as good practice. For any facilities for which you do not have data, please leave the field blank. Emphasis should be placed on reporting transparently and providing an explanation for lack of measured data, uncertainty in your data or estimated data.
Disclosure note:
- All organizations are advised to refer to the CDP Technical Note on water accounting definitions when responding to this module.
- You will need to complete this section only if you completed W4.1c because you have facilities exposed to water risks that have the potential to generate a substantive change to your business. CDP is not asking for information for all facilities, just those exposed to substantive water risk as defined in question W4.1a.
- The number of sites you provide this water accounting data for should be the same as the number of sites reported in section W4.1.
- Units: Volumes must be reported in megaliters per year (1 megaliter = 1 million liters or 1,000 m3) in all questions, unless otherwise stated.
- Blank cells: Please ensure when responding to these water accounting questions that cells are only intentionally left blank if you have no data to disclose. Blank cells are interpreted as non-disclosure, i.e. information is not available due to lack of measurement or a choice not to disclose, and are therefore awarded no points by the scoring methodology.
- Values of zero: entering a zero implies a measurement has been made, and the value is zero. Do not enter a zero if no data is available.
- Data accuracy: CDP recognizes that there may be uncertainty linked to water accounting information that could impact on data accuracy. Uncertainty can arise from data gaps, assumptions, metering/measurement constraints including equipment accuracy, data management, etc. The emphasis should be on reporting transparently and on providing an explanation for why reported data is uncertain or wholly or partially estimated or modelled, rather than sourced from direct measurements.
Key changes
- Question removed from 2019 questionnaire: W5.1c on facility recycling and reuse volumes. The volumetric information provided limited insight on impact reduction and the practices can be reported elsewhere in the questionnaire.
- Three 2019 questions merged: Data points in W5.1a (columns 3-8), W5.1b (columns 3-6) have been merged into W5.1 to eliminate repeating columns.
- Modified question (W5.1): New column “Located in area with water stress” allows organizations to demonstrate awareness of whether their facilities are located in potentially high impact locations. Creates closer alignment with other reporting frameworks such as GRI, SASB, and TCFD.
- Modified guidance (W5.1): Requested content clarified for “anticipated future trends".
- Click here for a list of all changes made this year.
Sector-specific content
- W5.1: Additional response options for Electric Utilities and Oil & Gas.
Pathway diagram - questions
This diagram shows the questions contained in module W5. To access question-level guidance, use the menu on the left to navigate to the question.
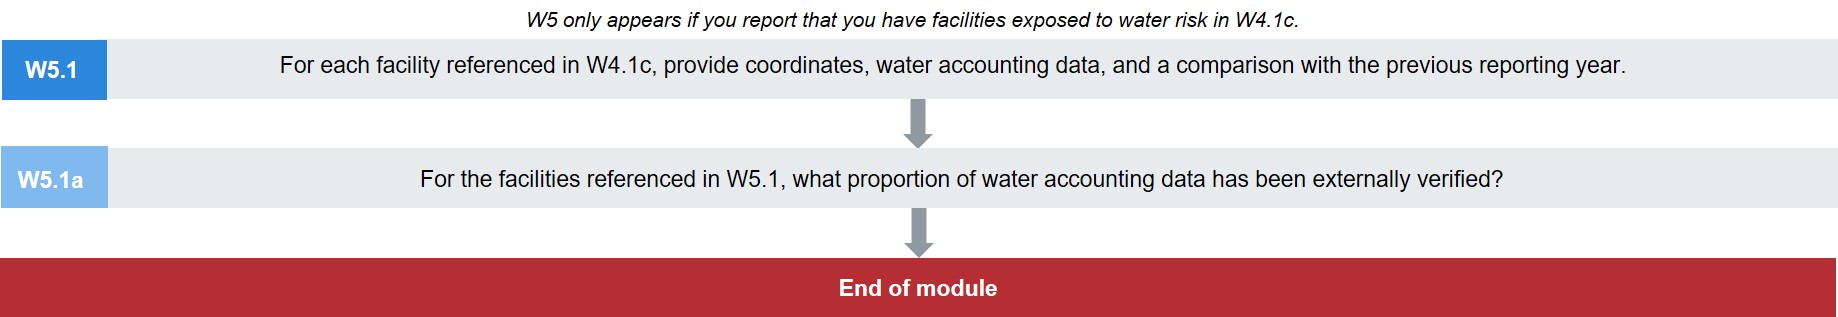
Pathway diagram - questions for minimum version questionnaire
This diagram shows the questions contained in module W5 that are included in the minimum version of the questionnaire. To access question-level guidance, use the menu on the left to navigate to the question.
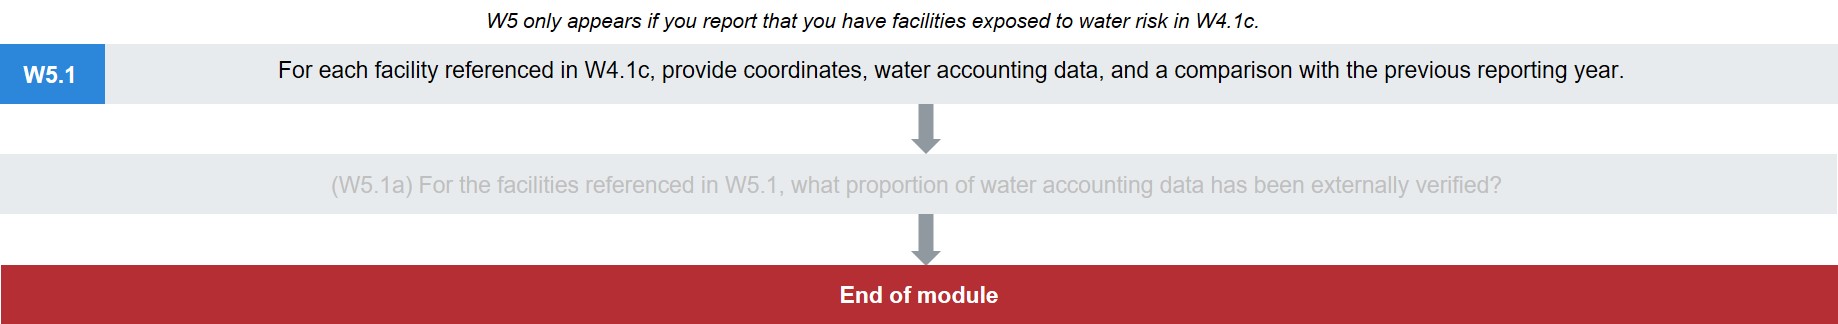
Facility-level water accounting
(W5.1) For each facility referenced in W4.1c, provide coordinates, water accounting data, and a comparison with the previous reporting year.
Question dependencies
- This question only appears if you report that you have facilities exposed to water risk in W4.1c.
- Your response to W5.1 prompts W5.1a.
Change from 2019
Modified question
Rationale
Reporting information on facilities exposed to water-related risks helps CDP data users have confidence that your organization is monitoring local water aspects at the corporate level. It provides insight to dependency on different sources and potential impacts associated with water discharges. For example, withdrawing from an overdrawn freshwater aquifer rather than from seawater will have significantly different consequences for local areas with water stress and an organization's water security. In regions where water sources are highly restricted, the organization's water consumption patterns can influence relations with other stakeholders.
Providing facility-level information is useful for demonstrating regulatory compliance (e.g., discharges to the local environment), for risk assessments and for providing insight to risk responses (e.g., tracking water efficiency improvements).
CDP requests the geo-location coordinates for your facilities exposed to a risk that is substantive at the corporate level. This enables CDP data users to analyze geographically linked risks and to do so across multiple companies. This also makes possible the integration of CDP’s water data with other geographically linked data.
Connection to other frameworks
GRI
Standard 303-3: Water withdrawal
SDG
Goal 6: Clean water and sanitation
Goal 7: Affordable clean energy
Response options
Please complete the following table. You are able to add rows using the “Add Row” button at the bottom of the table.
|
Facility reference number
|
Facility name (optional)
|
Country/Area
|
River basin
|
Latitude
|
Longitude
|
Located in area with water stress |
Select from:
- Facility reference numbers: 1-50
|
Text field [maximum 500 characters]
|
Select from:
- Country/area drop-down list
|
Select from:
- River basin drop-down list
- Other, please specify
|
Numerical field [enter
a number from 0 to +/-90.000000 using a maximum of six decimal places]
|
Numerical field [enter
a number from 0 to +/-180.000000 using a maximum of six decimal places]
|
Select from: |
[ELECTRIC UTILITIES SECTOR ONLY]
Primary power generation source for your electricity generation at this facility | [OIL & GAS SECTOR ONLY]
Oil & gas sector business division
| Total water withdrawals (megaliters/year) at this facility
| Comparison of total withdrawals with previous reporting year
| Withdrawals from fresh surface water, including rainwater, water from wetlands, rivers and lakes | Withdrawals from brackish surface water/seawater | Withdrawals from groundwater - renewable |
|---|
Select from: - Coal – hard
- Lignite
- Oil
- Gas
- Biomass
- Waste (non-biomass)
- Nuclear
- Fossil-fuel plants fitted with carbon capture and storage
- Geothermal
- Hydropower
- Wind
- Solar
- Marine
- Other renewable
- Not applicable
| Select all that apply:
- Upstream
- Midstream/Downstream
- Chemicals
- Other, please specify
- Not applicable
| Numerical field [enter a number from 0-999,999,999,999 using a
maximum of two decimal places]
| Select from:
- Much lower
- Lower
- About the same
- Higher
- Much higher
- This is our first year of measurement
| Numerical field [enter a number from 0-999,999,999,999 using a maximum of two decimal places]
| Numerical field [enter a number from 0-999,999,999,999 using a maximum of two decimal places]
| Numerical field [enter a number from 0-999,999,999,999 using a maximum of two decimal places]
|
| Withdrawals from groundwater - non-renewable | Withdrawals from produced/entrained water | Withdrawals from third party sources | Total water discharges (megaliters/year) at this facility | Comparison of total discharges with previous reporting year | Discharges to fresh surface water |
|---|
| Numerical field [enter a number from 0-999,999,999,999 using a maximum of two decimal places] | Numerical field [enter a number from 0-999,999,999,999 using a maximum of two decimal places] | Numerical field [enter a number from 0-999,999,999,999 using a maximum of two decimal places] | Numerical field [enter a number from 0-999,999,999,999 using a maximum of two decimal places] | Select from: - Much lower
- Lower
- About the same
- Higher
- Much higher
- This is our first year of measurement
| Numerical field [enter a number from 0-999,999,999,999 using a maximum of two decimal places] |
| Discharges to brackish surface water/seawater | Discharges to groundwater | Discharges to third party destinations | Total water consumption (megaliters/year) at this facility | Comparison of total consumption with previous reporting year | Please explain |
|---|
| Numerical field [enter a number from 0-999,999,999,999 using a maximum of two decimal places] | Numerical field [enter a number from 0-999,999,999,999 using a maximum of two decimal places] | Numerical field [enter a number from 0-999,999,999,999 using a maximum of two decimal places] | Numerical field [enter a number from 0 to +/-999,999,999,999 using a maximum of two decimal places] | Select from: - Much lower
- Lower
- About the same
- Higher
- Much higher
- This is our first year of measurement
| Text field [maximum 1,500 characters] |
[Add Row]
Requested content
- Note: Organizations responding to an electric utilities, metals & mining, or oil & gas sector request should refer to additional sector-specific guidance on this question at the end of the "Requested content" section.
General
- This question asks for water accounting data only for your facilities exposed to substantive water risk (according to the definition you provided in W4.1a) – not for all your facilities.
- Please refer to CDP's water accounting definitions before completing this question.
- Enter data for each facility (or groups of facilities) you identified in W4.1c as being exposed to risk. The table has a maximum of 50 rows. If you reported more than 50 facilities at risk in question W4.1c, you should use the 'Please explain' column of the first row here to indicate how you have selected the 50 facilities for this question; for example 'We reported more than 50 facilities in module W4 so we are providing water accounting data for our 50 facilities with potential to impact most on our global revenue' or 'We reported more than 50 facilities in module W4 so we are providing water accounting data for our 50 facilities with the highest water withdrawals'.
- Please report volumetric data in megaliters per year for the reporting year (the time period you stated in response to W0.2). (1 megaliter = 1 million liters or 1000 m3).
- If you are estimating or extrapolating to provide complete coverage, please give an explanation in column 3 (Please explain). Please remember that a zero should only be used for reporting zero volumes and not for an absence of data.
- If you do not have a figure for any of the facilities you disclose here, you may provide an estimate. Explain this in the last column (Please explain). For withdrawals, data may be collected from several sources, including “water meters, water bills, calculations derived from other available water data or the organization’s own estimates (if neither water meters nor bills or reference data exist).
- Before deciding whether your withdrawals, discharges or consumption can be reported as “zero”, please refer to CDP’s water accounting definitions. This may be the case, for example, if a closed water circuit is in operation.
- If reporting “zero consumption” please remember to check your discharge volumes. Scorers will check that discharge and withdrawals volumes balance (approximately).
- Cooling water: Cooling water (freshwater or sea water) is often withdrawn in large quantities and discharged back to its original source with negligible losses or variation in quality. However, this volume should be included in your water accounts.
- Rainwater: If a company is managing rainwater (for example, by harvesting for use or storage, or to prevent flooding), or is dependent on it for production of goods or the delivery of services, it should try to estimate and disclose it as a withdrawal from the hydrological system into the company boundary. Note that in some jurisdictions rainwater is considered a withdrawal source and organizations are required to report its collection and use.
- Companies may choose to exclude collected rainwater and domestic sewage from their water withdrawal/discharge volumes only if the resulting error in their water balance would be less than 5%. (This avoids your discharge volumes being larger than your withdrawals).
- Including rainwater helps companies better understand their water dependency and risks. For some companies, precipitation/rainwater volumes may constitute a principal input of water at site level. This includes run-off where it has to be managed. In these cases, excluding rainwater from water accounting – withdrawal and discharge - would not be a true reflection of site water balance. In addition, there may be reduced impacts from using rainwater in place of other local freshwater sources.
Facility reference number (column 1)
- This CDP facility reference number is used to track information related to the same facility in subsequent questions. It is not specific to your organization, however it does prevent you from having to repeat contextual information e.g. river basin and facility name.
Facility name (column 2)
- You may use the text box to provide a name for the facility. This is to ease reporting and analysis. This name should be used for the same facility throughout the questionnaire.
Country/Area (column 3)
- Note that a selection must be made for both column 3 and column 4. Your data will not be saved if either column is left blank.
River basin (column 4)
- From the drop-down options provided, select the river basin where the facility is located. If you do not see the basin required, select “Other, please specify” and write in one river basin only using the text box provided.
- For companies withdrawing water from large confined aquifers that may not discharge to the river basin they are located in e.g. Ogallala aquifer in the United States, please select “Other, please specify” and type in the name of the local aquifer source. Ensure that the correct country/area name is selected in column 3 (Country/Area).
- You may want to put the sub-basin of a bigger river basin identified in the drop-down menu. In this case use the “Other, please specify” option in the following format: “Putumayo, Amazon”.
- If you select “Other, please specify”, provide a label for the river basin.
- For full instructions see the Introduction to CDP's water security reporting guidance.
- Note that a selection must be made for both column 3 and column 4. Your data will not be saved if either column is left blank.
Latitude (column 5)
- Enter the latitude coordinates for the facility reported in column 1. Your response should be in the format of decimal degrees and can range from 0 to +/-90.000000.
- If you are disclosing for a cluster of facilities (in accordance with the guidance for W4.1b), you may provide the coordinates for the facility with the largest total withdrawal volumes.
Longitude (column 6)
- Enter the longitude coordinates for the facility reported in this row. Your response should be in the format of decimal degrees and can range from 0 to +/-180.000000.
- If you are disclosing for a cluster of facilities (in accordance with the guidance for W4.1b), you may provide the coordinates for the facility with the largest total withdrawal volumes.
Located in area with water stress (column 7)
- Credible, publicly available methodologies for classifying an area as water stressed include the WRI Aqueduct Water Risk Atlas and WWF Water Risk Filter. Refer to the guidance for W1.2d for more details.
- As good practice, a water-stressed area must be evaluated as a minimum at catchment level.
- Commonly accepted indicators and the thresholds for water stress that should be used to report to CDP include:
- Baseline water stress - higher values indicate more competition among users; equal to/greater than 'High': 40-80%
- Baseline water depletion - higher values indicate larger impact on the local water supply and decreased water availability for downstream users; equal to/greater than 'High': 50-75% (WRI Aqueduct)
- Water depletion - higher values indicate larger impact on the local water supply and decreased water availability for downstream users; equal to/greater than 75% on an annual, seasonal, and inter-annual timescale (WWF Water Risk Filter)
- These indicators account for water stress in terms of the quantity of water resources available. There are currently no commonly used tools/indicators which also take account of accessibility and water quality.
Comparison with previous reporting year (columns 11, 19, 25)
- CDP does not define the threshold for considering a value as ‘much higher’ rather than simply ‘higher’ (or ‘much lower’/’lower’). CDP requests this information from many different industries with huge variations in water use, and it would therefore be difficult to provide a universal threshold that is meaningful (as proportions will equate to different absolute values and impacts).
- You should define your own threshold for what is ‘much higher’ (and ‘much lower’) and apply it consistently so that each year the reported data for this question is comparable and data users can track your water accounts more effectively. A company-specific explanation for these thresholds should be provided in the last column ("Please explain").
- If your response is an estimate, please explain why in the last column.
Withdrawals from fresh surface water, including rainwater, water from wetlands, rivers, and lakes (column 12)
- For the purposes of this disclosure you should include all surface water sources of a higher quality than brackish (i.e., a TDS lower than 10,000 mg/l).
Total water discharges at this facility (megaliters/year) (column 18)
- Zero discharge permit: If your organization has a zero discharge permit, please consider any discharges that may exist outside this permit and may still be relevant to CDP’s definition of discharges.
- Domestic sewage: Domestic sewage is only regarded as water discharge if excluding it would result in an error in your balance of more than 5%. This may be significant for healthcare residential properties or hotels, for example.
- Aquifer reinjection: Reinjection to aquifers should be considered as a discharge to groundwater.
- Soakaway: Water returning to a groundwater source via a soakaway should be considered as a discharge.
Please explain (column 26)
- Please comment on the location coordinates, as required. If the facility is an aggregate of multiple locations, ensure that you explain how your methodology for aggregating facilities was applied here.
- If 'Yes' or 'No' was selected in column 7, indicate the tool used to classify the location of the facility as water stressed.
- To assist CDP data users to understand a facility’s water use, you should explain the volumetric data and trends that you report for withdrawals, discharges and consumption and include company-specific information.
- Describe the thresholds for what is ‘much higher’ and ‘much lower’ for the change in volume for each water aspect compared to the previous year. You should account for the change compared to last year and also indicate the anticipated future trends for these volumes, if known (note that future trends should be at least one year after the end of the reporting year provided in W0.2).
- Report whether your volumes for each facility are estimated, modelled, or sourced from direct measurements. If estimation or modelling has been used, report the estimation or modelling methods. If there is any level of uncertainty in your response, or if there is an estimated figure, you should explain it in this field and give the range of uncertainty
- Include any contextual information necessary to understand how the volumetric data have been compiled, such as any standard methodologies used and any assumptions made.
- For ‘Withdrawals from fresh surface water’, it is important that you state which sources apply (rainwater, water from wetlands, rivers and lakes, etc.). Also state if the withdrawal volume for each source is increasing or decreasing. Note: if your use of rainwater equates to more than 5% of your water balance please explain if it is harvested, treated, etc.
- For ‘Third party sources’, specify whether the third party is a municipal supplier or another type of third party organization.
- For discharges to ‘Third party destinations’, state if this includes water to other organizations for further use.
- To give data users confidence in your response, please explain any zero volumes.
- If you have left any column blank because you do not have the data, please describe the barriers to reporting that data and any plans to collect and report it.
- Note: CDP expects withdrawals, discharges and consumption figures to balance (approximately; +/- 5%) so if there is a good reason why this cannot happen, it should be explained in here.
Please explain – additional guidance for consumption volume
- Regarding your water consumption figure, you should indicate if your figure is based on local measurements or is a calculation (for example using withdrawals minus discharges).
- If known, you may provide breakdown of this figure (with reference to CDP’s definition of consumption) including:
- Volume incorporated into products, crops or waste;
- Volume evaporated or transpired;
- Volume consumed by humans or livestock;
- Net volume stored in a controlled manner;
- Net volume stored for future use;
- Volumes otherwise excluded from discharges out of the organization’s boundary.
- It is important that you explain a negative consumption figure where this is the case. This would indicate that your discharges are larger than your withdrawals for the reporting year - due to a net release of water from storage, for example.
Sector-specific guidance for electric utilities sector
General
- This guidance is specific to companies responding to an electric utilities sector request. You should first read the guidance for this question that applies to all companies. This is additional to the general guidance and does not replace it.
Primary power generation source for your electricity generation at this facility (column 8)
- Choose “Not applicable” if this facility is not an electricity generation facility.
Total water withdrawals at this facility (megaliters/year) (column 10)
- CDP recognizes the difficulty in accounting for some elements of the hydropower operations’ water balance, specifically surface runoff or elements that are outside the organization’s control such as third-party discharges into the reservoir (for example a municipal waste water treatment plant discharging into the reservoir).
Water withdrawals into hydropower operations includes river inflow, surface runoff and precipitation onto the reservoir surface, as well as third-party discharges into the reservoir:
W = Precipitation + River Inflow + Runoff + Third-party discharges into reservoir
Organizations should strive to include volumes for those sources if they would result in an estimated error in their water balance of more than 5% (specifically the sum of the withdrawals you report) and take a consistent approach throughout the questionnaire. In the last column (Please explain) you should indicate which sources you have included or excluded. Note that estimation or modelling are valid sources of data.
Total water discharges at this facility (megaliters/year) (column 18)
- CDP recognizes the difficulty in accounting for some elements of the hydropower operations’ water balance, specifically seepage or those that are outside the organization’s control such as third-party withdrawals.
In hydropower operations, water discharge includes the dam outlet and the spillway, underground seepage and third-party withdrawals from the reservoir (for example a municipal water plant abstracting from the reservoir).
D = Dam outlet + Spillway + Seepage + Third-party withdrawals from the reservoir
Organizations should strive to include volumes for those destinations if they would result in an estimated error in their water balance of more than 5% (specifically the sum of the discharges) and take a consistent approach throughout the questionnaire. In the last column ("Please explain") you should indicate which destinations you have included or excluded. Note that estimation or modelling are valid sources of data.
Total water consumption at this facility (megaliters/year) (column 24)
- Water consumption in hydropower operations includes evaporation from the reservoir surface as well as the balance between withdrawals and discharges. Although organizations should estimate evaporated volumes, you may consider variations in storage as a valid measure of your consumption volumes rather than calculating evaporation and the balance between all withdrawals and discharges. This information is usually easily derived from water level measurements.
- In the last column ("Please explain") provide your approach to reporting a total consumption figure.
Please explain (column 26)
- If any of the facilities reported are hydropower operations, indicate which elements of water withdrawals (river inflow, surface runoff, precipitation onto the reservoir surface and third-party discharges into the reservoir), discharges (spillway, underground seepage and third-party withdrawals from the reservoir) and consumption are you taking into account when providing your response.
- Indicate the method followed to obtain it, e.g. direct monitoring, estimation from a hydrological model or other secondary source of information.
- Explain if any changes in the water discharge volumes are related to higher/lower electricity production or other reasons related to water resources management such as flood control, satisfaction of downstream demand, etc.
- Additionally, you may choose to specify the total evaporated volumes from the reservoir if your organization collects this data.
Sector-specific guidance for metals & mining sector
General
- This guidance is specific to organizations responding to a metals & mining sector request. You should first read the guidance for this question that applies to all organizations. This is additional to the general guidance and does not replace it.
- Data on the production value associated with these facilities will provide further information on the potential implications of the water risk exposure and assist with the assessment of the organization’s response.
- Rainwater: Please note that in the mining industry precipitation/rainwater volumes may constitute a principal input of water at site level. Excluding rainwater from water accounting would not be a true reflection of site water balance.
- Brackish water/seawater withdrawals or discharges: Low quality water withdrawals or discharges (categories 2 and 3 of the Water Accounting Framework from the Mineral Council of Australia) should be reported in columns 13 and 21 (Brackish water) respectively.
- Groundwater withdrawals: Groundwater withdrawals are linked to extraction from bore holes and aquifer interception, i.e. groundwater is water that is extracted as part of ore body dewatering during mining operations.
- Produced/entrained water withdrawals: In the metals & mining sector, entrained water refers to the volumes of water in the raw material, typically ore to be processed.
- Groundwater discharges: Discharges to groundwater refer to seepage or aquifer reinjection discharge volumes. This aligns with the Water Accounting Framework from the Mineral Council of Australia.
- Water diversions: In line with CDP’s definition of water withdrawals and discharges, for the metal & mining sector, water withdrawals and discharges include water diversions to enable comparability – because it is water that crosses the company boundary.
- Evaporation: In line with CDP’s definition of water consumption, evaporation from open water surfaces should be reported as part of the water consumption volumes.
- Water entrained in waste material: In line with CDP’s definition of water consumption, water entrained in waste material (such as tailings, coarse rejects, and concentrates) that leaves the company boundary should not be considered discharges but as part of the consumption volumes.
Sector-specific guidance for oil & gas sector
General
- This guidance is specific to companies responding to an oil & gas sector request. You should first read the guidance for this question that applies to all companies. This is additional to the general guidance and does not replace it.
- As water withdrawals, consumption, and discharges will vary according to business division, a business division column has been added to provide data users on the type of facility being reported on. This provides useful context for the volumes reported.
- Groundwater withdrawals: As part of groundwater withdrawal volumes (be it from renewable or non-renewable sources), organizations should include all withdrawals from aquifers (other than the formation being exploited). These withdrawals may be intended for any use in the organization, including its reinjection to maintain well pressure or as part of the fracture fluids.
- Produced water: In the oil & gas sector, the reporting of water withdrawals volumes typically does not include produced water. To enable comparability, CDP requires all companies to include produced water volumes in their withdrawals disclosure, in order to have an accurate water balance.
- Groundwater discharges: In oil production, as part of secondary and tertiary recovery operations, water-based fluids (from various sources) may be used to maintain the pressure, and to displace the hydrocarbons and move them towards the production wells. For CDP disclosure, organizations must report these volumes as discharges to groundwater bodies, to enable comparability and have an accurate water balance.
Oil & gas sector business division (column 9)
- Select the option “Not applicable” for any facilities not belonging to the oil & gas sector.
- If you select "Other, please specify”, please provide a label for the business division in the text field provided.
Explanation of terms
- Facility: “Facilities” may be used throughout this questionnaire as a broad term and not restricted to a particular site or grouping of fixed buildings and factories. For example, if your organization is in the extractive industries you might normally collate business information for assets or business units, and so you may wish to define ‘facility’ information in this way.
- Facility boundary:This is a management boundary, rather than a physical boundary or a legal entity. Water is considered to have crossed the boundary of your facility when your organization in any way uses it, comes into contact with it, is required to manage it or when it becomes incorporated into your products. It therefore includes any water use and management by your organization outside of the physical fence of a facility; for example, to provide a street cleaning service or when used in fields that are remote from a processing plant.
- Facility reference number: The facility reference number is used to track information related to a facility that is disclosed in different questions. The number is not specific to an organization, but simply avoids an organization having to repeat contextual information such as river basin and facility name.
- Latitude and longitude:Geographic coordinates that specify, respectively, the north-south and east-west position, of a point on the Earth's surface. They are expressed as angular measures and thus, latitude can vary from 0 to +/-90 and longitude from 0 to +/-180.
- Fresh surface water, including rainwater, water from wetlands, rivers and lakes: Water that is naturally occurring water on the Earth's surface in ice sheets, ice caps, glaciers, icebergs, bogs, ponds, lakes, rivers and streams, and has a low concentration of dissolved solids.
For the purposes of reporting water accounting data to CDP, this surface water source includes water of a quality generally acceptable for, or requiring minimal treatment to be acceptable for, domestic, municipal or agricultural uses (at least <10,000 mg/l TDS, though a range of additional quality properties may also be considered). ‘High quality’ fresh water sources considered acceptable for potable use are typically characterized as having concentrations of dissolved solids less than 1,000 mg/l.
- Brackish surface water/seawater: Surface water in which the concentration of salts is high and far exceeds normally acceptable standards for municipal, domestic or irrigation use (at least higher than 10,000 mg/l TDS). Seawater has a typical concentration of salts above 35,000 mg/l TDS.
- Water withdrawal: The sum of all water drawn into the boundaries of the organization (or facility) from all sources for any use over the course of the reporting period.
- Withdrawals from groundwater (renewable): Water which is being held in, and can be recovered from, an underground formation. Renewable groundwater sources can be replenished within 50 years and are usually located at shallow depths.
- Withdrawals from groundwater (non-renewable): Water which is being held in, and can be recovered from, an underground formation. Non-renewable groundwater has a negligible rate of natural recharge on the human time-scale (more than 50 years), and is generally located at deeper depths than renewable groundwater. This is sometimes referred to as “fossil” water.
- Produced water: Water which enters the organization’s boundary as a result of the extraction, processing, or use of any raw material, so that it must be managed by the organization.
When reporting to CDP, this water should not be counted as recycled water when put to use within a single cycle of a business process. Examples of produced water include moisture derived from vegetation such as in sugar cane crushing and the water content in crude oil. (Note that companies with oil and gas activities should refer to CDP’s sector specific guidance for this water aspect).
- Produced water (Oil & gas sector only): Water that is brought to the surface during the production of hydrocarbons including formation water, flow-back water and condensation water (IPIECA “Oil and gas industry guidance on voluntary sustainability reporting”, 3rd edition, 2016).
- Third party sources: This includes water provided by municipal water suppliers, public or private utilities, and wastewater from any other organization.
- Water discharge: The sum of all water drawn into the boundaries of the organization (or facility) from all sources for any use over the course of the reporting period.
- Discharges to groundwater: Water which is being held in, and can be recovered from, an underground formation. Discharge to groundwater, by human activity or natural activity, refers to a destination beneath the soil surface, such as a water bearing layer of rock (aquifer). Examples of discharges to groundwater include disposal of sewage, trade effluent and surface water run-off from urban areas, through such methods as spreading basins, soakaways, swales or injection wells.
- Third party destinations: This includes municipal wastewater plants, public or private utilities, and other organizations involved in the transport, treatment, disposal or further use of wastewater. Note that to qualify as a third-party destination, “other organizations” using your wastewater must be outside your reporting boundary given in question W0.5. Any of your wastewater that has been treated on your own site should be reported as discharge according to its ultimate destination (for example, to groundwater), as this is where any potential risks for the company lie.
- Water consumption: The amount of water drawn into the boundaries of the organization (or facility) and not discharged back to the water environment or a third party over the course of the reporting period.
- Water diversions (Metals & mining sector only): According to the Water Accounting Framework from the Mineral Council of Australia water diversions are flows from an input to an output without being utilized by the operational facility. The flow is not stored with the intention of being used in a task or treated.
- Carbon capture and storage (CCS) (Electric utilities sector only): As defined by the IEA, a family of technologies and techniques that enable the capture of carbon dioxide (CO2) from fuel combustion or industrial processes, the transport of CO2 via ships or pipelines, and its storage underground, in depleted oil and gas fields and deep saline formations.
(W5.1a) For the facilities referenced in W5.1, what proportion of water accounting data has been externally verified?
Question dependencies
- This question only appears if you list facilities exposed to water risk in W5.1.
Change from 2019
Modified question (2019 W5.1d)
Rationale
Providing external verification for water accounting data at facilities exposed to water risks gives CDP data users increased confidence in the data you are reporting.
Response options
Please complete the following table:
|
Water aspect
|
% verified
|
What standard and methodology was used?
|
|
Water withdrawals – total volumes
|
Select from:
- Not verified
- 1-25
- 26-50
- 51-75
- 76-100
|
Text field [maximum 1,500
characters]
|
|
Water withdrawals – volume by source
|
|
|
|
Water withdrawals – quality
|
|
|
|
Water discharges – total volumes
|
|
|
|
Water discharges – volume by destination
|
|
|
|
Water discharges – volume by treatment method
|
|
|
|
Water discharge quality – quality by standard effluent parameters
|
|
|
|
Water discharge quality – temperature
|
|
|
|
Water consumption – total volume
|
|
|
|
Water recycled/reused
|
|
|
Requested content
General
- CDP recognizes the lack of universally applied verification standards for water accounting and therefore requests that you disclose the extent of any current verification practices and the standards used.
- Please note, in this question we are not asking about verification of water accounting data across your entire organization.
% verified (column 2)
- For the facilities reported on in W5 (facilities exposing your organization to substantive risk), select the proportion that have externally verified the water accounting aspect in column 1.
- If the accounting data at all facilities in your organization are verified, then you would be able to select 76-100% here. However, if only a sample of your facilities are verified, then you will need to check with your verifier on how many of the facilities at risk were included and then calculate the proportion of all facilities reported in W5.1 that this represents.
- If you select "Not verified", column 3 will not be presented.
What standard and methodology was used? (column 3)
- For the water aspects in column 1 that have been externally verified, provide details of the standard used to verify the accounting data including the methodology and scope (e.g. the sampling method where there was not 100% coverage).
Explanation of terms
- Verification (external): Procedure carried out by an independent third party for checking that a product, process, service or system meets the requirements specified by a recognized and relevant standard.
W6 Governance
Module Overview
This module captures the governance structure and mechanisms of your organization with regards to water security.
It provides data users with an understanding of the organization’s approach to water-related issues at the board level and below board-level.
Board-level oversight of water-related issues, a public water policy and processes for aligning external policy influence with it are considered good practice and an indication of the importance of water-related issues to the organization.
Key changes
- Two new questions: W6.4 and W6.4a on C-suite employee and board member incentives now presented to all responding organizations (not just high impact sector organizations) and two rows have been merged in W6.4a.
- Minimum version questionnaire: W6.4 added to align with CDP's climate change and forests questionnaires.
- Changes have been made to response options in this module. If you disclosed to CDP in the previous reporting year, please review your auto-populated responses carefully. It is your responsibility to ensure the accuracy and completeness of your current disclosure.
- Click here for a list of all changes made this year.
Sector-specific content
Pathway diagram - questions
This diagram shows the questions contained in module W6. To access question-level guidance, use the menu on the left to navigate to the question.
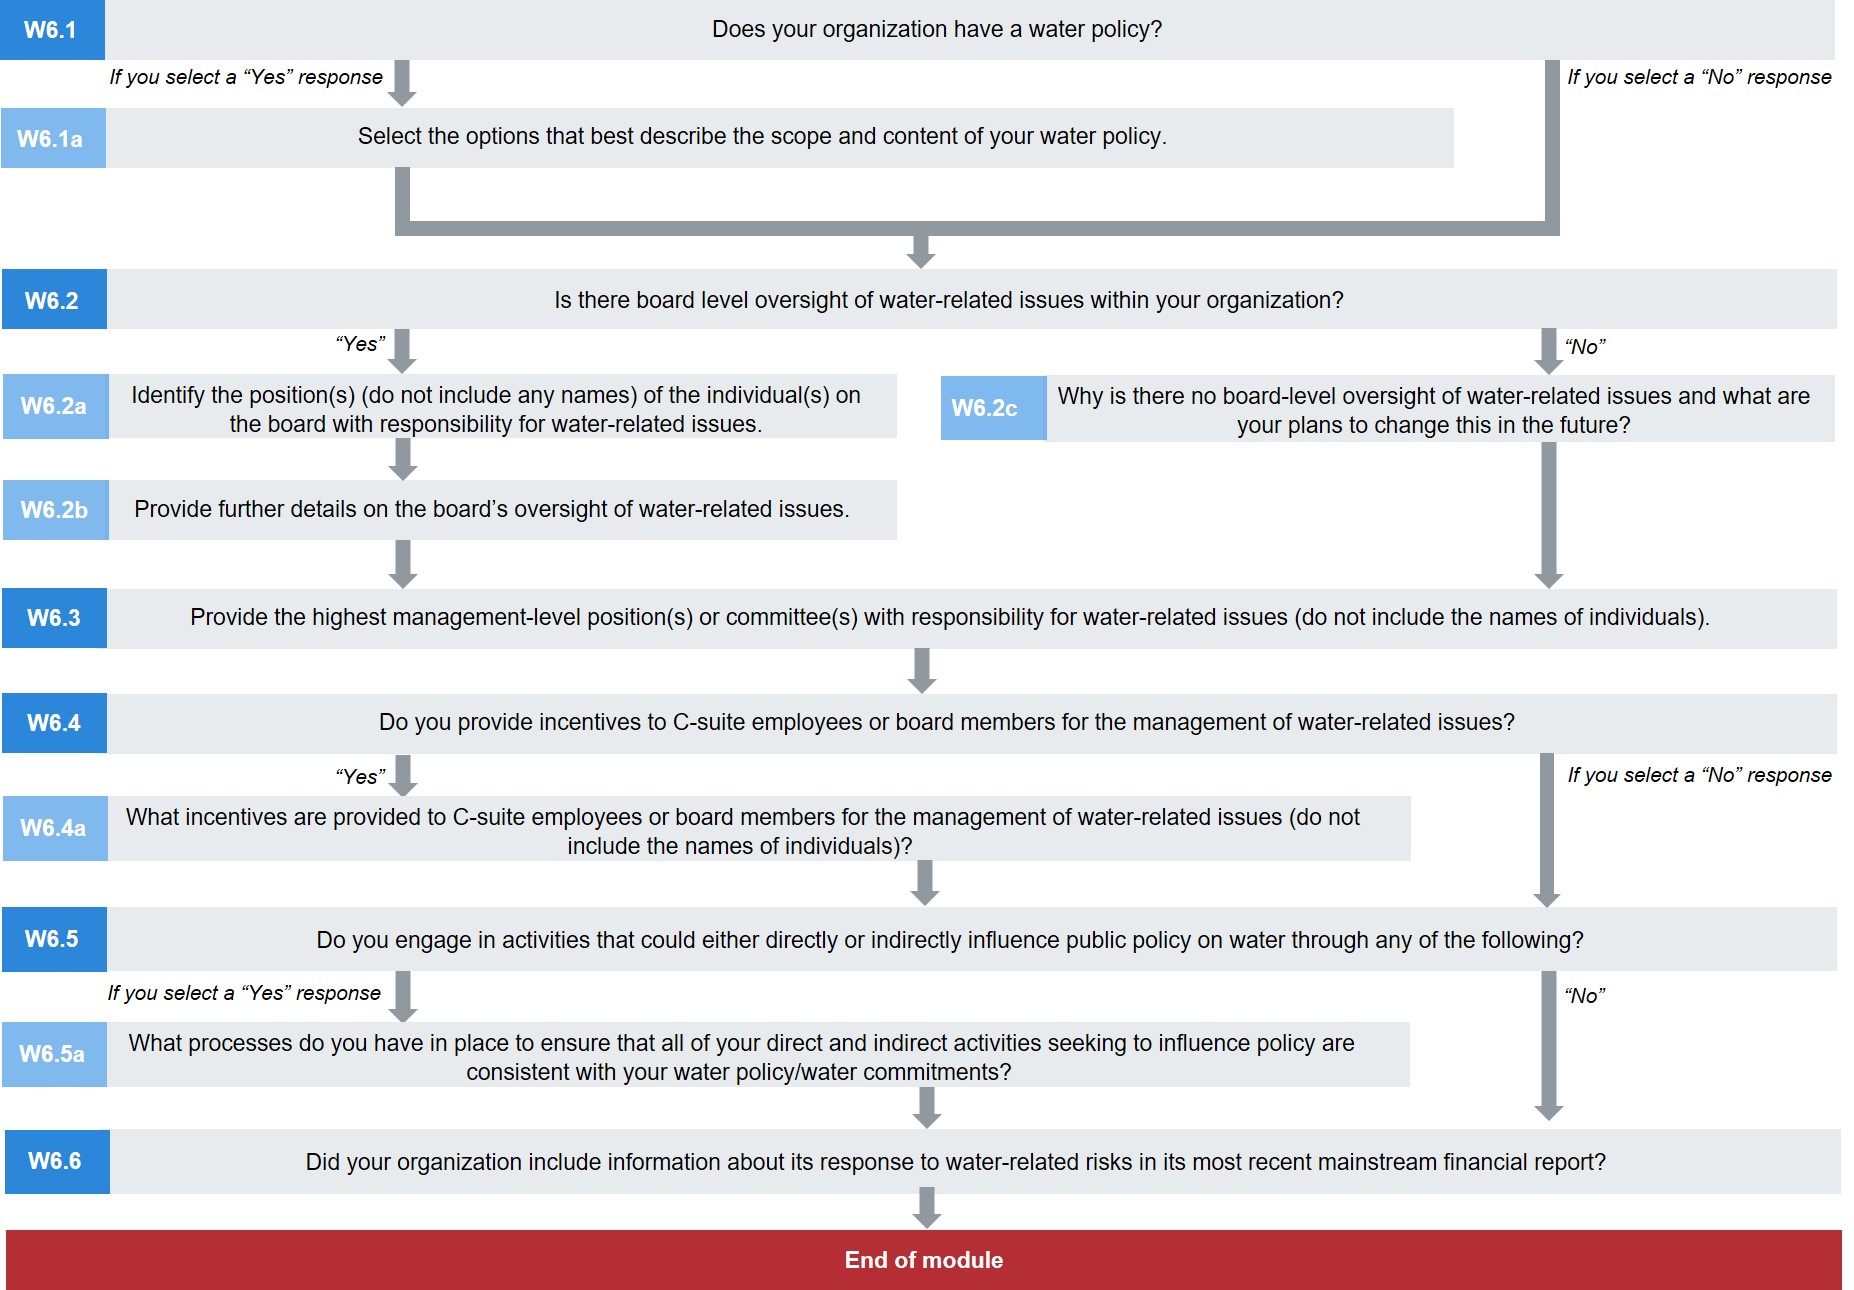
Pathway diagram - questions for minimum version questionnaire
This diagram shows the questions contained in module W6 that are included in the minimum version of the questionnaire. To access question-level guidance, use the menu on the left to navigate to the question.
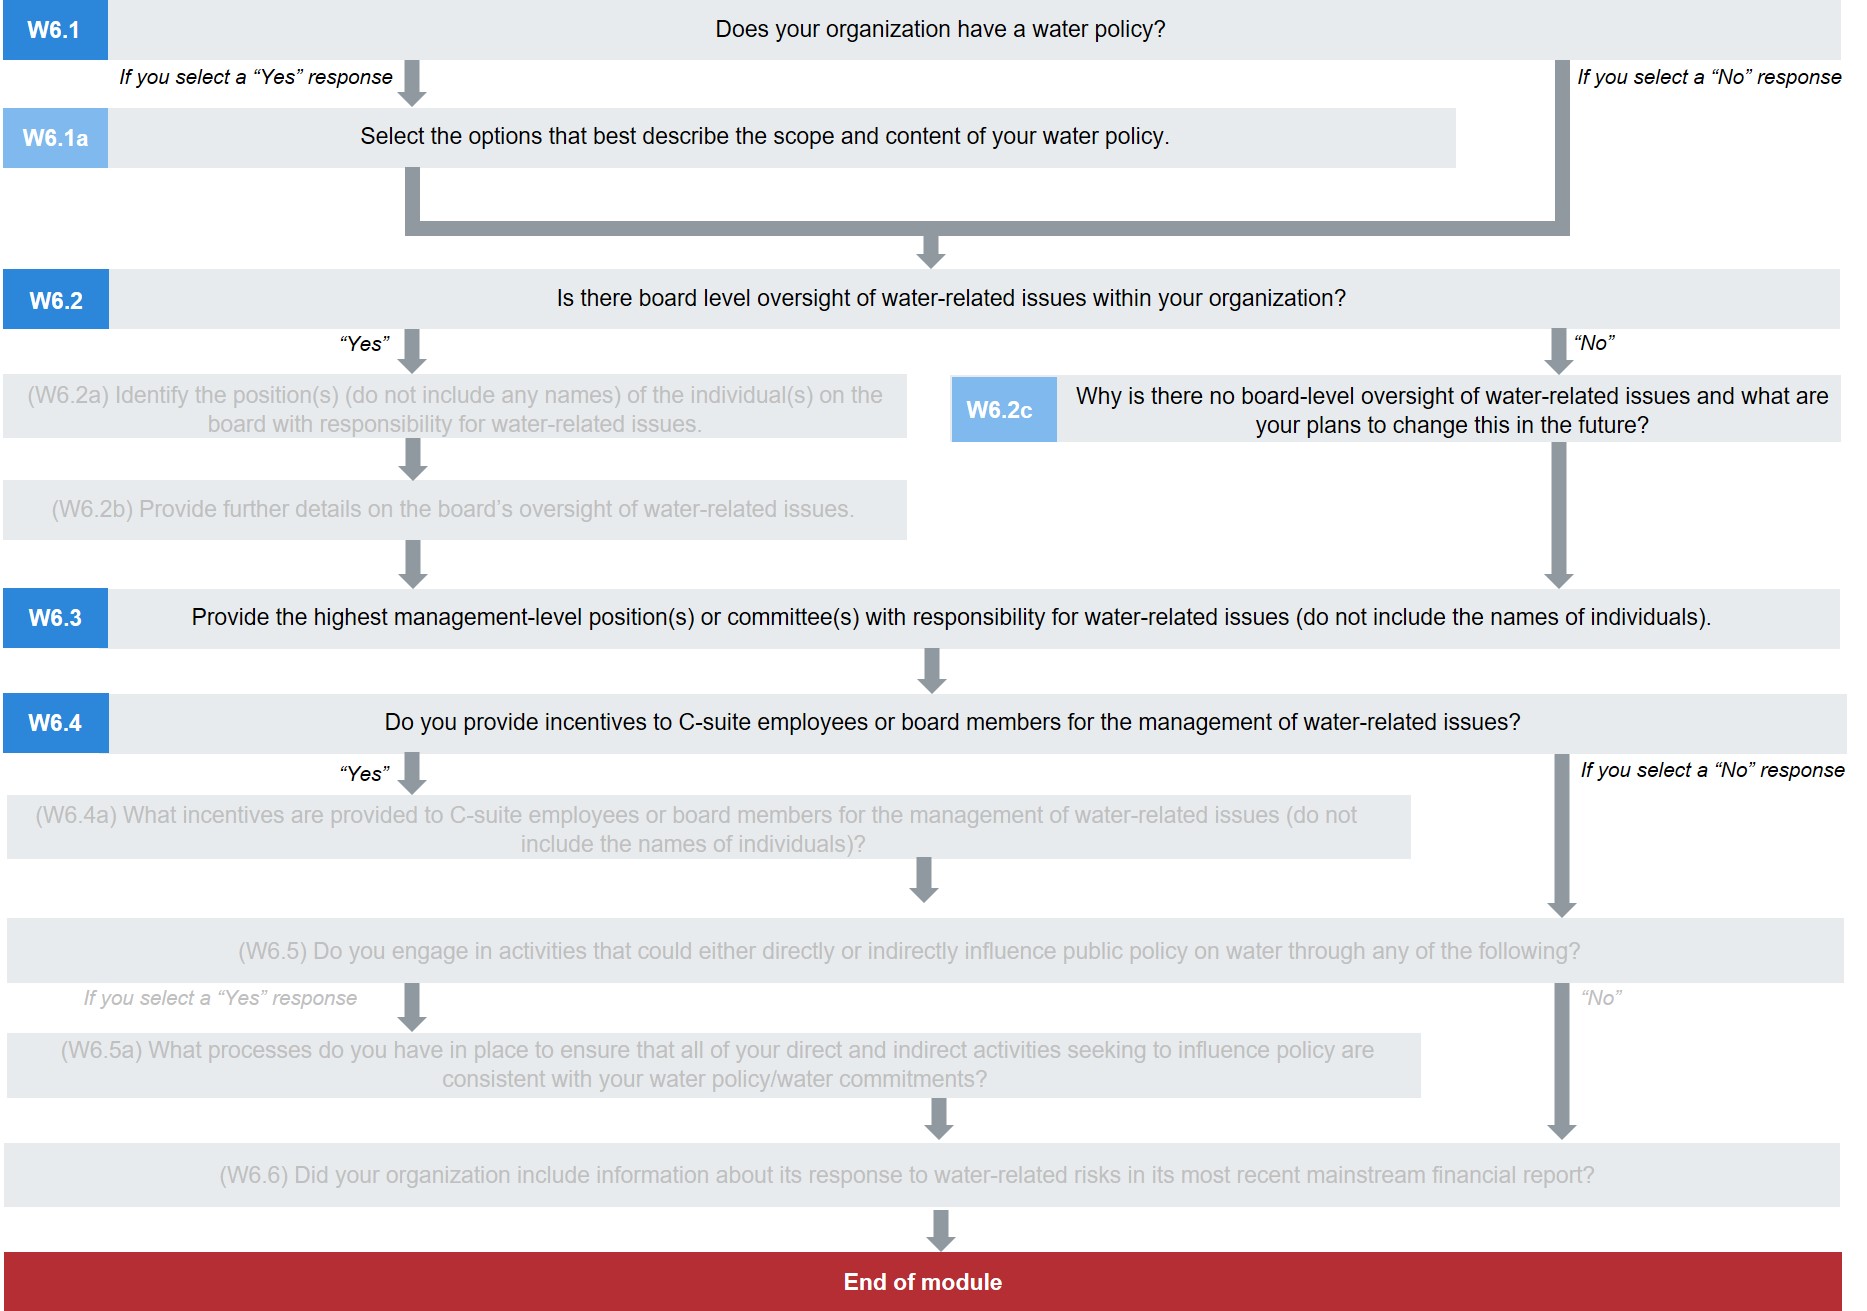
Water policy
(W6.1) Does your organization have a water policy?
Question dependencies
- Your response to W6.1 will determine if subsequent questions are presented in this section. If your response to W6.1 is amended, data in those dependent questions may be erased. In this case, be sure to re-enter data for all relevant questions. The guidance for each question indicates if it is a dependent question.
Change from 2019
No change
Rationale
CDP data users want to know that companies have articulated and documented a policy that:
- recognizes the importance of water-related issues to their business, and;
- sets out clear commitments, and guidelines for action and the integration of water into core business decision making and management processes.
For accountability to the organization’s stakeholders, the policy should be publicly available.
Connection to other frameworks
CEO Water Mandate
Response: Policies, governance and targets
Response options
Select one of the following options:
- Yes, we have a documented water policy that is publicly available
- Yes, we have a documented water policy but it is not publicly available
- No, but we plan to develop one within the next 2 years
- No
Requested content
General
- Click a ‘yes’ option if your organization has a water policy that articulates your water commitments and challenges, and the ways that action will be driven to meet those commitments.
- This may be a stand-alone water policy document, no matter what the title is, or an equivalent document that includes the company-wide water policy such as an ‘sustainability policy’.
- You should select ‘No’ if the above does not apply and indicate your plans.
- CDP understands that companies may additionally or otherwise integrate water matters to some extent into numerous other corporate policy and procedural documents such as supplier codes, agricultural policies, environmental standards and procurement policies. We are not asking for information about those here.
Explanation of terms
- Water policy: A statement of an organization’s water-related commitments, and the actions that will achieve them, that applies to all its activities.
(W6.1a) Select the options that best describe the scope and content of your water policy.
Question dependencies
- This question only appears if you select “Yes, we have a documented water policy that is publicly available” or “Yes, we have a documented water policy, but it is not publicly available” in response to W6.1.
Change from 2019
Minor change
Rationale
A water policy is a key governance tool. CDP understands that policies are likely to be varied and complex, but we wish to move companies towards good practice regarding content and communication of a policy that sets out:
- company-wide water commitments to water security;
- the challenges they face due to water-related issues; and
- the ways that action to meet those commitments and address the challenges will be driven, and integrated into core business decision making and management processes.
Connection to other frameworks
CEO Water Mandate
Response: Policies, governance and targets
Response options
Please complete the following table.
| Scope
|
Content
|
Please explain
|
|
Select from:
- Company-wide
- Select facilities, businesses, or geographies only
|
Select all that apply: - Description of business dependency on water
- Description of business impact on water
- Description of water-related performance standards for direct operations
- Description of water-related standards for procurement
- Reference to international standards and widely-recognized water initiatives
- Company water targets and goals
- Commitment to align with public policy initiatives, such as the SDGs
- Commitments beyond regulatory compliance
- Commitment to water-related innovation
- Commitment to stakeholder awareness and education
- Commitment to water stewardship and/or collective action
- Commitment to safely managed Water, Sanitation and Hygiene (WASH) in the workplace
- Commitment to safely managed Water, Sanitation and Hygiene (WASH) in local communities
- Acknowledgement of the human right to water and sanitation
- Recognition of environmental linkages, for example, due to climate change
- Other, please specify
|
Text field [maximum 2,500 characters] |
Requested content
General
- Provide details about the document (or other media) that articulates your water commitments and challenges, and the ways that action to meet those commitments will be driven.
- This may be a stand-alone water policy document, no matter what the title is, or another equivalent document that includes your water policy such as a ‘sustainability policy’.
Scope (column 1)
- Select the option that best applies to your organization’s water policy. If it covers your entire organization, please select ‘company-wide, otherwise chose “Select facilities, businesses, or geographies only” and give more details and an explanation in column 3.
Content (column 2)
- Select the options that apply to your organization’s water policy. If there is important content missing from the list, please select “Other, please specify” and provide a description. If you select “Other, please specify”, provide a label for the content.
Please explain (column 3)
- Give more details and an explanation for your selections in columns 1 and 2.
- You should include the rationale for the scope and content of your policy; e.g. why your water policy is not company-wide, and why it does not include some of the content listed.
Note:
- Attaching a policy document is optional but will help data users understand your public commitments to water security.
Example response
| Scope
|
Content
|
Please explain
|
|
Company-wide
|
- Description of business dependency on water
- Description of business impact on
water
- Description of water-related
performance standards for direct operations
- Description of water-related
standards for procurement
- Reference to international
standards and widely-recognized water initiatives
- Company water targets and goals
- Commitment to align with public
policy initiatives, such as the SDGs
- Commitments beyond regulatory
compliance
- Commitment to water-related
innovation
- Commitment to stakeholder
awareness and education
- Commitment to water stewardship
and/or collective action
- Acknowledgement of the human right
to water and sanitation
- Recognition of environmental
linkages, for example, due to climate change
|
Our water policy is company-wide in
scope as this reflects a commitment to global consistency in our approach to
water security. Its purpose is to make clear our commitment internally, but
also externally. It gives a description of our company’s dependency on water to inform our colleagues of the
importance of managing this precious resource and to motivate them to engage
with our commitment to stewardship. Beyond the company, we affirm the human
right to water & sanitation & health issues, and cite health and
water-related public policy initiatives as these relate to our core aim as a
healthcare company – improving human health. We are happy to be held
accountable on this.
We also highlight the impact climate change will
have on future water availability at some of our sites, and as part of our
water policy framework, we also make public our site-specific Water Stewardship
Plans. These refer to the WWF Basin Stewardship Strategies and Water Action Hub
to assist local water specialists to identify opportunities to form
partnerships to mitigate water stress in their local basin. We stress basin
level innovation and stewardship as this can improve our efficiency and reduce
risks for all users in the basin.
|
Board oversight
(W6.2) Is there board level oversight of water-related issues within your organization?
Question dependencies
- Your response to W6.2 will determine if subsequent questions are presented in this section. If your response to W6.2 is amended, data in those dependent questions may be erased. In this case, be sure to re-enter data for all relevant questions. The guidance for each question indicates if it is a dependent question.
Change from 2019
No change
Rationale
This provides an indication of the importance of water to your business by demonstrating board level oversight of water-related matters.
Connection to other frameworks
CEO Water Mandate
Response: Policies, governance and targets
Response options
Select one of the following options:
Requested content
General
- In answering this question, consider whether the board and/or board committees consider water-related issues when carrying out their governance and oversight duties such as reviewing and guiding their business strategy, major plans of action, risk management policies, annual budgets, and budget plans as well as setting the organization’s performance objectives, monitoring implementation and performance, and overseeing major capital expenditures, acquisitions, and divestitures. If any of these options is true, please select ‘yes’.
- You should also select ‘yes’:
- if your organization has board-level oversight of an integrated environmental risk assessment that includes water-related risks among other environmental aspects.
- if a specific board member or committee has responsibility for any water-related policies, strategy or information.
Explanation of terms
- Board: The board, or board of directors, refers to a body of elected or appointed members who jointly oversee the activities of a company or organization. Some countries use a two-tiered system where “board” refers to the “supervisory board” while “key executives” refers to the “management board” (adapted from the Recommendations of the Task Force for Climate Related Financial Disclosure, 2017).
- Board-level oversight: This involves the board having direct responsibility and accountability; for example, for setting commitments and guiding strategy, ensuring the efficacy and efficiency of management, for financial stability and regulatory compliance, and reviewing the progress of objectives and policies.
- Governance: A system whereby an organization is influenced and controlled based on the interests of shareholders and stakeholders. This involves relationships and communication between management, the board, the shareholders and stakeholders. Governance provides a framework for an organization to set objectives, monitor performance, and evaluate results (adapted from the Recommendations of the Task Force for Climate Related Financial Disclosure, 2017).
(W6.2a) Identify the position(s) (do not include any names) of the individual(s) on the board with responsibility for water-related issues.
Question dependencies
- This question only appears if you select “Yes” in response to W6.2.
Change from 2019
No change
Rationale
If you have rated that water is important to your organization (W1.1), and/or have identified risks of high magnitude within your direct operations or value chain (W4.1) that could generate a substantive change to your business, CDP data users might expect to see that a board member has accountability for water within your organization.
Connection to other frameworks
CEO Water Mandate
Response: Policies, governance and targets
Response options
Please complete the following table. You are able to add rows to this table using the “Add Row” button at the bottom of the table.
| Position of individual
|
Please explain
|
|
Select from:
- Board Chair
- Director on board
- Chief Executive Officer (CEO)
- Chief Financial Officer (CFO)
- Chief Operating Officer (COO)
- Chief Procurement Officer (CPO)
- Chief Risk Officer (CRO)
- Chief Sustainability Officer (CSO)
- Other C-Suite Officer
- President
- Board-level committee
- Other, please specify
|
Text field [maximum 1,000 characters]
|
[Add Row]
Requested content
General
- Report where in the board the responsibility for oversight of water issues lies. This may be with an individual member of the board or a board-level committee, e.g. sustainability committee, risk committee, etc.
- Note that this question is asking about direct responsibility for oversight. In practical terms, this is the person or committee at the top of the chain of command specifically managing information on water-related issues, making decisions about what the company will do and adapting those decisions based on water-related information. The CEO is ultimately responsible for everything in the company; however, this question is looking to identify board-level responsibility specifically on water-related issues. While this may be the CEO, it is not necessarily the case.
Position of individual(s) (column 1)
- Select the position of the individual on the board with responsibility for water-related issues.
- If the position is not listed here, please select the closest match for your organization and provide the position title in column 2 ('Please explain').
- If oversight falls jointly to the members of a committee, rather than an individual position, you should select 'Board-level committee' and provide the name of the committee in column 2 ('Please explain').
- Note that this question asks about the position and not about the names of the staff holding these positions. Do not include the name of any individual or any other personal data in your response.
- If there is more than one position, please add a row.
Please explain (column 2)
- Provide a description of the position(s)/committee(s) in the corporate structure and the level of responsibility they have towards water-related issues; and
- Explain how the responsibilities of the position(s)/committee(s) are related to water issues.
- Note that this question asks about the position and not about the names of the staff holding these positions. Do not include the name of any individual or any other personal data in your response.
- You can use this text field to enter any relevant information.
Explanation of terms
- C-suite: A term used to collectively refer to the most senior executive team.
(W6.2b) Provide further details on the board’s oversight of water-related issues.
Question dependencies
- This question only appears if you select "Yes" in response to W6.2.
Change from 2019
No change
Rationale
This provides an indication of how water-related issues are overseen at board level and the frequency of briefings on water issues.
CDP data users are interested in understanding an organization’s awareness and management of water-related risks at the board level; how intertwined this is with organizational strategy, plans of action, management policies, performance objectives; and how the board monitors progress against targets and goals, for example.
Response options
Please complete the following table:
|
Frequency that water-related issues are a scheduled agenda item
|
Governance mechanisms into which water-related issues are integrated
|
Please explain
|
|
Select from:
- Scheduled - all meetings
- Scheduled - some meetings
- Sporadic - as important matters arise
- Other, please specify
|
Select all that apply:
- Monitoring implementation and performance
- Overseeing acquisitions and divestiture
- Overseeing major capital expenditures
- Providing employee incentives
- Reviewing and guiding annual budgets
- Reviewing and guiding business plans
- Reviewing and guiding major plans of action
- Reviewing and guiding risk management policies
- Reviewing and guiding strategy
- Reviewing and guiding corporate responsibility strategy
- Reviewing innovation/R&D priorities
- Setting performance objectives
- Other, please specify
|
Text field [maximum 3,000
characters]
|
Requested content
General
- This question seeks information about the nature and frequency of board-level oversight of water-related issues.
- This includes the frequency that water issues are discussed at board level, an explanation for that frequency, an indication of the aspects of governance that water matters are integrated into, and the competency of the board on water-related issues.
Frequency that water-related issues are a scheduled agenda item (column 1)
- Indicate the board’s/board committee’s approach to including water issues as an agenda item by selecting a frequency and providing an explanation in column 3.
- You should consider the frequency that water-related issues are a scheduled agenda item for the board-level committee with oversight for water-related issues. This may be a subcommittee of the board, or the full board itself.
Governance mechanisms into which water-related issues are integrated (column 2)
- Select all governance mechanisms in which water-related issues are included.
- If you select “Other, please specify”, provide a label for the governance mechanism.
Please explain (column 3)
- Provide further details of your selection in column 1; e.g., regarding who briefs the board and on what matters: “The committee meets quarterly and a report from each Business Head regarding performance against water targets is reviewed”.
- Note that your response to this question may refer to the position of employees relevant to board oversight mechanisms. Do not include the name of any individual or any other personal data in your response.
- Describe how the governance mechanisms selected in column 2 contribute to the board's oversight of water-related issues. For example:
- how responsibility for water policies, strategy and information is delegated and how management is held accountable and/ or incentivized for implementation of the organization’s policies;
- the nature of the underlying information and control systems used to provide information to the Board on water related matters;
- who approves the release of water-related information.
- As much as possible, please give examples from the reporting year.
(W6.2c) Why is there no board-level oversight of water-related issues and what are your plans to change this in the future?
Question dependencies
- This question only appears if you select “No” in response to W6.2.
Change from 2019
No change
Rationale
As CDP data users are interested in understanding an organization’s awareness and management of water-related risks at the board-level, this question allows companies to explain why there is no board-level oversight.
Response options
Please complete the following table:
|
Primary reason
|
Board level oversight of water-related issues will be introduced in the next two years
|
Please explain
|
|
Text field [maximum 200 characters]
|
Select from:
|
Text field [maximum 1,500 characters]
|
Requested content
Primary reason (column 1)
- Provide your organization's rationale for not currently having board-level oversight of water-related issues. While there may be multiple reasons for this, please describe the primary justification.
Please explain (column 3)
- Use this column to provide an explanation of what you plan to implement in the next two years or why you have no plans.
Management responsibility
(W6.3) Provide the highest management-level position(s) or committee(s) with responsibility for water-related issues (do not include the names of individuals).
Change from 2019
No change
Rationale
While it is most important for a member of the board to have responsibility for water related issues, assigning management level responsibility indicates that the organization is committed to implementing its water strategy.
Connection to other frameworks
SDG
Goal 6: Clean water and sanitation
Response options
Please complete the following table. You are able to add rows by using the “Add Row” button at the bottom of the table.
| Name of the position(s) and/or committee(s)
|
Responsibility
|
Frequency of reporting to the board on water-related issues
|
Please explain
|
|
Select from:
- There is currently no management-level responsibility for water-related issues
- Chief Executive Officer (CEO)
- Chief Financial Officer (CFO)
- Chief Operating Officer (COO)
- Chief Procurement Officer (CPO)
- Chief Risk Officer (CRO)
- Chief Sustainability Officer (CSO)
- Other C-Suite Officer, please specify
- President
- Risk committee
- Sustainability committee
- Safety, Health, Environment, and Quality committee
- Corporate responsibility committee
- Other committee, please specify
- Business unit manager
- Energy manager
- Environmental health and safety manager
- Environment/Sustainability manager
- Facilities manager
- Process operation manager
- Procurement manager
- Public affairs manager
- Risk manager
- Other, please specify
|
Select from:
- Assessing water-related risks and opportunities
- Managing water-related risks and opportunities
- Both assessing and managing water-related risks and opportunities
- Other, please specify
|
Select from:
- More frequently than quarterly
- Quarterly
- Half-yearly
- Annually
- Less frequently than annually
- As important matters arise
- Not reported to board
|
Text field [maximum
1,000 characters]
|
[Add Row]
Requested content
General
- Provide details of the highest management-level position or committee with a responsibility for water-related issues and implementing aspects of the organization’s water policy and strategy.
- The responsibility may be for assessing and/or managing water-related risks and opportunities, or have a different primary focus related to water.
Name of the position(s) and/or committee(s) (column 1)
- Select the best match for the position/committee in your organization, or select ‘Other, please specify’.
- The list includes senior positions that may sometimes but not always be at board level.
- Note that this question asks about the position and not about the names of the staff holding these positions. Do not include the name of any individual or any other personal data in your response.
- Note that positions already listed in question W6.2a are also listed here; select one of those positions only if the individual has effective management responsibility for water-related issues.
- If there is more than one position/committee with high management-level responsibility and you would like to describe this, you may use the 'Add row' button and describe their responsibilities in column 2. This is optional.
- If you are selecting more than one position or committee by adding rows, make sure that the position/committee with the highest level of responsibility is in the top row of the table.
Responsibility (column 2)
- Select the best match for the responsibility of the position/committee reported in column 1, or select ‘Other, please specify’ and insert the main responsibility.
Please explain (column 4)
- Describe the individual’s/committee’s position in the corporate structure.
- Note that this question asks about the position and not about the names of the staff holding these positions. Do not include the name of any individual or any other personal data in your response.
- Provide further context for the specific responsibilities, duties and actions of this individual/committee.
- Describe the nature of the report to the board referred to in column 3.
Explanation of terms
- Highest-level management: The most senior individual or committee that holds specific executive power over the management of day-to-day tasks. Highest-level managers would hold ultimate responsibility over the implementation of the decisions taken at the board level.
Employee incentives
(W6.4) Do you provide incentives to C-suite employees or board members for the management of water-related issues?
Question dependencies
- Your response to this question will determine whether the next question is presented. If your response to this question is amended, data in the next question may be erased. In this case, be sure to re-enter data for the next question.
Change from 2019
New question; Minor change for CH, EU, FB, MM and OG only
Rationale
Employee incentives linked to sustainability performance send a clear signal about the role the employee is expected to play in achieving the organization’s commitments and targets.
For senior employees this may include incentives that are explicitly related to the organization’s strategy.
By responding to this question, investors and other stakeholders can see that your organization recognizes the business case for water security and is embedding it into its decision making and business culture.
Response options
Please complete the following table:
| Provide incentives for management of water-related issues | Comment |
|---|
Select from:
- Yes
- No, not currently but we plan to introduce them in the next two years
- No, and we do not plan to introduce them in the next two years
| Text field [maximum of 1,000 characters] |
Requested content
General
- When making your selection, consider if your organization provides incentives to its most senior employees that are linked to performance indicators related to water commitments, targets and goals. Such incentives could be monetary or non-monetary, and include salary bonuses or other benefits provided.
- Note that this question refers only to C-suite/board-level employees.
- Only select "Yes" if your organization provides incentives specifically linked to reducing water impacts/improving water security.
- Only select "Yes" if they have been in place in the current reporting period.
- If you wish to comment on your selection, you may use the "Comment" column. This is optional.
Explanation of terms
- Employee incentives: Payments, benefits or concessions additional to the employee’s usual benefits that depend on the achievement of a performance goal.
(W6.4a) What incentives are provided to C-suite employees or board members for the management of water-related issues (do not include the names of individuals)?
Question dependencies
- This question only appears if “Yes” is selected for W6.4.
Change from 2019
New question; Modified question for CH, EU, FB, MM and OG only
Rationale
Providing insight into these incentives and the specific water issues they are designed to address will inform investors and data users how these incentives are aligned with the organization’s identified risks and opportunities, water policy, targets, and business strategy.
Response options
Please complete the following table:
| Type of incentive |
Role(s) entitled to incentive |
Performance indicator |
Please explain
|
|
Monetary reward
|
Select all that apply:
- Board chair
- Board/Executive board
- Director on board
- Corporate executive team
- Chief Executive Officer (CEO)
- Chief Financial Officer (CFO)
- Chief Operating Officer (COO)
- Chief Purchasing Officer (CPO)
- Chief Risk Officer (CRO)
- Chief Sustainability Officer (CSO)
- Other C-suite Officer
- Other, please specify
- No one is entitled to these incentives
|
Select all that apply:
- Reduction of water withdrawals
- Reduction in consumption volumes
- Improvements in efficiency – direct operations
- Improvements in efficiency – supply chain
- Improvements in efficiency – product-use
- Improvements in waste water quality – direct operations
- Improvements in waste water quality – supply chain
- Improvements in waste water quality – product-use
- Implementation of employee awareness campaign or training program
- Supply chain engagement
- Increased access to workplace WASH
- Implementation of water-related community project
- Other, please specify
|
Text field [maximum of 1,500 characters]
|
|
Non-monetary reward
|
|
|
|
Requested content
Type of incentive (column 1)
- Monetary reward - a bonus or some form of financial remuneration;
- Non-monetary reward - a reward not tied directly to any form of financial remuneration, including an employee award (e.g. employee of the year), career progression scheme, increased holiday allowances, special assignment, parking allocations, etc.
Role(s) entitled to incentive (column 2)
- Select the best match for the senior role you are reporting on, or select "Other, please specify".
- If the option “Other, please specify” is selected, indicate the highest-level position to whom the incentive is provided.
- If the option “No one is entitled to these incentives” is selected then you will not be presented with the next column, “Indicator for incentivized performance”. You may explain your approach in column 3.
Performance indicator (column 3)
- If the option “Other, please specify” is selected, please provide a label for the incentive and give more details in column 4. For example, the incentive may be linked to progressing a target reported in module W8.
Please explain (column 4)
- Provide details of the incentives, including:
- The rationale for the incentive and the choice of indicator to measure performance;
- The threshold used to indicate successful performance; and
- How performance impacts the incentive/reward.
- You may provide any other information useful for understanding the incentive such as the timescale for the performance improvement and its geographic/organizational scope. Additionally, you may describe how the incentivized performance is linked to the organization’s water policy, targets and strategy.
- Note that this question asks about the position of senior employees receiving incentives. Do not include the name of any individual or any other personal data in your response.
Explanation of terms
- Employee incentives: Payments, benefits or concessions additional to the employee’s usual benefits that depend on the achievement of a performance goal.
Example response
| Type of incentive | Role(s) entitled to incentive | Performance indicator | Please explain |
|---|
| Monetary reward | - Chief Executive Officer (CEO)
- Chief Operating Officer (COO)
| - Reduction of water withdrawals
- Improvements in efficiency – supply chain
- Improvements in waste water quality – direct operations
| We are an organization in the power generation sector which is committed to reducing water withdrawals, increasing water-use efficiency, reducing impact on water resources, and advancing sustainable water management practices across all facilities. This is included in our 10-year strategy and incorporated into senior employee incentives.
Our water-related targets are a 10% reduction in consumption volumes, 20% overall increase in water-use efficiency, and stormwater pollution prevention across all facilities by 2025. They are set at company-level and embedded in the CEO's and COO's performance contracts.
A 10% salary bonus is given to the CEO and COO if these targets are achieved by 2025. There are also short-term, quarterly cash rewards evaluated on the progression towards these targets. |
| Non-monetary reward | - Corporate executive team
- Chief Sustainability Officer (CSO)
| - Implementation of employee awareness campaign or training program
- Implementation of water-related community project
| We believe that awareness among our employees of the importance of water in our operations, local water scarcity issues, and how to reduce impact on resources is a key indicator in advancing water security.
Our CSO, along with the corporate executive team, oversee a "Water Stewardship Ambassador Program" that involves 12 hours of courses and an examination to become certified as a Water Stewardship Ambassador. The CSO and corporate executive team are awarded with additional vacation days and other non-cash benefits if this program successfully meets its objectives.
Across the organization we also have annual awards for the best water-related community project ideas among our Water Stewardship Ambassadors. The winners of this award are given funding to set up and help run their initiative. |
Public policy engagement
(W6.5) Do you engage in activities that could either directly or indirectly influence public policy on water through any of the following?
Question dependencies
- Your response to W6.5 will determine whether W6.5a is presented. If your response to W6.5 is amended, data in W6.5a may be erased. In this case, be sure to re-enter data for W6.5a.
Change from 2019
No change
Rationale
It is important that boards have established mechanisms to ensure that activity seeking to externally influence policy agendas aligns with the company’s commitments and strategic objectives for water security. This includes engagement with policy makers, trade associations and/or research funding organizations or any other organizations relevant to public policy. This question facilitates increased transparency and helps CDP data understand the company’s priorities and stance on this aspect of water governance.
Response options
Select all that apply from the following options:
- Yes, direct engagement with policy makers
- Yes, trade associations
- Yes, funding research organizations
- Yes, other
- No
Requested content
General
- Select all that apply for your organization and that are relevant to the reporting year.
- External engagement is relevant here if it seeks to influence water policy or other water agendas, including policy makers, government departments, or regulatory bodies on a regional, local, national, or international level.
- Only select “No” if you do not carry out any policy engagement activities related to water.
(W6.5a) What processes do you have in place to ensure that all of your direct and indirect activities seeking to influence policy are consistent with your water policy/water commitments?
Question dependencies
- This question only appears if you select any of the “Yes” options in response to W6.5.
Change from 2019
No change
Rationale
It is important that boards establish mechanisms to ensure that any activity seeking to externally influence policy agendas aligns with the company’s commitments and strategic objectives for water security and that they maintain a consistent approach to addressing their water challenges.
This question enables companies to disclose the processes they use to make sure that their stated position on water security is compatible with their engagement and other activities.
Response options
This is an open text question with a limit of 1,500 characters.
Requested content
General
- The intention is to understand how your organization manages engagement activities across different business divisions and geographies to ensure that you have a common approach consistent with your strategy on water security/stewardship/management.
- If you do not have any processes or plans in place, explain how you will to address this potential for conflict in the future.
Reporting
(W6.6) Did your organization include information about its response to water-related risks in its most recent mainstream financial report?
Change from 2019
No change
Rationale
The integration of information on climate-related risk into mainstream financial reporting is a regularity requirement in some jurisdictions and is a TCFD recommendation. CDP data users wish to understand whether a company includes, or plans to include, water-related information to facilitate their understanding of the company's response to water risk and progress towards water security.
Response options
Select one of the following options:
- Yes (you may attach the report – this is optional)
- No, but we plan to do so in the next two years
- No, and we have no plans to do so
Requested content
General
- Select ‘Yes’ if your organization included details on its water-related risks and risk management in its most recent mainstream financial report.
- The mainstream report should relate to the reporting year, although it may not have been published during the reporting year.
- If your organization's mainstream report contains details on its water-related risks and risk management for the reporting year but has not been published at the the time of submission of your CDP response, select 'No, but we plan to do so in the next two years'.
- If you wish to comment on your selection, you may click on the 'speech bubble' icon. This is optional.
Note:
- You may attach a copy (or screenshot) of your financial report. This is optional.
W7 Business strategy
Module Overview
The purpose of this module is to collect information on how a company is adapting its long-term business model to secure a sustainable future, in terms of both its own resilience and securing water for all.
It flags that companies need to consider how to include water related issues in long term planning/strategy and they must also be accounted for financially. This strengthens the forward-looking focus of the water security questionnaire.
The questionnaire also seeks information for our data users on the use of an approaches to internal water valuation and the use of scenario analysis. The latter is a tool for strategically understanding different potential futures, their implications regarding water security and how a business model might be modified to maximize opportunities. This reflects the recommendations of the Task Force on Climate-related Financial Disclosures. Further information on conducting and disclosing scenario analysis can be found in the CDP Technical Note on Scenario Analysis. Compared to most routine risk assessment approaches, scenario analysis involves a long-term horizon – typically beyond 35 years, a focus on macro, global trends which will interact with the more local trends and allows the analysis of complexity.
Key changes
- Modified guidance (W7.2): New details requested relating to CAPEX/OPEX.
- Click here for a list of all changes made this year.
Sector-specific content
Pathway diagram - questions
This diagram shows the questions contained in module W7. To access question-level guidance, use the menu on the left to navigate to the question.
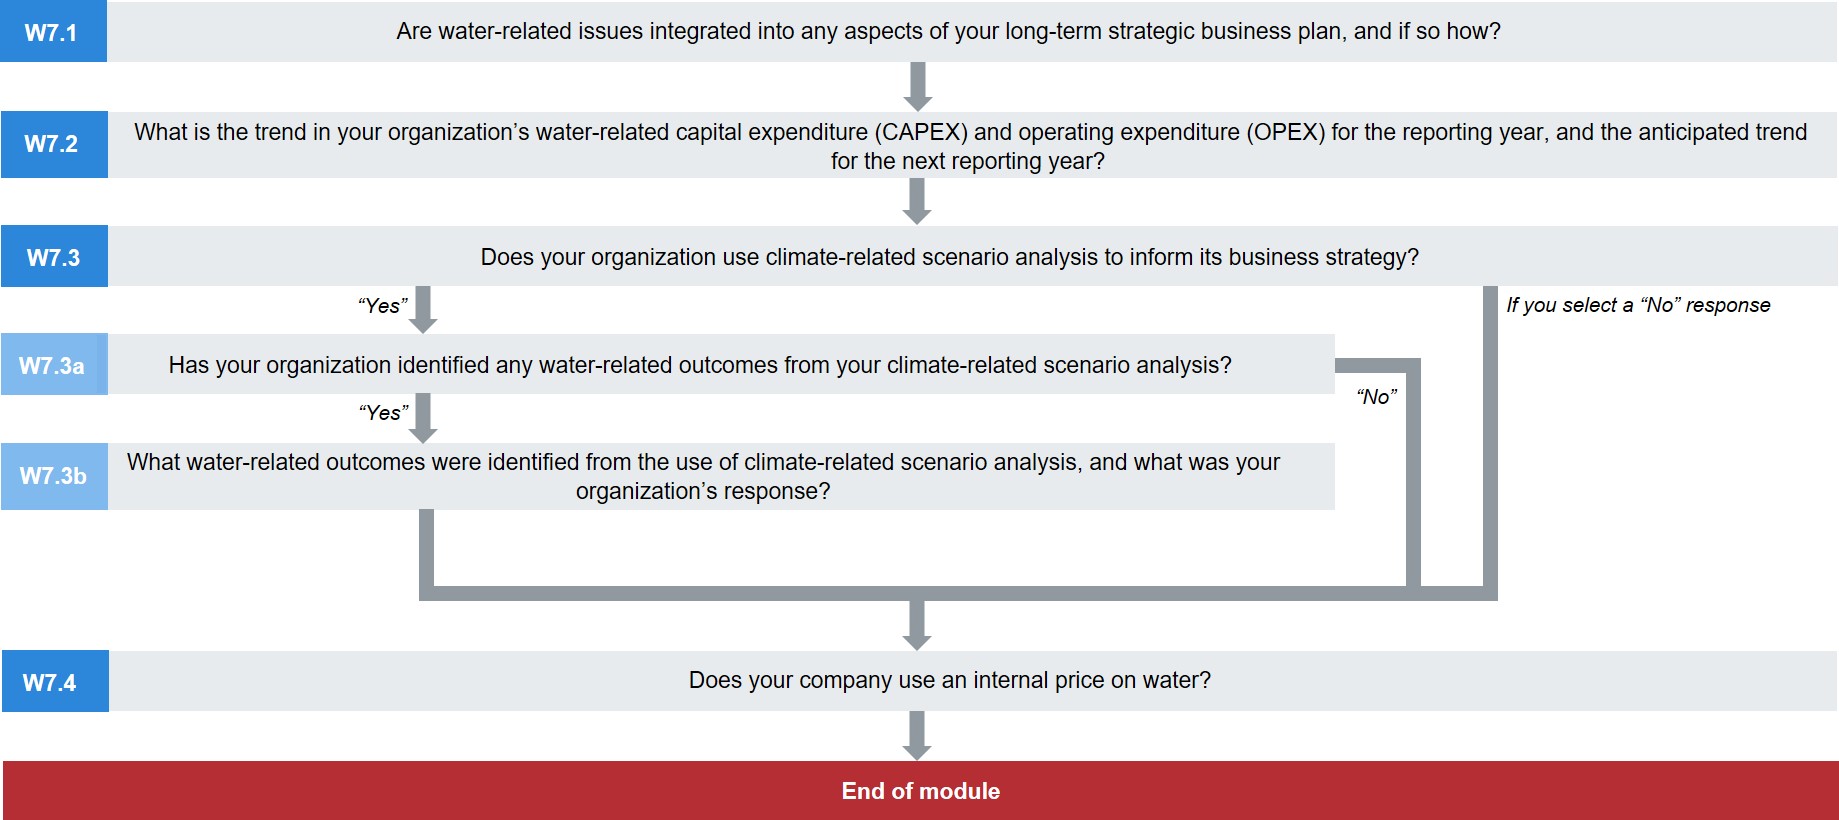
Pathway diagram - questions for minimum version questionnaire
This diagram shows the questions contained in module W7 that are included in the minimum version of the questionnaire. To access question-level guidance, use the menu on the left to navigate to the question.
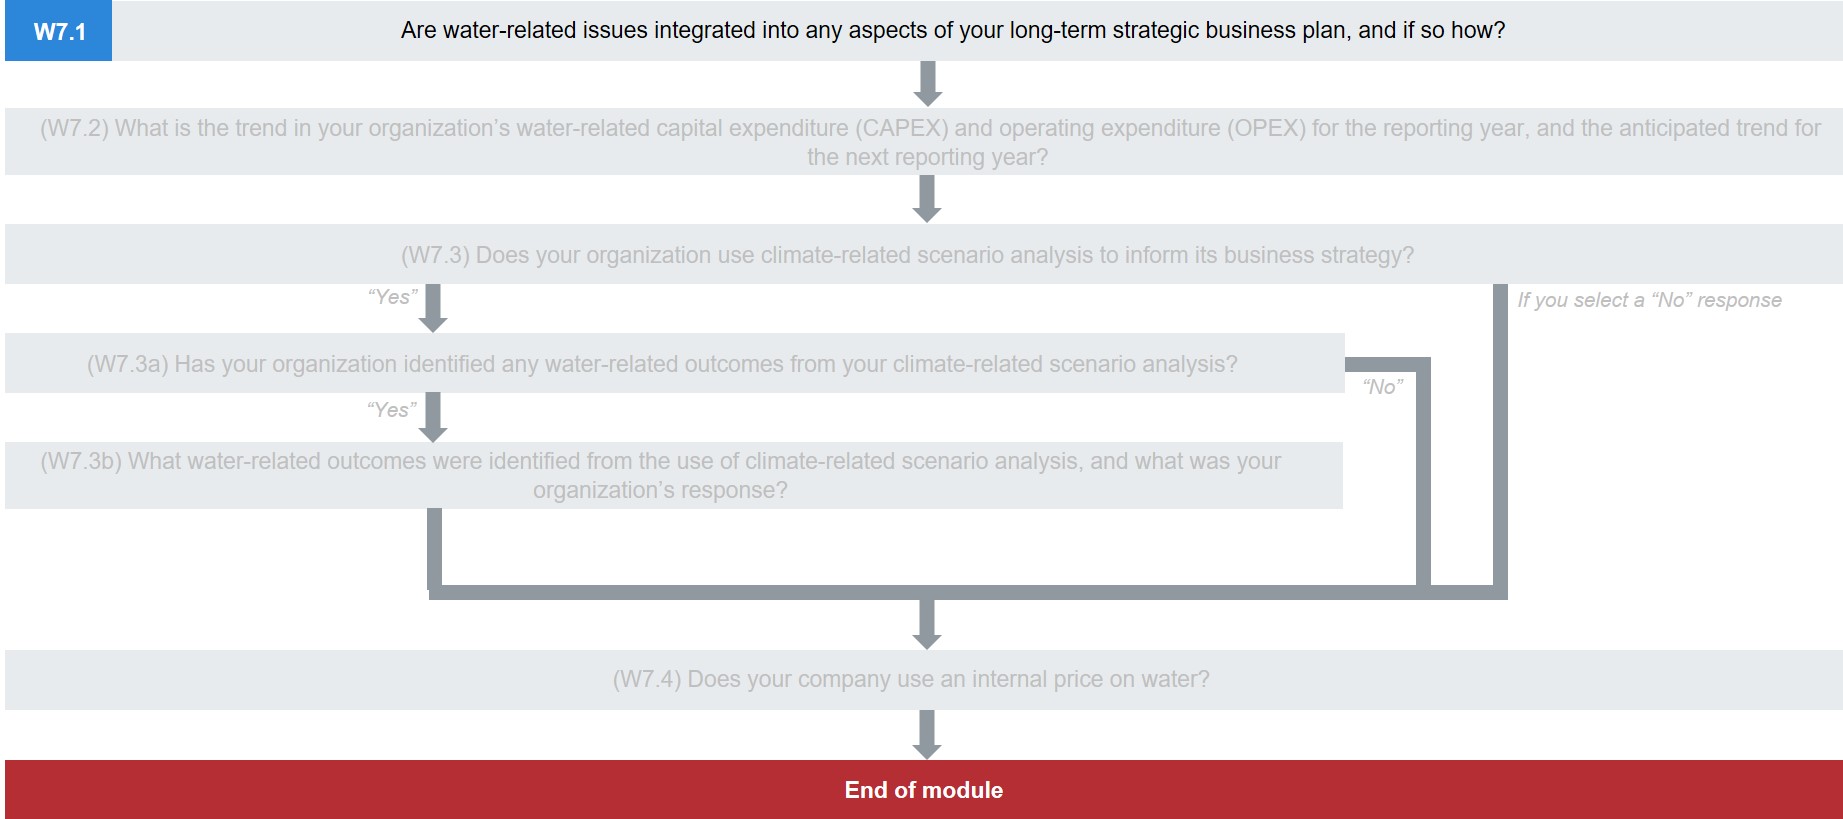
Strategic plan
(W7.1) Are water-related issues integrated into any aspects of your long-term strategic business plan, and if so how?
Change from 2019
No change
Rationale
This question allows companies to explain how they have considered and acted upon water-related issues at a strategic level for the business, rather solely at the operational level.
This is not asking simply about your response to water risks. CDP data users, particularly investors are interested in forward-looking strategic innovations and financial decisions that have been driven by internal and external factors; e.g. both current and future market opportunities, public policy objectives, and corporate responsibility commitments related to water.
Connection to other frameworks
CEO Water Mandate
Response: Policies, governance and targets
SDG
Goal 6: Clean water and sanitation
Response options
Please complete the following table:
|
Aspect of strategic business plan
|
Are water-related issues integrated?
|
Long-term time horizon (years)
|
Please explain
|
|
Long-term business objectives
|
Select from:
- Yes, water-related issues are integrated
- No, water-related issues were reviewed but not considered as strategically relevant/significant
- No, water-related issues not yet reviewed, but there are plans to do so in the next two years
- No, water-related issues were not reviewed and there are no plans to do so
|
Select from:
- 5-10
- 11-15
- 16-20
- 21-30
- > 30
|
Text field [maximum 1,500
characters]
|
|
Strategy for achieving long-term objectives
|
|
|
|
|
Financial planning
|
|
|
|
Requested content
General
- When responding to this question, companies should consider if, what and how water-related issues have affected the 3 aspects of their business planning at the corporate level for a time horizon beyond 5 years.
- This could be in response to existing risks or future risks, but could also include other considerations, inside and outside of the company, related to water, such as current and future market opportunities, public policy agendas, and corporate responsibility commitments.
- In some cases, your action may be directly motivated by specific water-related issues, and in other cases, water-related issues may be an additional (but not exclusive) driver of the action.
Aspect of strategic business plan (column 1)
- Business objectives: when responding to this row, please report how water issues have been integrated into your future business objectives in a time horizon beyond 5 years.
- Strategy: when responding to this row, you should report how your future strategy, beyond 5 years, for achieving your business objectives has been influenced by a water-related issue.
- Financial planning: When responding to this row, you should consider how your future financial plans, for a period beyond 5 years, have been affected by water-related issues. This includes changes to revenue, expenditure, assets and liabilities, and the specific actions, assets, and resources that are deemed necessary to achieve your organization’s long-term objectives (including changes to capital allocation).
Are water-related issues integrated? (column 2)
- You should select ‘Yes’ if water-related issues were considered and they were incorporated into or affected your corporate business objectives, strategy or strategic financial planning, i.e. beyond operational management.
- In all other cases, select one of the ‘No’ options to indicate that water risks/opportunities and other water issues have had no influence on your company’s strategy for developing your business.
Long-term time horizon (column 3)
- Select the option that best describes how far into the future you considered water-related issues for each of the 3 aspects of strategy.
Please explain (column 4)
- For each row, you should provide an explanation for your answers in column 2 and 3.
- You should include company-specific examples of how water has been integrated in strategic planning.
- If you answered ‘Yes’, please explain:
- Which water issues were incorporated.
- How the business planning aspect in column 1 was affected. For example, you may have decided to introduce a new product range or cease the manufacturing of particular product, divest from a location, commit to a collective action approach to water management in the river basins where you operate, or increase capital expenditures on new technologies.
- Why this decision was taken; such as to avoid a loss in revenue due to anticipated higher water costs over the longer term, to benefit from increased asset valuations, to realize a positive linkage with long-term carbon emission reductions, to exploit new markets, because of a projected lack of resource availability, because of anticipated consumer behavior shifts.
- If you answered ‘No’, depending on which drop down you selected, for each row please describe:
- The primary reason your organization concluded that water-related issues need not impact on that aspect of its business planning in the long-term.
- Any plans to review how water-related issues might impact that aspect of your business planning in the long-term, include the rationale for those plans.
- The primary reason your organization has no plans to review how water-related issues might impact that aspect of its business planning in the long-term.
Explanation of terms
- Business objectives: These describe what the organization expects to accomplish over a specified time period, and typically include a statement of purpose and anticipated future state for the organization.
- Financial planning: Refers to an organization’s consideration of how it will achieve and fund its objectives and strategic goals. The process of financial planning allows organizations to assess future financial positions and determine how resources can be utilized in pursuit of short- and long-term objectives. Organizations often create “financial plans” that outline the specific actions, assets, and resources (including capital) necessary to achieve its objectives over a 1-5 year period. However, ‘financial planning’ ‘is broader as it includes long-term capital allocation and other considerations that may extend beyond the 5 year period (e.g., investment, research and development, manufacturing, and markets) (adapted from the Recommendations of the Task Force for Climate Related Financial Disclosure, 2017).
- Strategy: A plan of action to achieve your organization's long-term objectives/anticipated future state.
CAPEX/OPEX
(W7.2) What is the trend in your organization’s water-related capital expenditure (CAPEX) and operating expenditure (OPEX) for the reporting year, and the anticipated trend for the next reporting year?
Change from 2019
Modified guidance
Rationale
Within a company, this information raises the strategic understanding of the value of water for the business (beyond the price paid for it).
Signaling the direction of travel of capital expenditure and operating expenditure to CDP data users helps them understand their potential exposure.
The question asks for a reporting of trends and not absolute values. It identifies changes in water-related investment and operational costs. The information provided here should align with the information provided on risk response strategies and business opportunities (reported in W4.2 and W4.3).
Response options
|
Water-related CAPEX
(+/- % change)
|
Anticipated forward trend for CAPEX (+/- % change)
|
Water-related OPEX
(+/- % change)
|
Anticipated forward trend for OPEX (+/- % change)
|
Please explain
|
|
Percentage field [enter
a percentage from 0 to +/-999,999,999,999 using a maximum of 2 decimal places]
|
Percentage field [enter
a percentage from 0 to +/-999,999,999,999 using a maximum of 2 decimal places]
|
Percentage field [enter
a percentage from 0 to +/-999,999,999,999 using a maximum of 2 decimal places]
|
Percentage field [enter
a percentage from 0 to +/-999,999,999,999 using a maximum of 2 decimal places]
|
Text field [maximum 1,000 characters]
|
Requested content
General
- This question requires companies to consider the trend in their water-related capital and operational expenditure.
- You may provide estimates if necessary.
- You may report the figure as a negative or positive percentage up to 2 decimal places.
- Only enter a zero percentage if there has been no change. Please remember that a zero should not be used for an absence of data.
Water-related CAPEX (+/- % change) (columns 1 and 2)
- Examples of water-related CAPEX are stormwater drain rehabilitation, sewerage line replacements, pollution control devices, treatment facility retrofitting, solvent recovery units, landfill construction, pipelines.
- In column 1, provide a figure for the percentage change in your water-related capital expenditure in the current reporting year compared to the previous year.
- In column 2, provide a figure for the anticipated change in your water-related capital expenditure for the forthcoming reporting year (note that anticipated future trends should be at least one year after the end of the reporting year disclosed in W0.2).
Water-related OPEX (+/- % change) (columns 3 and 4)
- Examples of water-related OPEX are permit renewals, wetland protection, water quality testing, consulting services, well maintenance, groundwater monitoring, hiring additional specialist employees, and the costs of water supply and wastewater disposal.
- In column 3, provide a figure for the percentage change in your water-related operational expenditure in the current reporting year compared to the previous year.
- In column 4, provide a figure for the anticipated change in your water-related operational expenditure for the forthcoming reporting year (note that anticipated future trends should be at least one year after the end of the reporting year disclosed in W0.2).
Please explain (column 5)
- State if your responses are estimates or if any exclusions apply to the data.
- You should provide details as to why your CAPEX or OPEX has increased, decreased, or remained the same compared to the previous reporting year.
- Please comment on the direction and magnitude of the anticipated forward trend in CAPEX and OPEX, and explain your response.
- You may comment on how the change in expenditure relates to particular aspects of your business; for example, a geography, business division, commodity, mineral, or power generation source.
- Please also comment on what the water-related expenditure was for; for example, investment in a particular product innovation, new power sources, or manufacturing technology upgrades.
- You could also provide an estimate of the proportion of your total OPEX and CAPEX that is water-related.
Explanation of terms
- Capital expenditure (water-related CAPEX): Represents the money invested by a company to acquire or upgrade its fixed assets, such as buildings and equipment, related to water management or water security in any way. Examples are stormwater drain rehabilitation, pollution control devices, and pipelines, or new machinery used to manufacture new low-water use products. Fixed assets are those that are used repeatedly in production processes for more than a year (adapted from the OECD Glossary of Statistical Terms).
- Operating expense (water-related OPEX): This is the expenditure an organization incurs as a result of performing its normal business operation. Examples are water supply costs, permit renewals, wetland protection, water quality testing, consulting services, well maintenance, and R&D expenditure related to the development of "low-water products". OPEX does not include taxes, depreciation, and interest (adapted from the European Commission, Eurostat).
W7.3 Scenario analysis
(W7.3) Does your organization use climate-related scenario analysis to inform its business strategy?
Question dependencies
- Your response to W7.3 will determine whether W7.3a is presented in this section. If your response to W7.3 is amended, data in those dependent questions may be erased. In this case, be sure to re-enter data for all relevant questions. The guidance for each question indicates if it is a dependent question.
Change from 2019
No change
Rationale
This question establishes whether your company uses climate-related scenario analysis. This will determine whether questions on water-related outcomes are presented.
Your disclosure provides CDP data users an indication of the extent to which your company is considering a range of possible and probable futures when considering sustainability challenges and opportunities.
CDP is taking a staged approach to disclosure on this topic and this question encourages companies to connect their use of climate scenario analysis to water issues as there are frequently significant linkages which companies should pay attention to. Investors will be able to use information for comparability across companies as they review their portfolios.
This question will evolve to reflect leading practice as it becomes more common for companies to carry out water-focused scenario analysis. Over time, we expect companies that are high impact in terms of water to actively consider water-related issues in their development of possible future scenarios and their use of scenario analysis. It should become possible to make the link to possible futures at the river basin level so that companies can analyze impacts in greater detail.
Response options
Please complete the following table:
| Use of climate-related scenario analysis
|
Comment
|
|
Select from:
- Yes
- No, but we anticipate doing so within the next two years
- No plans for the next two years
|
Text field [maximum
1,000 characters]
|
Requested content
General
- Note that, unlike CDP’s climate change questionnaire, the water security questionnaire is not seeking detailed information about your approach to or methods for scenario analysis, nor incentivizing the use of any particular scenario analysis methodology.
- To determine whether questions on the water-related outcomes of climate-related scenario analysis are presented, please answer ‘yes’ if your company has used a climate-related scenario analysis tool to inform your long-term business objectives and/or your strategy for achieving them.
Comment (column 2) (optional)
- You may use this column to provide information that will help CDP data users to understand your selection; e.g. you may wish to explain your plans, or whether you have used this tool for only some parts of your business.
- We recognize that a small but growing number of companies in some sectors are conducting water-related scenario analysis. Please give details here if that applies to your company.
Explanation of terms
- Climate-related scenario analysis: This forward-looking tool helps organizations developing resilient strategies for a low-carbon economy, consistent with a 2°C or lower future for example. There are publicly available climate-related scenarios that organizations can use, either as a direct tool or as a reference point for their own tailored scenarios. Please refer to the CDP Technical Note on Scenario Analysis for more information.
- Scenario analysis: A strategic planning process/tool to help an organization understand how it might perform in a range of probable, possible or preferred futures. Scenarios are not forecasts or predictions but describe potential paths leading to a specified outcome or goal. It draws attention to key factors complexities, and critical uncertainties that might drive or characterize that future. It allows decision makers to challenge “business-as-usual” assumptions, explore alternatives based on their relative impact and likelihood of occurrence, and evaluate the organization’s flexibility, resilience, or robustness across a range of potential outcomes. Companies use both narrative approaches and more detailed quantitative models to imagine and consider different futures. Scenario analysis not only identifies potential risks, but can also offer insight into opportunities including technologies, new products and services, new markets or assets, and increased resilience.
- Water-related outcomes: Scenario analysis enables decision makers to identify and evaluate potential outcomes for different scenarios and their effects on their organization, based on a variety of assumptions/input variables. The consequences may be water-related themselves, or have implications for the water management and governance of the organization, or for its wider business strategy.
(W7.3a) Has your organization identified any water-related outcomes from your climate-related scenario analysis?
Question dependencies
- This question only appears if you select “Yes” in response to W7.3.
- Your response to W7.3a will determine whether W7.3b is presented in this section. If your response to W7.3a is amended, data in those dependent questions may be erased. In this case, be sure to re-enter data for all relevant questions. The guidance for each question indicates if it is a dependent question.
Change from 2019
No change
Rationale
This question establishes whether under different climate scenarios water-related issues were identified as important for your company.
Response options
Select one of the following options:
Requested content
General
- Indicate whether you have identified any possible or probable water-related outcomes or implications for your company associated with future climate change scenarios.
- These may be challenges or opportunities arising from e.g. policy-based water restrictions due to drought, disruption to operations due to flooding or lack of cooling water, destruction of property, or increase in product demand.
Explanation of terms
- Water-related outcomes: Scenario analysis enables decision makers to identify and evaluate potential outcomes for different scenarios and their effects on their organization, based on a variety of assumptions/input variables. The consequences may be water-related themselves, or have implications for the water management and governance of the organization, or for its wider business strategy.
(W7.3b) What water-related outcomes were identified from the use of climate-related scenario analysis, and what was your organization’s response?
Question dependencies
- This question only appears if you select “Yes” in response to W7.3a.
Change from 2019
Minor change
Rationale
This question allows CDP data users to understand how your company has responded, or intends to respond, to the possible or probable water-related outcomes driven by different climate scenarios.
Response options
Please complete the following table:
|
Climate-related scenarios and models applied
|
Description of possible water-related outcomes
|
Company response to possible water-related outcomes
|
|
Select all that apply:
- 2DS
- IEA 450
- Greenpeace
- DDPP
- IRENA
- RCP 2.6
- IEA B2DS
- IEA Sustainable Development Scenario
- Nationally determined contributions (NDCs)
- Other, please specify
|
Text field [maximum 1,500 characters]
|
Text field [maximum 1,500 characters]
|
Requested content
Climate-related scenarios and models applied (column 1)
- Please indicate whether your organization has used any of the common climate-related scenarios and models listed here as part of its use of strategic scenario analysis tools.
- If you use a scenario that is not listed here, please select ‘Other, please specify’ and provide its name.
- Note: This question is not asking about your company’s response to future risks and opportunities associated with a ‘business as usual’ risk assessment exercise. You will have reported this in W4.
Description of possible water-related outcomes (column 2)
- Describe company-specific, possible or probable, water-related outcomes associated with the future climate scenarios selected in column 1.
- These may be possible or probable challenges or opportunities arising from, e.g., policy-based water restrictions due to drought, or disruption to operations due to temperature changes.
Company response to possible water-related outcomes (column 3)
- Describe your company’s response to the water-related outcomes described in column 2 and include the anticipated timescale for your responses.
- These should be operational or strategic actions taken or already planned in response to the identification of possible or probable future scenarios and their implications for your company. These might include relocation plans, investment in technology, product diversification, or divestment.
- You may wish to explain the extent to which the use of climate scenario analysis has been useful to your strategic water planning or for building resilience to different possible or probable long-term water futures.
Explanation of terms
- Water-related outcomes: Scenario analysis enables decision makers to identify and evaluate potential outcomes for different scenarios and their effects on their organization, based on a variety of assumptions/input variables. The consequences may be water-related themselves, or have implications for the water management and governance of the organization, or for its wider business strategy.
Water pricing
(W7.4) Does your company use an internal price on water?
Change from 2019
No change
Rationale
The true value of water is not accounted for in today’s markets in many parts of the world and the costs of treatment and delivery, as well as opportunity costs and environmental and social costs, are not well captured. As water becomes increasingly scarce and contested, businesses could see prices increase.
Applying an internal price on water that more accurately reflects the costs of the organization’s water provision can help it understand opportunities for efficiencies and prepare for potential future price changes. It can help strengthen the business case for water-related investment.
As part of their assessment of a company’s resilience, it is useful for CDP data users to know if companies are using an internal price for water, or exploring any other water valuation options.
Response options
Please complete the following table:
| Does your company use an internal price on water?
|
Please explain
|
|
Select from:
- Yes
- No, but we are currently exploring water valuation practices
- No, and we do not anticipate doing so within the next two years
|
Text field [maximum 1,000 characters]
|
Requested content
General
- CDP recognizes that attributing financial value to water is an emerging field and there are different tools and methodologies available to companies and investors wanting to understand more about the materiality of water risk. For this reason, this question is simply asking companies to let us know whether or not they are using it and to provide details if so. At this stage, we are not recommending any method or evaluating the validity of any activity or method.
Please explain (column 2)
- If an internal price on water is used by your organization, please provide the value and currency and how this price was calculated.
- You may also describe:
- the approach you adopted to establish the price
- a company-specific example of how the use of water pricing affects/has affected spending and other decisions within the organization
- how it compares to the price you are charged for water.
- If you have explored any other valuation practices, please include them here and comment.
- If an internal price on water is not currently used by your organization, please detail any plans to incorporate one, or any other valuation practices you are exploring. If you have no plans, please explain why you consider water valuation as unimportant for your business, or state if its relevancy has not been assessed.
Explanation of terms
- Internal water price: A metric reflecting the economic value of water to an organization in monetary terms - beyond the market price paid to water utilities or other direct costs of supply. This value may account for internal and/or external costs associated with water use as well as benefits to the company derived from water (e.g. regulatory costs, water-related capital expenditure, river basin water scarcity impacts, services provided by water ecosystems, social benefits, link to share price). This may be current and/or forward looking, and reflect various levels of time-scales, uncertainty, and geographies. An internal water price may be used in strategic, operational or financial planning.
- Water valuation: Method for arriving at a water price or any other type of metric associated with the value of water to the organization.
W8 Targets
Module Overview
This module collects information on your organization’s water-related quantitative targets and qualitative goals to demonstrate your commitment to progressing water stewardship and security improving water management.
Details are requested only for targets and goals that are significant to the company as whole and therefore monitored at the corporate level. However, we ask you to describe your approach to how targets are set for any level of your organization, because local context is critical for addressing water challenges. For example, do you have more aggressive targets in areas of most water stress? What changes are your targets and goals driving? How does your target setting link to your business strategy? What processes are used to review their impact?
Key changes
- No key changes.
- Click here for a list of all changes made this year.
Sector-specific content
- Additional drop-down options W8.1a: Food, Beverage & Tobacco.
Pathway diagram - questions
This diagram shows the questions contained in module W8. To access question-level guidance, use the menu on the left to navigate to the question.
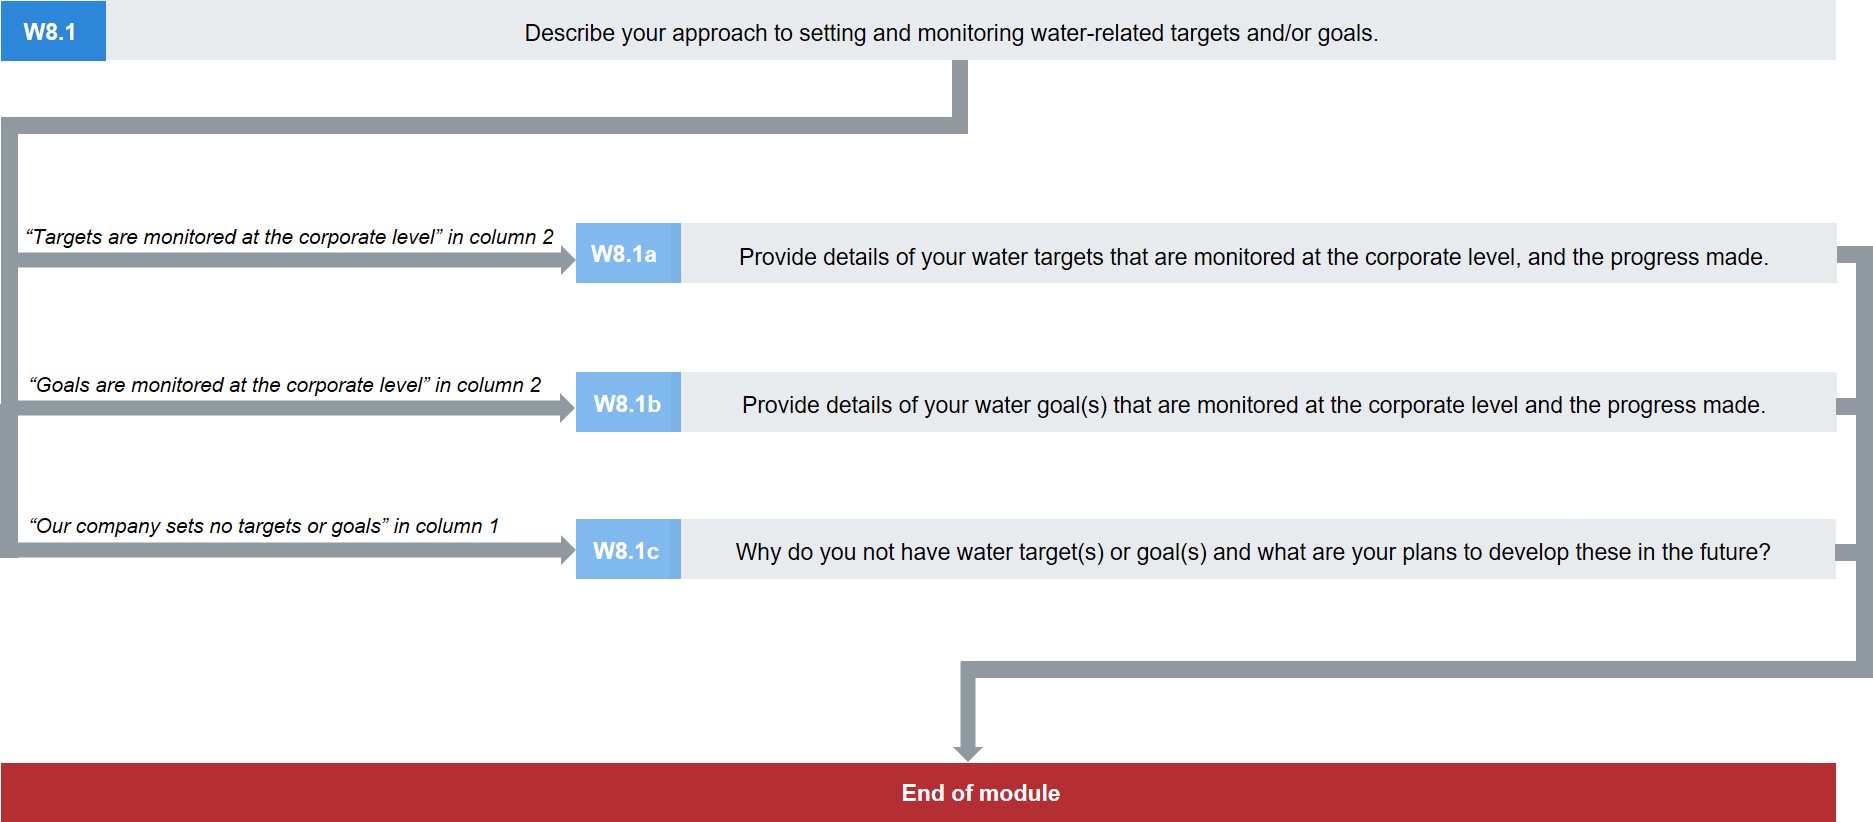
Pathway diagram - questions for minimum version questionnaire
This diagram shows the questions contained in module W8 that are included in the minimum version of the questionnaire. To access question-level guidance, use the menu on the left to navigate to the question.

Targets and goals
(W8.1) Describe your approach to setting and monitoring water-related targets and/or goals.
Question dependencies
- Your response to W8 will prompt which subsequent questions in this section are presented. If your response to W8.1 is amended, data in those dependent questions may be erased. In this case, be sure to re-enter data for all relevant questions. The guidance for each question indicates if it is a dependent question.
- If you select “Our company sets no targets and/or goals” in column 1, you will be presented with W8.1c.
- If you select "Targets are monitored at the corporate level" in column 2, you will be presented with W8.1a.
- If you select “Goals are monitored at the corporate level’ in column 2, you will be presented with W8.1b.
Change from 2019
No change
Rationale
CDP data users wish to know about your organization’s targets (quantitative) and goals (qualitative) for achieving its water policy and commitments, improving water management, and responding to current and future water risks.
Companies may set targets and/or goals that are corporate wide, applicable to all parts of their organization, and determined and monitored at the corporate level. Some will be a key tool for achieving the corporate water strategy, though they apply to specific brands, products, facilities, basins, regions, processes etc. Others will be associated with the day to day management of the company at a local level. Some targets will be set at the level of specific regions, brands, business units etc. and will not be monitored at the corporate level.
Context can be particularly relevant for water-related targets and goals. Risks and impacts, and their mitigation actions, are often specific to location and the contextual issues of a basin; such as, water quality/quantity, access to WASH, water governance, and local ecosystems.
Companies may contribute to targets and goals that go beyond or originate beyond their company “fence line” and work with other stakeholders to achieve them, particularly at the basin.
This question allows your organization to explain its approach to target and goal setting at all levels and to demonstrate to CDP data users how the targets and goals are linked to the water risks and impacts you disclose in this questionnaire.
Connection to other frameworks
CEO Water Mandate
Response: Policies, governance and targets
Response options
Please complete the following table:
|
Levels for targets and/or goals
|
Monitoring at corporate level
|
Approach to setting and monitoring targets and/or goals
|
|
Select all that apply:
- Our company sets no targets or goals
- Company-wide targets and goals
- Business level specific targets and/or goals
- Activity level specific targets and/or goals
- Site/facility specific targets and/or goals
- Brand/product specific targets and/or goals
- Country level targets and/or goals
- Basin specific targets and/or goals
- Other, please specify
|
Select all that apply:
- None are monitored at corporate level
- Targets are monitored at the corporate level
- Goals are monitored at the corporate level
|
Text field [maximum 3,000
characters]
|
Requested content
General
- Consider the range of water-related targets and goals set within your organization and the processes you have in place to ensure that they are meaningful and that their progress and impact is monitored. Also consider whether these are monitored at the corporate level. The targets may be related to your organization’s direct operations, or other parts of its value chain.
Levels for targets and/or goals (column 1)
- Select all the options that apply to your organization for the current reporting year. Indicate if your organization uses targets and goals that are company-wide, local, specific to a business unit, product or brand etc. For example, if you have a target associated with water demand for a garment dying process and that target applies across all of your operations and geographies, you would select both ‘Activity specific targets and goals' and ‘Company-wide targets and goals.’
- If you select “Other, please specify,” provide a label for the level of targets/goals.
Monitoring at corporate level (column 2)
- Indicate if any targets or goals are currently monitored at the corporate level (regardless of the level that they are set or their coverage). Please explain your response in column 3.
- Note that this refers to the monitoring of targets and goals, and determines the presentation of questions W8.1a and W8.1b. You may have site/basin/country/product targets and goals that are being monitored at the corporate level because they contribute to a corporate wide initiative, or because they are considered important for the company as a whole.
- Only select ‘None’ if no targets or goals are monitored outside of the site/basin/country/business division etc.
Approach to setting and monitoring targets and/or goals (column 3)
- Please give a company-specific description of your general approach to setting water-related targets and goals. This may include the following at any level of your organization:
- how you identify targets and goals relevant to your water risks, impacts, and opportunities or relevant to shared water challenges, and how you prioritize them. For example, you may have a company-wide policy to set targets only in water stressed areas, or to set more aggressive targets in water stressed basins and this involves engagement with river basin authorities to ensure a consolidated approach.
- how you ensure that targets and goals reflect geographic, regulatory, and other contextual factors, such as the use of science-based hydrological models or the needs of other users in a basin.
- any formal motivations (company-wide or other) that drive the setting of targets and goals – such as, adherence to water-related public policy agendas such as the Sustainable Development Goals or local environmental initiatives.
- how forward-looking strategic business plans, informed by scenario analysis tools for example, have influenced your targets and goals.
- any other information that ensures your targets and goals are tracked, progressed in monitored, and they deliver meaningful outcomes for your organization or for other water users.
- If you set water-related targets and goals but none are currently monitored at the corporate level, you should explain here.
- Please provide examples to help CDP data users understand the robustness of your approach to target and goal setting and monitoring.
Explanation of terms
- Goal: A long term qualitative outcome or a specific change in behavior or circumstances.
- Target: A specific measurable output to be achieved within a specific timeline. Targets often act as steps towards a wider and long-term corporate goal.
Example response
|
Levels for targets and/or goals
|
Monitoring at corporate level
|
Approach to setting and monitoring targets and/or goals
|
- Company-wide targets and goals
- Site/facility specific targets
and/or goals
- Brand/product specific targets
and/or goals
- Basin specific targets and/or
goals
|
- Targets are monitored at the
corporate level
- Goals are monitored at the
corporate level
|
In the context of our company’s
non-financial targets, we have assessed water and performance
in a holistic way since 2012. Target setting is
driven by our response to risks and impacts, and the identification of water scarce locations using the WWF
Risk Filter tool. This ensures that targets are meaningful in terms of our
water security commitments. Our company also uses targets to monitor progress
of site-specific water projects and any accompanying initiatives in communities. To address local water
issues, our company sets site specific targets and basin-specific targets that
fit the individual water contexts. These are set and monitored by regional
offices. However, in one key basin where we operate in India, there is a high
reputational risk if water flow restoration targets are not met. This is an
example of a basin level target that is monitored at a corporate level. We also set company-wide targets,
all of which are monitored at the corporate level. These typically
relate to operational efficiency. In addition to this, we have also
set a brand-specific target - the reduction of 10% in product water
intensity by 2025 in our flagship line of precooked rice. Even though this
line represents a very small proportion of our global revenue, it accounted
for over 70% of water use in direct operations in 2017. So, we consider this
brand-specific target an ambitious and important aim locally and at the
corporate level.
|
Additional information
- The case for meaningful water targets that account for local context has been set out in the following publication: Exploring the case for context-based water targets (2017).
- Guidance for companies on how to set site-level water targets that reflect both the local context and global shared goals for water use has been described in the following publication: Setting Site Water Targets Informed by Catchment Context: A Guide for Companies (2019).
This is the result of a collaborative effort between CDP, the CEO Water Mandate, the Pacific Institute, the Nature Conservancy, UNEP-DHI, the World Resources Institute, and WWF.
- CDP is part of a network exploring science-based targets for water, mirroring the successful work of the Science-Based Targets initiative for greenhouse gas emissions in mobilizing companies towards robust environmental impact reduction. Details can be found here: Science Based Targets Network.
- This module of our questionnaire will evolve to reflect developments in good practice in target setting.
(W8.1a) Provide details of your water targets that are monitored at the corporate level, and the progress made.
Question dependencies
- This question only appears if you select “Targets are monitored at the corporate level" in response to column 2 of W8.1.
Change from 2019
Minor change
Rationale
This question provides CDP data users with details about your water-related targets that are monitored quantitatively at the corporate level. They may be significant for progressing water security or reducing other water-related risks, achieving other water commitments or strategic business objectives.
Connection to other frameworks
CEO Water Mandate
Response: Policies, governance and targets
SDG
Goal 6: Clean water and sanitation
Response options
Please complete the following table. The table is displayed over several rows for readability. If you have multiple targets, you are able to add rows by using the “Add Row” button at the bottom of the table.
|
Target reference number
|
Category of target
|
Level
|
Primary motivation
|
Description of target
|
Quantitative metric
|
|
Select from:
- Reference number drop down
|
Select from:
- Response drop-down options below table
|
Select from:
- Company-wide
- Business
- Business activity
- Site/facility
- Brand/product
- Country level
- Basin level
- Other, please specify
|
Select from:
- Response drop-down options below table
|
Text field [maximum 1,000 characters]
|
Select from:
- Response drop-down options below table
|
Baseline year
| Start year
| Target year
| % of target achieved
| Please explain
|
|---|
Numerical field [enter a number between 1900 and 2100 with no
decimal places] | Numerical field [enter a number between 1900 and 2020 with no
decimal places] | Numerical field [enter a number between 2019 and 2100 with no
decimal places] | Percentage field [enter a percentage from 0-100 using a maximum
of 2 decimal places] | Text field [maximum 1,000 characters] |
[Add Row]
Category of target (column 2)
- Water withdrawals
- Water consumption
- Water discharge
- Product water intensity
- Water recycling/reuse
- Water use efficiency
- Water pollution reduction
- Water, Sanitation and Hygiene (WASH) services in the workplace
- Water, Sanitation and Hygiene (WASH) services in the community
|
- Monitoring of water use
- Product use-phase
- Community engagement
- Supplier engagement
- Watershed remediation and habitat restoration, ecosystem preservation
- Impact of packaging material
- Procurement/production of sustainable raw materials (food, beverage & tobacco sector only)
- Other, please specify
|
Primary motivation (column 4)
- Brand value protection
- Cost savings
- Increased revenue
- Sales of new products / services
- Reduced environmental impact
- Recommended sector best practice
- Risk mitigation
|
- Increasing freshwater availability for users/natural environment within the basin
- Commitment to the UN Sustainable Development Goals
- Corporate social responsibility
- Shared value
- Water stewardship
- Climate change adaptation and mitigation strategies
- Other, please specify
|
Quantitative metric (column 6)
Water withdrawals
- Absolute reduction in total water withdrawals
- % reduction in total water withdrawals
- % reduction of water withdrawals from surface water
- % reduction of water withdrawals from groundwater
- % reduction of water withdrawals from municipal supply
- % increase in water withdrawals from third-party sources
- % increase in rainwater harvesting
- % increase in water use met through recycling/reuse
- % reduction per business unit
- % reduction per revenue
- % reduction per product
- Absolute increase in investment related to this category
- % increase in investment related to this category
- % reduction per unit of production
- Other, please specify
Water consumption
- % reduction in total water consumption
- % reduction per business unit
- % reduction per revenue
- % reduction per product
- Absolute increase in investment related to this category
- % increase in investment related to this category
- % reduction per unit of production
- Other, please specify
Water discharge
- % reduction per business unit
- % reduction per revenue
- % reduction per product
- Absolute increase in investment related to this category
- % increase in investment related to this category
- % reduction per unit of production
- % increase in water use met through recycling/reuse
- Other, please specify
Product water intensity
- % reduction per business unit
- % reduction per revenue
- % reduction per product
- Absolute increase in investment related to this category
- % increase in investment related to this category
- % reduction per unit of production
- % increase in water use met through recycling/reuse
- Other, please specify
Water recycling/reuse
- % increase in water use met through recycling/reuse
- Absolute increase in investment related to this category
- % increase in investment related to this category
- Other, please specify
Water use efficiency
- % reduction in total water withdrawals
- % reduction of water withdrawals from surface water
- % reduction of water withdrawals from groundwater
- % reduction of water withdrawals from municipal supply
- % increase in withdrawals from third party sources
- % reduction in total water discharge
- % increase in water use met through recycling/reuse
- Other, please specify
Water pollution reduction
- % proportion of wastewater that is safely treated
- % reduction in concentration of pollutants
- % reduction in water discharge volumes
- Absolute increase in investment related to this category
- % increase in investment related to this category
- Other, please specify
Water, Sanitation and Hygiene (WASH) services in the workplace
- Proportion of employees using safely managed drinking water services
- Proportion of employees using safely managed sanitation services, including a hand-washing facility with soap and water
- % increase in the proportion of employees using safely managed drinking water services
- % increase in the proportion of employees using safely managed sanitation services, including a hand-washing facility with soap and water
- Other, please specify
|
Water, Sanitation and Hygiene (WASH) services in the community
- Proportion of local population using safely managed drinking water services around our facilities and operations around our facilities and operations
- Proportion of local population using safely managed sanitation services, including a hand-washing facility with soap and water around our facilities and operations
- % increase in the proportion of local population using safely managed drinking water services around our facilities and operations
- % increase in the proportion of local population using safely managed sanitation services, including a hand-washing facility with soap and water around our facilities and operations
- Other, please specify
Monitoring of water use
- % sites monitoring water withdrawals total volumes
- % sites monitoring water withdrawals by source
- % sites monitoring water recycling/reuse
- % sites monitoring water discharge total volumes
- % sites monitoring water discharge by destination
- % sites monitoring water discharge quality - by treatment method
- % sites monitoring water discharge quality - by standard effluent parameter
- % sites monitoring water discharge quality - temperature
- % sites monitoring water consumption total volumes
- % sites monitoring the proportion of employees having access to safely managed drinking water and sanitation services around our facilities and operations
- % sites monitoring the proportion of population having access to safely managed drinking water and sanitation services around our facilities and operations
- Other, please specify
Product use-phase
- Absolute increase in revenue from products designed for use-phase resource efficiency
- % increase in revenue from products designed for use-phase resource efficiency
- Other, please specify
Community engagement
- Total number of population participating in community-engagement activities
- % increase in number of population participating in community-engagement activities
- % increase in investment in community engagement initiatives
- Absolute increase in investment in community engagement initiatives
- Other, please specify
Supplier engagement
- % increase in proportion of suppliers engaged
- % increase in number of suppliers engaged
- % increase in investment in supplier engagement initiatives
- Other, please specify
Watershed remediation and habitat restoration, ecosystem preservation
- Total number of watershed remediation and habitat restoration, ecosystem preservation activities
- % increase in watershed remediation and habitat restoration, ecosystem preservation activities
- Improvement in health of water-related ecosystems over time
- % increase in investment in watershed remediation and habitat restoration, ecosystem preservation activities
- Absolute increase in investment in watershed remediation and habitat restoration, ecosystem preservation
- Other, please specify
Impact of packaging material
- % increase of biodegradable packaging material
- % decrease of packaging per product unit
- Other, please specify
Procurement/production of sustainable raw materials (food, beverage & tobacco sector only)
- % reduction in procurement/production of high water impact commodities (food, beverage & tobacco sector only)
- % increase in procurement/production of certified crops (food, beverage & tobacco sector only)
- % increase in procurement/production of crops using sustainable agriculture practices (food, beverage & tobacco sector only)
- % reduction in procurement/production of commodities from water-stressed areas (food, beverage & tobacco sector only)
- % increase in procurement/production of commodities with improved water management practices (food, beverage & tobacco sector only)
- Other, please specify
Other
|
Requested content
General
- This question requests information about your quantitative targets that are currently monitored at the corporate level. These may or may not be company-wide. For example, a company may have a commitment to improve water efficiency that is implemented through locally specific targets and activities that together contribute to a company-wide target. If progress is monitored at the corporate level, this target should be reported here.
- We are not requesting details of targets monitored at the facility, business, basin level etc. If a target is set at the facility, business, basin or country level etc. and it is monitored at the corporate level, because it is significant to the business as a whole, it should be reported.
- Only report targets that are ongoing or have reached completion during the reporting year.
- To add targets, use the “Add Row” button. You may report up to 25 targets.
Target reference number (column 1)
- Select a ‘Target number’ from the drop-down list to allocate a unique identifier to your target. This will allow you to track and report progress for this target in future disclosures to CDP, until the target is retired. The target reference number is not specific to your organization.
Category of target (column 2)
- Select the type of target you wish to report. Your selection will drive the metrics presented in column 6. Refer to the metrics list under the question table to see which quantitative metrics are linked to each category of targets listed (column 6).
- If you select “Other, please specify,” provide a label for the type of target you wish to report.
Level (column 3)
- Select the organizational/geographic/other level or scope that the target applies to. For example, the target may apply to a particular product or a particular industrial process within your business.
Primary motivation (column 4)
- Select the most applicable primary motivation behind the target you are reporting. If you select “Other, please specify,” provide a label for the primary motivation.
Description of target (column 5)
- Provide additional company specific details that will help CDP data users understand your organization’s target, its contribution to water security, and why it was chosen.
- Include a company-specific rationale for the target and its level of ambition, why it is important, and why it is being monitored at the corporate level.
- You may also include, for example:
- If the target is the same for all basins/facilities/products, or if it is aligned with local risk levels, for example;
- If a company-wide target is driven by local challenges; e.g. “Discharge treatment was found to be inadequate across several sites in different geographies. We have set a company- wide goal to review this risk and set a company-wide 100% compliance target to meet or go beyond regulatory requirements;”
- How the target is being implemented and what investment in financial or personnel resources is necessary to achieve the target.
Quantitative metric (column 6)
- The drop-down list presented will depend on the type of target you selected in column 2. Some metrics are linked to more than one category.
- Select the metric used to quantitatively track your progress against the target, or how your organization measures the success of this target. If you select “Other, please specify,” provide a label for the metric.
Baseline year (column 7)
- Enter a whole number between 1900 and 2100 to indicate the baseline against which your target is measured.
- The baseline year may be before, after, or the same as the start year.
Start year (column 8)
- Enter a whole number between 1900 and 2020 to indicate the year that the target was set.
- If you have a year-on-year rolling target, this will be the same as the baseline year in column 7.
- If you have a target based on financial years, please enter the start year for that period. If you have a target based on an average (e.g. five years average), please enter the year that applies to the start of the average period.
Target year (column 9)
- Enter a whole number between 2019 and 2100.
- If you have a year-on-year rolling target, your target year will be the current reporting year.
- If you have a target based on financial years, please enter the end year for that period. If you have a target based on an average (e.g. five years average), please enter the year that applies to the end of the average period.
- You should not report any target that was completed before the start of the reporting year.
% of target achieved (column 10)
- Indicate how much progress your organization has made against the base line year by the end of the reporting year. Please report the value up to two decimal places.
- Note that this value is the percentage of the target that has been achieved, not the overall change achieved. For example, if your organization has a target to reduce water withdrawals by 50% and has so far reduced withdrawals by 20%, then the value to enter into this column would be 40%, not 20%.
Please explain (column 11)
- Provide an explanation of the level of progress reported in column 10 (% achieved), whether this matches anticipated progress, if the original target has been revised in any way, and if so, why.
- You may comment on the Baseline, Start, or Target year.
Explanation of terms
- Product water intensity: A metric providing
the relationship between a volumetric aspect of water and a unit of product
created.
Example response
| Target reference number
|
Category of target
|
Level
|
Primary motivation
|
Description of target
|
Quantitative metric
|
Baseline year
|
Start year
|
Target year
|
% achieved
|
Please explain
|
| Target 1 |
Water withdrawals |
Company-wide |
Cost savings
|
Our intention is to reduce absolute water withdrawals by our wholly-owned breweries across the whole company by 50% by 2030, against a baseline year of fiscal 2010. Water use was identified as our most material environmental impact and this challenging reduction target is a key pillar of water security as published in our Corporate Sustainability Strategy for the next 3 years. It will also lead to efficiency savings.
In order to achieve this, we have invested heavily in developing new products and processes which require less water.
|
Absolute reduction in total water withdrawals |
2010 |
2018 |
2030 |
65 |
As we have achieved 65% already, we are on track to meet this target early as long as progress maintains present pace.
|
| Target 2 |
Water pollution reduction |
Basin level |
Water stewardship |
As a major stakeholder in the Tana river basin, we are working towards reducing our impact on freshwater resources. To this end we have set an ambitious target of reducing concentrations of nitrogen and phosphorous in all our facility discharges in the Tana basin by 70% by 2020..
We have been working collaboratively with the basin regulator to help safeguard the quality and availability of resources in the basin.
|
% reduction in concentration of pollutants
|
2005 |
2015 |
2020 |
75 |
We started this in 2015 and have achieved 75% of the target with two years to go. Several large investments which are now coming to fruition will help us exceed the full target in the next two years. We expect that by 2020 we will have reduced concentrations of nitrogen and phosphorous by at least 80% across all facilities in the Tana basin, and in many facilities nitrogen concentrations in discharges will be nil. We may revise this target accordingly before 2020.
|
| Target 3 |
Product use phase |
Water stewardship |
Sales of new products / services
|
We are aiming to have all products in our ranges that are branded as ‘smart appliances’ equipped with meters to monitor their water use by 2025 where appropriate.
In the last four years we have already introduced energy and water saving technology into most of our home appliances and in achieving this target we aim to capitalize on this by demonstrating to consumers how our commitment to sustainability translates into concrete savings.
|
Absolute increase in revenue from products designed for use phase efficiency
|
2017 |
2017 |
2025 |
14.2 |
By 2018 our ‘smart appliances’ range comprised 7 different products of which 1 was equipped with a networked meter. We are therefore 14.2% towards achieving this target.
We predict that by 2020 we will have 23 smart appliances on the market and plan to have 10 of these equipped with monitoring technology. In addition, 4 current products will be retired before 2025, giving us good confidence in our abilities as a company to meet our target by 2025.
|
(W8.1b) Provide details of your water goal(s) that are monitored at the corporate level and the progress made.
Question dependencies
- This question only appears if you select "Goals are monitored at the corporate level" in response to column 2 of W8.1.
Change from 2019
No change
Rationale
CDP data users wish to know if your organization has any qualitative goals (without a tracked, time-specific, quantitative target) related to water and how they contribute to water security, reducing other water-related risks, and/or achieving other water commitments or strategic business objectives.
Connection to other frameworks
CEO Water Mandate
Response: Policies, governance and targets
SDG
Goal 6: Clean water and sanitation
Response options
Please complete the following table. You are able to add rows by using the “Add Row” button at the bottom of the table.
| Goal
|
Level
|
Motivation
|
Description of goal
|
Baseline year
|
Start year
|
End year
|
Progress
|
Select from:
- Response drop-down options below table
|
Select from:
- Company-wide
- Business
- Business activity
- Site/facility
- Brand/product
- Country level
- Basin level
- Other, please specify
|
Select from:
- Response drop-down options below table
|
Text field [maximum 1,500 characters]
|
Numerical field [enter a number between 1900 and 2100 with no decimal
places]
|
Numerical field [enter a number between 1900 and 2020 with no
decimal places]
|
Numerical field enter a number between 2019 and 2100 with no
decimal places]
|
Text field [maximum 1,500 characters]
|
[Add Row]
Goal (column 1)
|
Providing access to safely managed Water, Sanitation and Hygiene (WASH) in workplace
Providing access to safely managed Water, Sanitation and Hygiene (WASH) in local communities
Engaging with local community
Engaging with customers to help them minimize product impacts
Engagement with public policy makers to advance sustainable water management and policies
Engagement with suppliers to help them improve water stewardship
|
Engagement with suppliers to reduce the water-related impact of supplied products
Promotion of sustainable agriculture practices
Watershed remediation and habitat restoration, ecosystem preservation
Promotion of water data transparency
Reduce environmental impact of product in use phase
Improve wastewater quality beyond compliance requirements
Other, please specify
|
Motivation (column 3)
- Brand value protection
- Cost savings
- Increased revenue
- Sales of new products / services
- Reduced environmental impact
- Recommended sector best practice
- Risk mitigation
|
- Commitment to the UN Sustainable Development Goals
- Increasing freshwater availability for users/natural environment within the basin
- Corporate social responsibility
- Shared value
- Water stewardship
- Climate change adaptation and mitigation strategies
- Other, please specify
|
Requested content
General
- A goal is considered to be a qualitative outcome or a change in behavior or circumstances (such as ‘improving water governance’), whereas a target is generally a specific, measurable output to be achieved within a specific timeline. A target could act to support a goal - as a quantitative assessment of progress.
- This question requests information about your goals that are currently monitored at the corporate level. These may or may not be company-wide goals but if progress is monitored at the corporate level, this goal may be reported here.
- We are not requesting details of goals set or monitored at the facility, business, basin level etc., unless they are significant to the business as a whole and therefore monitored at the corporate level.
- Only report goals that are ongoing or have reached completion during the reporting year.
- To add goals, use the “Add Row” button. You may report up to 25 goals.
Goal (column 1)
- Select the option that best matches your organization’s goal. If there is not an option that is applicable, select “Other, please specify” to provide a label for the goal.
- You should provide more details of your goal in column 4.
Level (column 2)
- Select the organizational/geographic/other level or scope that the goal applies to. For example, the goal may apply to a particular product or a particular industrial process within your business. If you select “Other, please specify,” provide a label for the level.
Motivation (column 3)
- Select the most applicable motivation behind the goal you are reporting. If you select “Other, please specify,” provide a label for the primary motivation.
Description of goal (column 4)
- Provide additional details that will help data users to understand your organization’s goal, its contribution to water security and why it was chosen.
- Include a company-specific rationale for the goal and its level of ambition, why it’s important, and why it is being monitored at the corporate level.
- You should also include:
- Why this goal was adopted for the level indicated in column 2;
- If the goal is the same for all basins/facilities/products, or if it is aligned with local risk levels, for example;
- How your company is implementing the goal at the associated level. You may give details of the financial and personnel resources that have been committed to achieving it.
Baseline year (column 5)
- Please enter a whole number between 1900 and 2100 to indicate the baseline against which your goal is assessed.
- The baseline year may be before, after, or the same as the start year.
Start year (column 6)
- Please enter a whole number between 1900 and 2020 to indicate the year that the goal was set.
- If you have a year-on-year rolling goal, this will be the same as the baseline year in column 6.
- If you have a goal based on financial years, please enter the start year for that period.
- If you have a goal based on an average (e.g. five years average), enter the year that applies to the start of the average period.
End year (column 7)
- Please enter a whole number between 2019 and 2100.
- If you have a year-on-year rolling goal, your end year will be the current reporting year.
- If you have a goal based on financial years, please enter the end year for that period.
- If you have a goal based on an average (e.g. five years average), enter the year that applies to the end of the average period.
- You should not report any goal that was completed before the start of the reporting year.
Progress (column 8)
- For each goal, specify the progress that has been achieved by the end of the reporting year.
- Provide details as to how your organization assesses the progress made, the indicators you use and how will you know when the goal has been achieved, e.g. the thresholds of success.
(W8.1c) Why do you not have water target(s) or goal(s) and what are your plans to develop these in the future?
Question dependencies
- This question only appears if you select “Our company sets no targets or
goals" in response to column 1 of W8.1.
Change from 2019
No change
Rationale
Investors need an explanation as to why you do not have water-related targets or goals in place, especially if you have indicated a dependency on water or substantive water risks.
Response options
Please complete the following table:
| Primary reason
|
Please explain
|
|
Select from:
- We are planning to introduce a target or goal within the next two years
- Important but not an immediate business priority
- Judged to be unimportant, explanation provided
- Lack of internal resources
- Insufficient data on operations
- No instruction from management
- Other, please specify
|
Text field [maximum 1,500 characters]
|
Requested content
Primary reason (column 1)
- If you select “Other, please specify,” provide a label for the primary reason.
Please explain (column 2)
- Please use this open text field to provide any relevant details explaining why your organization does not have any targets or goals for the reporting year.
- If your organization has plans to develop these in the future, please include any information detailing your future plans here.
W9 Verification
Pathway diagram - questions
This diagram shows the questions contained in module W9. To access question-level guidance, use the menu on the left to navigate to the question.
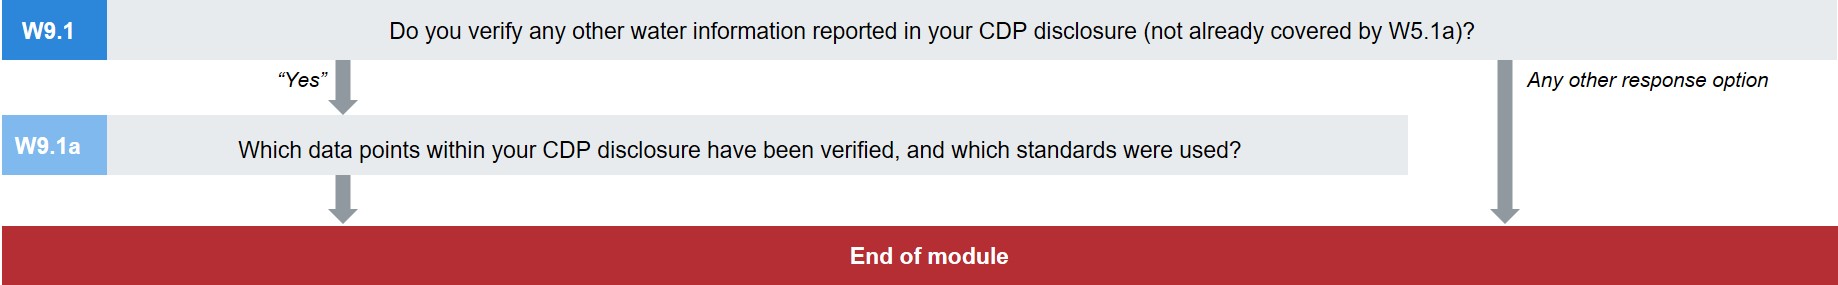
Verification of water information
(W9.1) Do you verify any other water information reported in your CDP disclosure (not already covered by W5.1a)?
Question dependencies
- Your response to W9.1 will determine whether W9.1a is presented. If your response to W9.1 is amended, data in W9.1a may be erased. In this case, be sure to re-enter data for W9.1a.
Change from 2019
Minor change (2019 W10.1)
Rationale
CDP data users often ask about the credibility/quality of data disclosed. The information requested in this question could help strengthen confidence in your organization’s response to the water security questionnaire. CDP supports the development and use of verification methodologies as it promotes good practice in environmental disclosure.
To date the water security questionnaire has asked about verification of water accounting metrics only (W5). However, we have heard from companies, investors, and buyers that other data and reported activities are being verified and assured. CDP will collect this information to allow leading companies to report their efforts, and to highlight trends that CDP data users might begin to view as best practice among companies in the future.
Response options
Select one of the following options:
- Yes
- In progress
- No, but we are actively considering verifying within the next two years
- No, we are waiting for more mature verification standards and/or processes
- No, we do not currently verify any other water information reported in our CDP disclosure
Requested content
General
- CDP recognizes the lack of universally applied verification standards for water and therefore requests that you disclose the extent of any current verification practices and the standards currently used. This information will guide future development of questions on verification.
- Verified information about facilities which are not exposed to risks with the potential to have a substantive financial or strategic impact on your organization (and which were therefore not reported on in module W5) can be disclosed here.
- If you select ‘Yes’, you may attach a copy of your verifier’s report or equivalent document. This is optional but will support the robustness of your disclosure.
Explanation of terms
- Verification (external): Procedure carried out by an independent third party for checking that a product, process, service or system meets the requirements specified by a recognized and relevant standard.
(W9.1a) Which data points within your CDP disclosure have been verified, and which standards were used?
Question dependencies
- This question only appears if you select “Yes” in response to W9.1.
Change from 2019
No change (2019 W10.1a)
Rationale
This information gives data-users confidence in the information provided in the company’s response. It allows leading companies to report their efforts on this, and highlights trends in verification and assurance that investors and purchasing companies might expect in the future.
Response options
Please complete the following table. You are able to add rows to this table using the “Add Row” button at the bottom of the table.
| Disclosure module
|
Data verified
|
Verification standard
|
Please explain
|
|
Select from:
- W0 Introduction
- W1 Current state
- W2 Business impacts
- W3 Procedures
- W4 Risks and opportunities
- W6 Governance
- W7 Strategy
- W8 Targets
- SW Supply chain module
|
Text field [maximum 1,000
characters]
|
Select from:
- AA1000AS
- ASAE3000
- Alliance for Water Stewardship certification
- Compagnie Nationale des Commissaires aux Comptes (CNCC)
- IDW AsS 821: IDW Assurance Standard: Generally Accepted Assurance Principles for the Audit or Review of Reports on Sustainability Issues
- ISAE 3000
- RevR6 Procedure for assurance of sustainability report
- Other, please specify
|
Text field [maximum 2,000 characters]
|
[Add Row]
Requested content
General
- Companies with existing verification programs may report their current verification practice to CDP and its data users. CDP is not making any judgement of the validity of any particular verification approach or standard, or a lack of verification, at this stage.
- For organizations presented with Module 5, information about the verification of facility-level accounting data is requested in W5.1a.
Data verified (column 2)
- For each module selected in column 1, state the reported information that has been verified. Where possible reference specific CDP question numbers and columns/rows where applicable.
Verification standard (column 3)
- The list contains some standards relevant to water which have previously been reported to CDP. Inclusion here does not mean that CDP has made a judgement about any standards or is promoting the use of any particular standard above another.
- Note that this list is not a comprehensive list of all acceptable water-related verification standards. It is provided to aid CDP data analysis and facilitate reporting.
- If you select “Other, please specify”, provide a label for the verification standard. When providing a verification standard not currently listed as a drop-down response, please be as accurate as possible. This ensures CDP will be able to assess these options in future years and consider adding to the list of standards provided in this question.
Please explain (column 4)
- Use this opportunity to describe why your company has chosen to verify the selected data points, and how the use of the standard was determined.
- You can also describe here the frequency with which you complete this verification and the scope it encompasses.
W10 Signoff
Pathway diagram - questions
This diagram shows the questions contained in module W10. To access question-level guidance, use the menu on the left to navigate to the question.
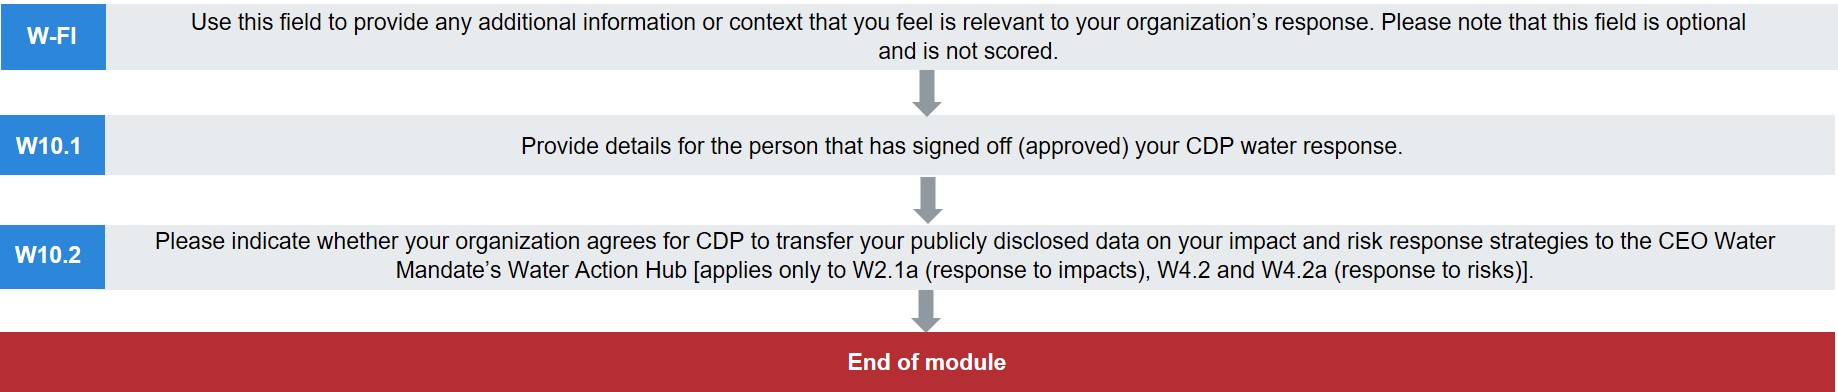
Pathway diagram - questions for minimum version questionnaire
This diagram shows the questions contained in module W10 that are included in the minimum version of the questionnaire. To access question-level guidance, use the menu on the left to navigate to the question.
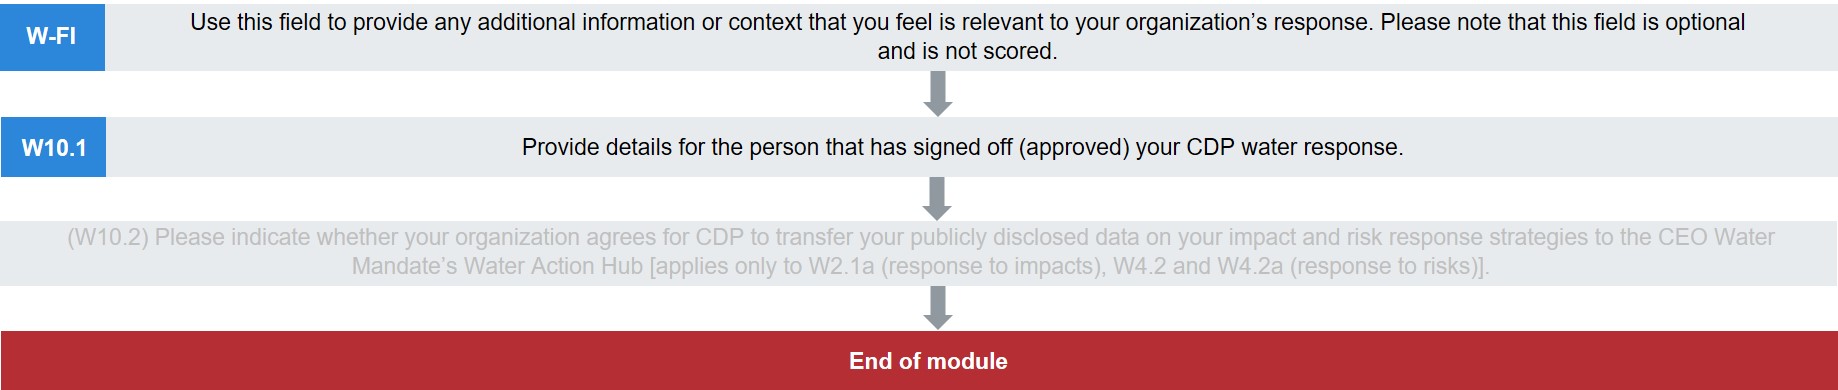
Further information
(W-FI) Use this field to provide any additional information or context that you feel is relevant to your organization's response. Please note that this field is optional and is not scored.
Response options
This is an open text question with a limit of 9,999 characters.
When copying from another document into the disclosure platform, formatting is not retained.
Note
- You may attach a file. This is optional.
Signoff
(W10.1) Provide details for the person that has signed off (approved) your CDP water response.
Change from 2019
No change (2019 W11.1)
Rationale
CDP asks companies to identify the job title and corresponding job category of the person signing off (approving) the CDP response.
This information indicates to investors where in the corporate structure direct responsibility is being taken for the response and the information contained therein.
Response options
Please complete the following table:
| Job title
|
Corresponding job category
|
|
Text field [maximum 200 characters]
|
Select from:
- Board Chair
- Board/Executive board
- Director on board
- Chief Executive Officer (CEO)
- Chief Financial Officer (CFO)
- Chief Operating Officer (COO)
- Chief Procurement Officer (CPO)
- Chief Risk Officer (CRO)
- Chief Sustainability Officer (CSO)
- Other C-Suite Officer
- President
- Business unit manager
- EHS manager
- Energy manager
- Environment/Sustainability manager
- Facilities manager
- Process operation manager
- Procurement manager
- Public affairs manager
- Risk manager
- Other, please specify
|
Requested content
General
- Please enter the job title for the person who has approved this disclosure to CDP.
- Select the best match for the "Corresponding job category", or select 'Other, please specify'. For example, if the job title is Director of Sustainability, the best match selection in column 2 would be Chief Sustainability Officer.
- If you select “Other, please specify”, provide a label for the corresponding job category.
- Note that this question asks about the position and not about the name of the individual holding this position. Do not include the name of any individual or any other personal data in your response.
Water Action Hub
(W10.2) Please indicate whether your organization agrees for CDP to transfer your publicly disclosed data on your impact and risk response strategies to the CEO Water Mandate’s Water Action Hub [applies only to W2.1a (response to impacts), W4.2 and W4.2a (response to risks)].
Change from 2019
No change (2019 W11.2)
Rationale
Addressing water risks effectively, in many instances, requires collective action. CDP would like to support you in finding potential partners that are also working to tackle water challenges in the river basins you report on.
The CEO Water Mandate Water Action Hub is an online platform that catalogues water stewardship projects around the world and enables interested parties to connect and work together to solve local and regional water challenges.
Note: If you select ’Yes’, CDP will provide your public response data from three questions to the CEO Water Mandate’s Water Action Hub. Only your responses to W2.1a (response to impacts), W4.2 and W4.2a (response to risks) will be shared and reviewed as potential water stewardship projects for upload to the Water Action Hub website.
Response options
Select one of the following options:
Requested content
General
- By selecting “Yes”, you agree that CDP may share your response to specific data points and the email address of your Main User with the CEO Water Mandate Secretariat.
- Only your responses to the following data points will be shared:
- W2.1a (Water-related detrimental impacts): Country/Area; River basin; Primary response; Description of response
- W4.2 and W4.2a (Water risks and responses): Country/Area; River basin; Primary response to risk; Description of response
- Your contact information will be kept confidential. This will allow the Hub administrator to alert your company if its response data includes a project with potential for inclusion on the Hub. For a two-week period, you will have an opportunity to review and amend the project details. You can also choose not to publish the project. After this period, the project will be published and your company notified. Log-in information provided to you directly from the CEO Water Mandate Secretariat will enable you to make amendments to the project profile at any time.
SW Supply chain
Module Overview
The SW module is for companies responding to the CDP water security questionnaire at the request of one or more customers, that are members of CDP's supply chain program. This module has been developed following consultation with both suppliers and the member companies. Its purpose is to facilitate improved understanding for customers of their supplier’s water management through a set of supplier-specific questions.
The information disclosed here builds on information that CDP supply chain members are particularly interested in elsewhere in the water security questionnaire including; facilities exposed to water risk, projects to improve water stewardship, and aspects of water accounting. The module should be completed in addition to the full water security questionnaire and is composed of four sections: SW0 'Supply chain introduction', SW1 'Facility details', SW2 'Collaborative opportunities', and SW3 'Water intensity (SW)' (not presented to minimum tier respondents).
Please note that your response to the SW module is not scored.
Key changes
- Changes have been made to response options in this module. If you disclosed to CDP in the previous reporting year, please review your auto-populated responses carefully. It is your responsibility to ensure the accuracy and completeness of your current disclosure.
- Click here for a list of all changes made this year.
Pathway diagram - questions
This diagram shows the supply chain questions contained in module SW. To access question-level guidance, use the menu on the left to navigate to the question.
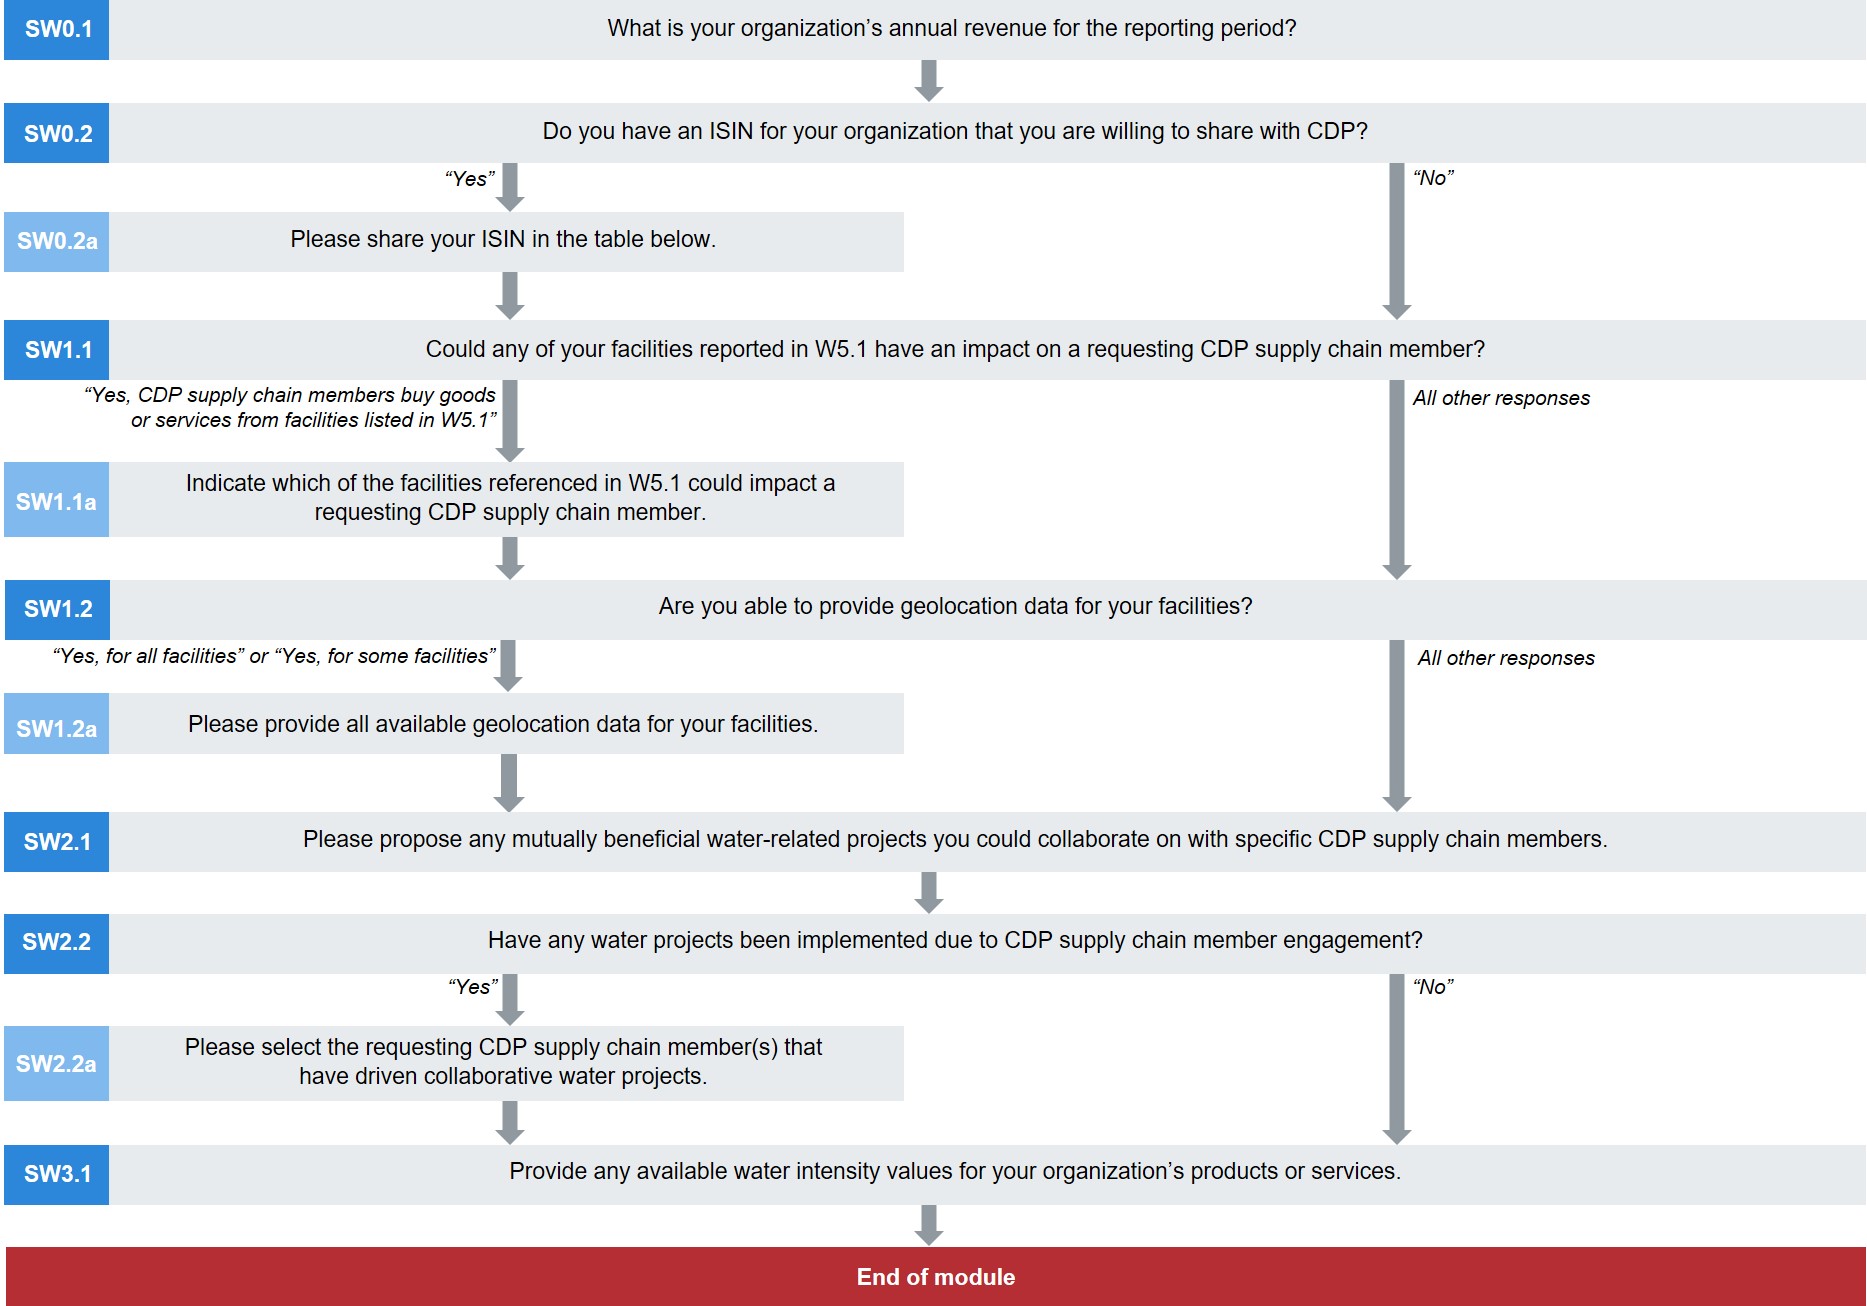
Pathway diagram - questions for minimum version questionnaire
This diagram shows the questions contained in module SW that are included in the minimum version of the questionnaire. To access question-level guidance, use the menu on the left to navigate to the question.
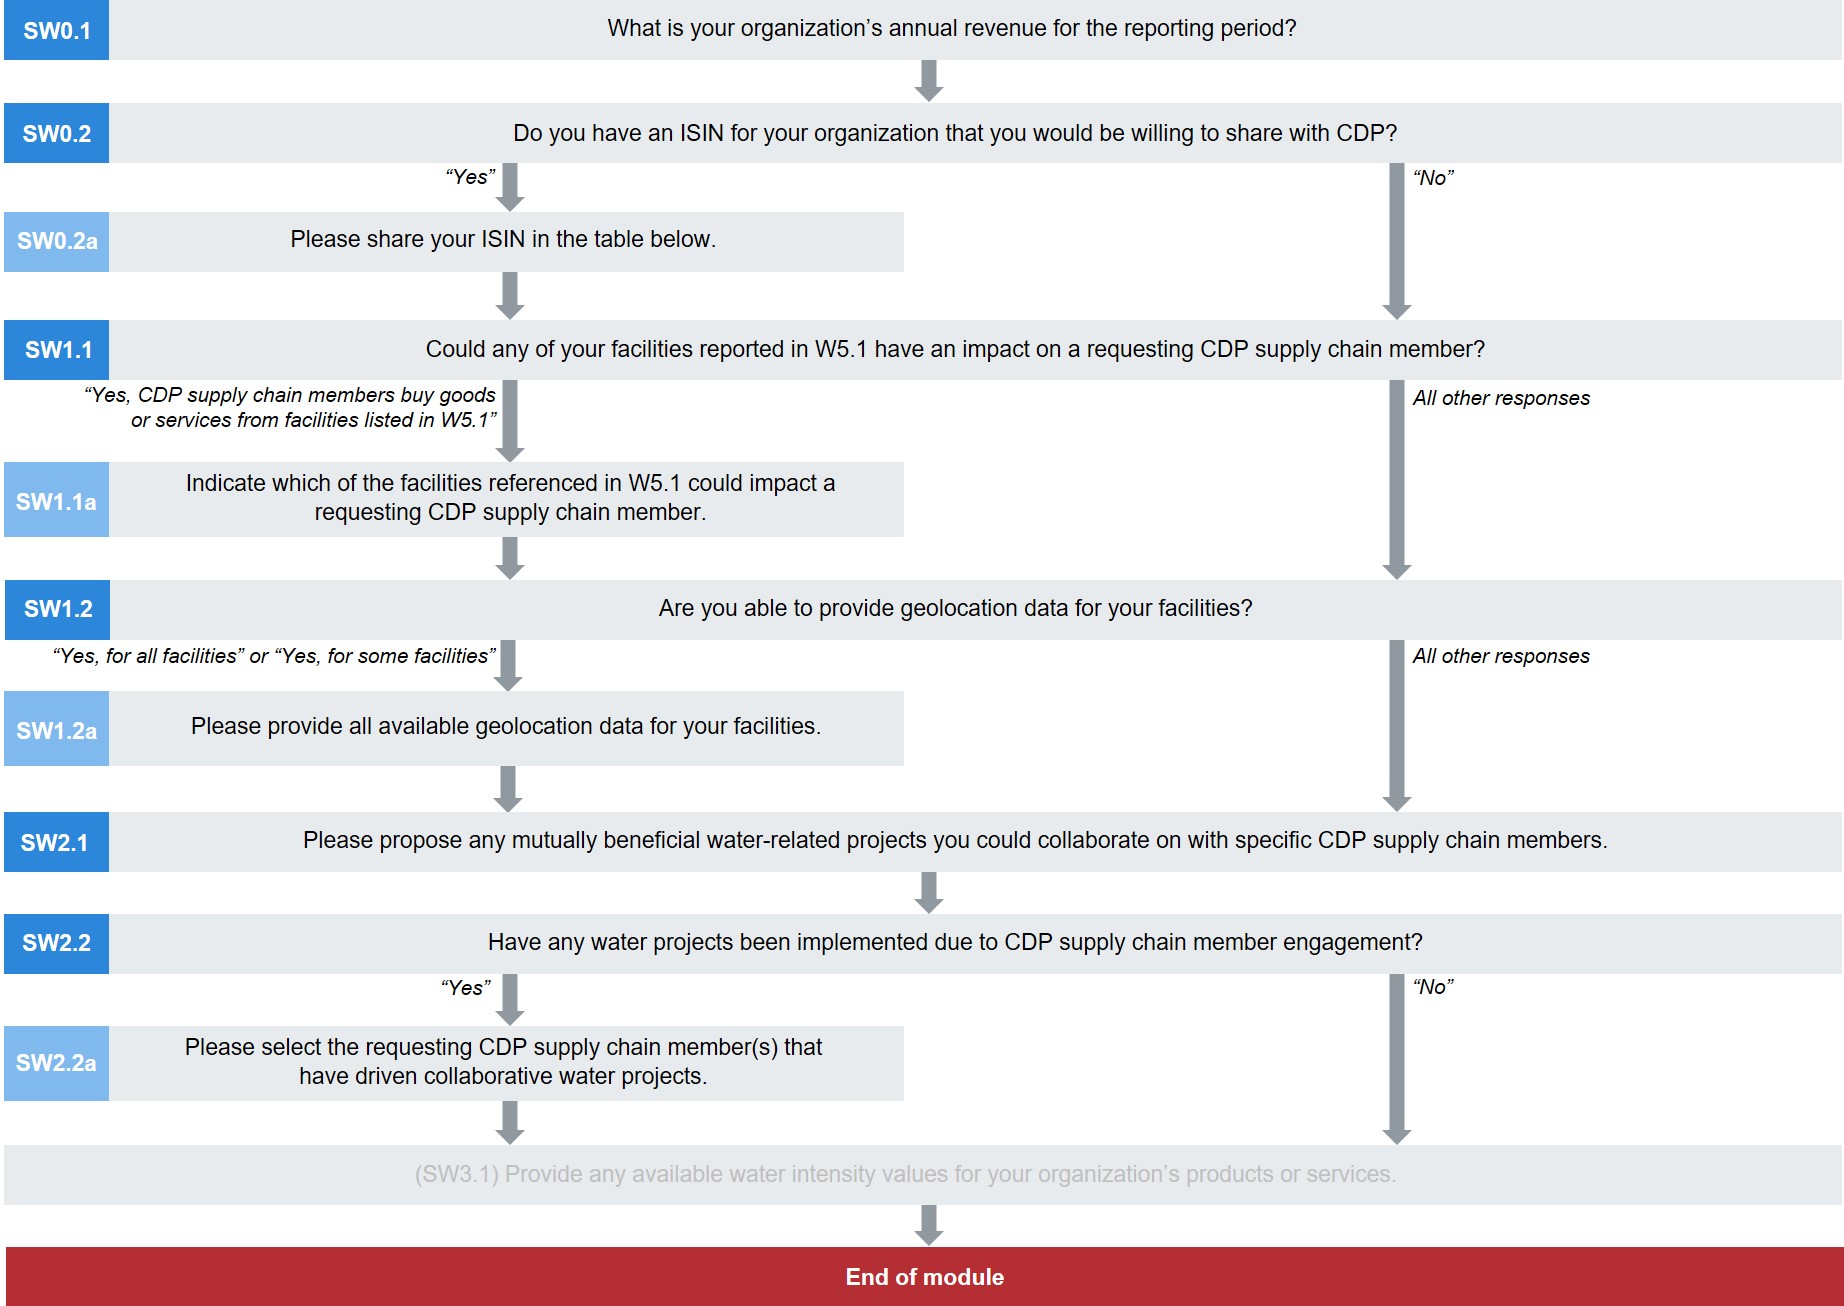
Supply chain introduction
(SW0.1) What is your organization’s annual revenue for the reporting period?
Change from 2019
Additional guidance
Rationale
Annual revenue for the reporting period provides contextual information for requesting CDP supply chain members.
Response options
Please complete the following table:
| Annual revenue
|
|
Numerical field [enter
a number from 0-999,999,999,999,999 using a maximum of 2 decimal places]
|
Requested content
General
- Enter a numerical value for the revenue generated by your organization during the reporting period disclosed in W0.2.
- Enter the figure for "Annual revenue" as would be declared in your financial statement (sometimes referred to as "turnover" or "sales"). Under the International Financial Reporting Standard this would be the inflow of income arising in the course of an entity's ordinary activities, with deductions made (such as for sales returns, allowances, and discounts). This figure is commonly used by investors to assess the income-generating ability of a business.
- This figure should be in the same currency that you selected for all financial information disclosed throughout your response in question W0.4.
Explanation of terms
- Revenue: Income arising in the course of an entity's ordinary activities (less discounts, allowances and returns) - before deducting costs for the goods/services sold and operating expenses to arrive at profit (based on the International Financial Reporting Standard).
(SW0.2) Do you have an ISIN for your organization that you are willing to share with CDP?
Question dependencies
- Your response to SW0.2 will determine if subsequent questions are presented in this section. If your response to SW0.2 is amended, data in those dependent questions may be erased. In this case, be sure to re-enter data for all relevant questions. The guidance for each question indicates if it is a dependent question.
Change from 2019
No change
Rationale
If available, responding companies should disclose their ISIN. This unique identifier is critical for tracking your response through CDP's data system and this facilitates data analysis.
Response options
Select one of the following options:
Requested content
General
- Select “Yes” if you have been issued an ISIN by a National Numbering Agency (NNA) and can share it.
Explanation of terms
- ISIN: The International Securities Identification Number is a 12-character alphanumeric code used to identify a security, such as a stock or bond. It is structured with the first two digits referencing the country of origin for the security. The second grouping consists of nine characters and is the unique identifying code for the security, in the U.S. and Canada this is known as the CUSIP number. The final digit is the check digit, which ensures the authenticity of the code. (Adapted from www.isin.org)
Additional information
(SW0.2a) Please share your ISIN in the table below.
Question dependencies
- This question only appears if you select “Yes” in response to SW0.2.
Change from 2019
No change
Rationale
If available, responding companies should disclose their ISIN. This unique identifier is critical for tracking your response through CDP's data system and this facilitates data analysis.
Response options
Please complete the following table:
| ISIN country code |
ISIN numeric identifier (including single check digit)
|
| Text field [maximum two characters] |
Text field [maximum 10 characters] |
Requested content
General
- Ensure that you disclose the correct ISIN country code for the country of origin for the issuer of the security. This should be in accordance with ISO 3166.
- The ISIN numeric identifier is an alphanumeric string of 9-characters (known as the CUSIP code in the US and Canada) plus a single check digit.
Example response
| ISIN country code | ISIN numeric identifier (including single check digit) |
|---|
| AB | 1234567890 |
Facility details
(SW1.1) Could any of your facilities reported in W5.1 have an impact on a requesting CDP supply chain member?
Question dependencies
- Your response to SW1.1 will determine if subsequent questions are presented in this section. If your response to SW1.1 is amended, data in those dependent questions may be erased. In this case, be sure to re-enter data for all relevant questions. The guidance for each question indicates if it is a dependent question.
Change from 2019
Minor change
Rationale
In W4.1c you were asked to identify the number of your facilities exposed to water-related risks that could have a substantive financial or strategic impact on your business. In W5.1 you then reported water accounting data for these facilities.
This question asks whether any of these facilities could have an impact on a requesting CDP supply chain member.
Response options
Select one of the following options:
- Yes, CDP supply chain members buy goods or services from facilities listed in W5.1
- No, CDP supply chain members do not buy goods or services from facilities listed in W5.1
- No facilities were reported in W5.1
- We do not have this data but we intend to collect it within two years
- We do not have this data and have no intentions to collect it
- This is confidential
Explanation of terms
- Requesting CDP supply chain member: Companies working with CDP’s supply chain program to manage climate change impacts, deforestation risks, and/or water security in their supply chain. If you are responding to CDP because of a request from your customer(s), you will need to answer the relevant (SC, SF, and/or SW) Supply chain module in addition to the main questionnaire.
(SW1.1a) Indicate which of the facilities referenced in W5.1 could impact a requesting CDP supply chain member.
Question dependencies
- This question only appears if you select “Yes, CDP supply chain members buy goods or services from facilities listed in W5.1” in response to SW1.1.
Change from 2019
Minor change
Rationale
Indicating which of your customers use goods or services produced by facilities referenced in W5.1 will help them understand and take action to respond to their risk exposure.
Response options
Please complete the following table. You are able to add rows using the “Add Row” button at the bottom of the table.
| Facility reference number
|
Facility name
|
Requesting member
|
Description of potential impact on member
|
Comment
|
|
Select from:
- Reference number drop down
|
Text field [maximum 500 characters]
|
Select from:
|
Text field [maximum 1,000 characters]
|
Text field [maximum 1,000 characters]
|
[Add Row]
Requested content
General
- For each facility identified in W5.1, consider whether goods or services produced there are used by a requesting CDP supply chain member.
- For example, if you reported on 10 facilities exposed to substantial water risk in W5.1 and only “Facility 3” (as labelled in W5.1) produces goods or services used by a CDP supply chain program that requests your disclosure, select “Facility 3” from column 1 (Facility reference number) and the requesting member from column 3.
Facility reference number (column 1)
- The facility reference number is used by CDP to track information related to the same facility in your disclosure. It is not specific to your organization, however it does prevent you from having to repeat contextual information e.g. country/area and river basin in multiple questions.
- Ensure that the facility reference numbers used here correspond to the numbers you allocated these facilities in W5 (Facility-level water accounting).
Facility name (column 2)
- This is optional. You can use this field to add a facility name provided in W5.1 if one exists.
Requesting member (column 3)
- Select from this column a requesting CDP supply chain member that could potentially be impacted by water risk at a facility identified in W5.1. If there are more than one for the facility indicated in column 1, please add a row to this table.
- Only select a member that uses goods or services produced at the facility indicated in column 1 (Facility reference number).
- Note that the information you give in each row will only be visible to the member you select in column 3. No other members will be able to see the data. If you enter any information without selecting a requesting member here, your answer will not be viewable at all.
Comment (column 5) (optional)
-
State if the facility is an aggregate of multiple locations, and ensure you explain how your methodology for aggregating facilities was applied.
(SW1.2) Are you able to provide geolocation data for your facilities?
Question dependencies
- Your response to SW1.2 will determine if subsequent questions are presented in this section. If your response to SW1.2 is amended, data in those dependent questions may be erased. In this case, be sure to re-enter data for all relevant questions. The guidance for each question indicates if it is a dependent question.
Change from 2019
Minor change
Rationale
This information will be useful for requesting members to link your data with water stress maps, and the types of risk exposure in those water stressed areas.
Response options
Please complete the following table:
| Are you able to provide geolocation data for your facilities? | Comment |
|---|
Select from:- Yes, for all facilities
- Yes, for some facilities
- No, not currently but we intend to provide it within the next two years
- No, we do not have this data and have no plans to collect it
- No, this is confidential data
| Text field [maximum 1,000 characters] |
Requested content
Comment (column 2) (optional)
- If you select "Yes, for some facilities" in column 1, please indicate an approximate proportion.
(SW1.2a) Please provide all available geolocation data for your facilities.
Question dependencies
- This question only appears if you select “Yes, for all facilities” or “Yes, for some facilities” in response to SW1.2.
Change from 2019
Minor change
Rationale
This information will be useful for requesting members to link CDP data with maps which show areas of greater water stress, and the types of risk exposure in those water stressed areas.
Response options
Please complete the following table. You are able to add rows to this table using the “Add Row” button at the bottom of the table.
| Identifier |
Latitude
|
Longitude
|
Comment
|
- Text field [maximum 500
characters]
|
Numerical field [enter a number from 0 to +/-90.000000 using a maximum of 6 decimal places]
|
Numerical field [enter a number from 0 to +/-180.000000 using a maximum of 6 decimal places]
|
Text field [maximum 1,000
characters]
|
[Add Row]
Requested content
General
- Please include all your facilities if possible. You may also include any facilities already reported in W5.1.
- Please comment on the completeness of this dataset. Use the “Comment” column of row 1 (Facility 1) for this. If you responded “Yes, for some” in SW1.2, include any plans to improve your coverage.
Identifier (column 1)
- This is optional. Use this field if you have a company-specific identifier for your facilities (such as a facility name or code).
Latitude (column 2)
- Enter the latitude coordinates for the facility reported in column 1. Your response should be in the format of decimal degrees and can range from 0 to +/-90.000000.
- If you are disclosing for a cluster of facilities (in accordance with the guidance for W4.1b), you may provide the coordinates for the facility with the largest total withdrawal volumes.
Longitude (column 3)
- Enter the longitude coordinates for the facility reported in this row. Your response should be in the format of decimal degrees and can range from 0 to +/-180.000000.
- If you are disclosing for a cluster of facilities (in accordance with the guidance for W4.1b), you may provide the coordinates for the facility with the largest total withdrawal volumes.
Comment (column 4) (optional)
- If the ‘facility’ is an aggregate of multiple locations, ensure that you state this and explain how your methodology for aggregating facilities was applied here.
- If you are unable to provide geolocation data for any facilities, please use this column to explain your coverage and any plans to collect this data in future.
Explanation of terms
- Latitude and longitude: Geographic coordinates that specify, respectively, the north-south and east-west position, of a point on the Earth's surface. They are expressed as angular measures and thus, latitude can vary from 0 to +/-90 and longitude from 0 to +/-180.
Additional information
- The geodetic system that should be used is the WGS 84, which is the system used by GPS (Global Positioning System), Google Maps, Google Earth and most major web applications providing coordinates to users.
- If you wish to find geo-location data for your facilities, there are various web tools for obtaining latitude and longitude coordinates according to WGS84, e.g. iTouchMap allows you to enter an address or identify a location on a map and will return the latitude and longitude coordinates.
Collaborative opportunities
(SW2.1) Please propose any mutually beneficial water-related projects you could collaborate on with specific CDP supply chain members.
Change from 2019
No change
Rationale
These questions aim to understand the opportunities you and your customer can pursue to improve water impacts and water security, and to mitigate water risks to both businesses. It can also be used to strengthen communication between you and your customers and help drive innovative new partnerships. As many companies are at the beginning of their water stewardship progression, this is a way in which both suppliers and customers can establish best practice. Consider this an opportunity to think about new ways that you can work with your customer(s) to reduce water-related risks and impacts to your business, improve water security and/or to realize opportunities that would benefit both your business and your customer(s).
Response options
Please complete the following table. You are able to add rows to this table using the “Add Row” button at the bottom of the table.
| Requesting member
|
Category of project
|
Type of project
|
Motivation
|
Estimated timeframe for achieving project
|
Details of project
|
Projected outcome
|
|
Select from:
|
Select from:
- New product or service
- Relationship water assessment
- Change to provision of goods and services
- Promote river basin collective action
- Communications
- Other
|
Select from:
- Response drop-down options below table
|
Text field [maximum 500 characters]
|
Select from:
- Up to 1 year
- 2 to 3 years
- 4 to 5 years
- Other, please specify
|
Text field [maximum 2,500 characters]
|
Text field [maximum 2,500 characters]
|
[Add Row]
Type of project (column 3)
New product or service
- New product or service that reduces customers' operational water consumption
- New product or service that reduces customers' products/services water consumption
- New product or service that has a lower upstream water impacts
- Other, please specify
- Reduced packaging water impacts
- Other, please specify
Relationship water assessment
- Assessing products' or services' water-related impacts to identify efficiencies
- Water audit of existing relationship
- Aligning goals to feed into customers targets and ambitions
- Other, please specify
Change to provisioning of goods and services
- Reduced water-related impacts
- Other, please specify
|
Promote river basin collective action
- Invite customer to collaborate with other users in their river basins to reduce impact
- Other, please specify
Communications
- Awards – apply for external awards together
- Joint case studies or marketing campaign
- Other, please specify
Other
|
Requested content
General
- Provide information on any new water-related collaborative projects you would like to propose to a requesting CDP supply chain member. Please do not include details of existing water-related collaborative projects which your customer will already be aware of.
- This is optional. You are not obliged to complete this question if you do not have any proposals.
Requesting member (column 1)
- Select from this column any requesting member that you have identified as a potential collaborator.
- If you would like to collaborate with more than one member on the same project you should add a row for each member.
- Note that only the member you select in column 1 will be able to see the data in that row. If you enter any information without selecting a requesting member here, your answer will not be viewable at all.
Category of project/Type of project (columns 2-3)
- Your selection in column 2 will determine the options shown in column 3.
- If you select “Other, please specify” in column 3, provide a label for the type of water-related project.
Motivation (column 4)
- This may be a physical reason or risk (e.g. declining water quality in a specific basin), or an indirect reason such as changes in consumer behavior (e.g. reduced demand for products containing microbeads).
- Note that there may be multiple motivations for implementing a particular water-related project with a requesting member.
Estimated timeframe for achieving project (column 5)
- If you select “Other, please specify”, provide a label for the estimated timeframe.
Details of project (column 6)
- Use this space to provide details of the water-related project e.g. the regions, facilities, and/or product lines involved. This may include the proposed participants and strategy for achieving the desired outcome described in column 7 (Projected outcome).
Projected Outcome (column 7)
- Outline how both your company and the requesting member could benefit if this project were to be implemented. For example, collaborating to influence stronger local water policy may result in improved water quality in a basin where you operate. This could lead to reduced water treatment costs at a facility where you manufacture products for the requesting member, therefore leading to a lower price per unit and other environmental benefits in the basin.
Additional information
- To identify existing water-related projects for specific locations, you may find it useful to refer to the CEO Water Mandate’s Water Action Hub.
(SW2.2) Have any water projects been implemented due to CDP supply chain member engagement?
Question dependencies
- Your response to SW2.2 will determine if subsequent questions are presented in this section. If your response to SW2.2 is amended, data in those dependent questions may be erased. In this case, be sure to re-enter data for all relevant questions. The guidance for each question indicates if it is a dependent question.
Change from 2019
No change
Rationale
This is an opportunity to demonstrate the kind of projects that you have implemented due to CDP supply chain member(s) engagement and to detail how it has progressed and/or any mutual benefits that have been seen so far.
Response options
Select one of the following options:
(SW2.2a) Please select the CDP supply chain member(s) that have driven collaborative water projects.
Question dependencies
- This question only appears if you select “Yes” in response to SW2.2.
Change from 2019
No change
Rationale
This is an opportunity to demonstrate the kind of projects that you have implemented due to CDP supply chain member(s) engagement and to detail how they have progressed and any mutual benefits that have been seen so far.
Response options
Please complete the following table. You are able to add rows to this table using the “Add Row” button at the bottom of the table.
|
Requesting member
|
Category of project
|
Type of project
|
Description of project
|
Progress
|
|
Select from:
|
Select from:
- New product or service
- Relationship water assessment
- Change to provision of goods and services
- Promote river basin collective action
- Communications
- Other
|
Select from:
- Response drop-down options below table
|
Text field [maximum 5,000 characters
|
Text field [maximum 5,000 characters]
|
[Add Row]
Type of project (column 3)
New product or service
- New product or service that reduces customers' operational water consumption
- New product or service that reduces customers' products/services water consumption
- New product or service that has a lower upstream water impacts
- Other, please specify
- Reduced packaging water impacts
- Other, please specify
Relationship water assessment
- Assessing products' or services' water-related impacts to identify efficiencies
- Water audit of existing relationship
- Aligning goals to feed into customers targets and ambitions
- Other, please specify
Change to provisioning of goods and services
- Reduced water-related impacts
- Other, please specify
|
Promote river basin collective action
- Invite customer to collaborate with other users in their river basins to reduce impact
- Other, please specify
Communications
- Awards – apply for external awards together
- Joint case studies or marketing campaign
- Other, please specify
Other
|
Requested content
General
- Provide information on water-related collaborative projects initiated by requesting CDP supply chain members which prompted your organization to act.
- This is optional. You are not obliged to complete this question if you do not have any proposals.
Requesting member (column 1)
- Select from this column any requesting CDP supply chain member that you identify as a collaborator on a water-related project that led to action.
- If you would like to identify more than one collaborator per project please add an additional row per member.
- Note that only the member you select in column 1 will be able to see the data in that row. If you enter any information without selecting a requesting member here, your answer will not be viewable at all.
Category of project/Type of project (columns 2-3)
- Your selection in column 2 will determine the options shown in column 3.
- If you select “Other, please specify” in column 3, provide a label for the type of project.
Description of project (column 4)
- Use this space to provide details of the project e.g. the regions, facilities, and/or product lines that were involved. Your description may also include the participants and strategy, as well as the rationale for the project (e.g. the issue, and how the initiative reached a solution).
Progress (column 5)
- Detail any progress that has been made on this project and how this progress is measured.
- You may also provide a description of the impact that the project has had, and any future plans you have related to it.
Additional information
- To identify existing water-related projects for specific locations, you may find it useful to refer to the CEO Water Mandate’s Water Action Hub.
Water intensity (SW)
(SW3.1) Provide any available water intensity values for your organization’s products or services.
Change from 2019
Minor change
Rationale
Methodologies for calculating and reporting water intensity are currently becoming more standardized, particularly with the development of ISO 14046. CDP supply chain members are increasingly interested in the water use of their purchased products (goods or services). In particular, they are interested in the water intensity of the goods and services they purchase that are produced in facilities exposed to water risk (where that risk is related to access to water or physical scarcity).
Response Options
Please complete the following table. You are able to add rows to this table using the “Add Row” button at the bottom of the table.
| Product name
|
Water intensity value
|
Numerator: Water aspect
|
Denominator
|
Comment
|
|
Text field [maximum 500 characters]
|
Numerical field [up to 999,999,999,999 using a maximum of four decimal places]
|
Select from:
- Water withdrawn
- Water consumed
- Other, please specify
|
Text field [maximum
100 characters]
|
Text field [maximum 1,000 characters]
|
[Add Row]
Requested content
General
- This question refers to water intensity figures for goods and services produced by your company. You do not have to provide water intensity figures for all your products, but figures for goods or services that you provide to requesting CDP supply chain members should be included here if possible.
- You may wish to prioritize those located in water stressed regions, or those representing the largest proportion of spend.
Product name (column 1)
- A brief description of the product should be provided e.g. “soft drink”, and the product data disclosed should include (though not be limited to) the products of most interest to requesting CDP supply chain members.
Water intensity value (column 2)
- Provide your water intensity value. You must use m3 for the water aspect. For example, water intensity = volume of water consumption in m3 / annual revenue in $.
- Please state this in values of up to 4 decimal places.
Numerator: Water aspect (column 3)
- If you select “Other, please specify”, provide a label for the water aspect.
Denominator (column 4)
- You should provide a label for the denominator used in your calculation of the water intensity value in column 2.
- Denominators vary by organization. For example, mining companies may use “tonne of ore mined”, whereas for chemicals producers “m3 produced” may be more appropriate.
Comment (column 5) (optional)
- Use this field to provide the units of your Numerator: Water aspect given in column 3.
- You can also give contextual information to support your water intensity calculation. This may include explanations of:
- Organizational boundaries e.g. whether it is a company-wide value or an alternative scope. Include your approach to this calculation and its rationale and exclusions; such as how the data is collected/calculated, if there is any weighing in the calculation of the average, etc.
- Relevant exclusions e.g. any exclusions to your selection in column 3 (Numerator: Water aspect), e.g. consideration only of freshwater use, exclusion of rainwater use, and rationale for this.
- You can also provide a rationale for your choice of denominator (column 4) in this column, as well as further describing the product you refer to in column 1.
- Requesting members may find it useful to understand how this data is used within your organization e.g. in setting water efficiency targets, guiding water strategy, or setting remuneration incentives.
Explanation of terms
- Water consumed: The amount of water drawn into the boundaries of the organization (or facility) and not discharged back to the water environment or a third party over the course of the reporting period.
- Water intensity: A metric providing the relationship between a volumetric aspect of water and a unit of production, financial metric or any other unit.
- Water withdrawal: The sum of all water drawn into the boundaries of the organization (or facility) from all sources for any use over the course of the reporting period.
Additional information
Appendix: River basin list — and South African Water Management Areas — by country
Sources: Includes all river basins in the CEO Water Mandate (2016) Interactive Database of the World’s River Basins (developed in partnership with the WRI).
(* denotes overseas dependent territory with a river basin and included in the ISO 3166 Country code list of UN member states).
Note: CDP's on-line country list includes countries/areas without river basins. Disclosing companies operating in these countries may report the aquifers relevant to their disclosure.
| Country
|
Water Area
|
| Afghanistan
|
Amu Darya, Helmand, Indus, Murghab - Hari Rud, Tarim
|
| Albania
|
Danube, Drin, Vijose
|
| Algeria
|
Chelif, Dra, Lake Chad, Medjerda, Niger, Tafna
|
| Andorra
|
Ebro, Garonne
|
| Angola
|
Congo, Cuanza, Cunene, Okavango, Zambezi
|
| Argentina
|
Baker, Biobio, Chubut, Colorado (Argentina), Gallegos-Chico, Huasco, Lake Mar Chiquita, Lake Titicaca, Limari, Negro (Argentina), Palena, Parana, Rapel, Rio Grande, Rio Salado, Salado, Santa Cruz, Uruguay
|
| Armenia
|
Kura - Ozero Sevan
|
| Australia
|
Ashburton River, Blackwood River, Burdekin, Daly, De Grey River, Eyre Lake, Fitzroy, Fitzroy River, Flinders River, Fortescue River, Gascoyne River, Gilbert River, Leichhardt River, Macarthur River, Mitchell River (N. Au), Murchison River, Murray - Darling, Ord, Roper River, South Esk River, Victoria River
|
| Austria
|
Danube, Elbe River, Rhine
|
| Azerbaijan
|
Kura - Ozero Sevan
|
| Bangladesh
|
Ganges - Brahmaputra
|
| Belarus
|
Dniepr, Narva, Neman, Vuoksi - Neva, Western Dvina (Daugava), Wisla
|
| Belgium
|
Meuse, Rhine, Seine
|
| Belize
|
Grisalva
|
| Benin
|
Mono, Niger, Oueme, Volta
|
| Bhutan
|
Ganges - Brahmaputra
|
| Bolivia (Plurinational State of)
|
Amazonas, Lake Titicaca, Loa, Parana
|
| Bosnia and Herzegovina
|
Danube
|
| Botswana
|
Limpopo, Okavango, Orange, Zambezi
|
| Brazil
|
Amazonas, Corantijn, Cuyuni - Essequibo, Jequitinhonha, Lagoon Mirim, Maroni, Mucuri, Negro (Uruguay), Orinoco, Oyapock, Paraiba Do Sul, Parana, Rio Acarau, Rio Araguari, Rio Capim, Rio De Contas, Rio Doce, Rio Gurupi, Rio Itapecuru, Rio Itapicuru, Rio Jacui, Rio Jaguaribe, Rio Mearim, Rio Paraguacu, Rio Paraiba, Rio Parnaiba, Rio Pindare, Rio Prado, Rio Ribeira Do Iguape, Rio Vaza-Barris, Sao Francisco, Tocantins, Uruguay
|
| Bulgaria
|
Danube, Maritsa, Rezvaya, Struma, Vardar, Veleka
|
| Burkina Faso
|
Comoe, Niger, Volta
|
| Burundi
|
Congo, Nile
|
| Cambodia
|
Chao Phraya, Mekong, Saigon
|
| Cameroon
|
Congo, Cross, Lake Chad, Niger, Ntem, Nyong, Ogooue, Sanaga
|
| Canada
|
Albany River, Alsek River, Anderson River, Arnaud, Attawapiskat River, Baleine Grande Riviere De La, Caniapiscau - Aux Melezes, Churchill River,
Churchill Fleuve (Labrador), Columbia River, Connecticut River, Copper River, Coppermine River, Eastmain, Ellice River, Ferguson River, Feuilles (Riviere Aux), Fraser River, George River, Grande Riviere, Grande Riviere De La Baleine, Hayes River (Trib. Arctic Ocean) - Back River, Hayes River (Trib. Hudson Bay), Hornaday River, Horton River, Little Mecatina River, Mackenzie River, Manicouagan (Riviere), Mississippi River, Moose River (Trib. Hudson Bay), Nass River, Natashquan (Riviere), Nelson River, Nottaway, Penobscot River, Quoich River, Rupert River, Saguenay (Riviere), Saint John River, Seal River, Severn River (Trib. Hudson Bay), Skeena River, St.Croix River, St.Lawrence, Stikine River, Taku River, Thelon River, Thlewiaza River, Winisk River, Yukon River
|
| Central African Republic
|
Congo, Lake Chad, Nile, Sanaga
|
| Chad
|
Lake Chad, Niger
|
| Chile
|
Baker, Biobio, Chubut, Colorado (Argentina), Gallegos-Chico, Huasco, Lake Titicaca, Limari, Loa, Negro (Argentina), Palena, Rapel, Rio Grande, Santa Cruz
|
| China
|
Amu Darya, Amur, Balkhash, Dalinghe, Dong Jiang, Fuchun Jiang, Ganges - Brahmaputra, Han Jiang, Hong(Red River), Huang He (Yellow River), Indus, Irrawaddy, Liao He, Luan He, Mekong, Min Jiang, Ob, Salween, Syr Darya, Tarim, Xi Jiang - Bei Jiang, Yalu Jiang, Yangtze River (Chang Jiang), Yongding He
|
| Colombia
|
Amazonas, Atrato, Magdalena, Mira, Orinoco, Patia, San Juan (Columbia - Pacific)
|
| Congo
|
Congo, Kouilou, Nyanga, Ogooue
|
| Costa Rica
|
San Juan
|
| Côte d'Ivoire
|
Bandama, Cavally, Cestos, Comoe, Niger, Sassandra - Davo, St John, Tano, Volta
|
| Croatia
|
Danube
|
| Czechia
|
Danube, Elbe river, Oder river
|
| Democratic People's Republic of Korea
|
Amur, Han-Gang (Han River), Yalu Jiang
|
| Democratic Republic of the Congo
|
Congo, Kouilo, Nile, Zambezi
|
| Denmark
|
Gudena, Skjern A
|
| Djibouti
|
Awash
|
| Ecuador
|
Amazonas, Chira, Daule & Vinces, Esmeraldas, Mira, Patia, Tumbes, Zarumilla
|
| Egypt
|
Dead Sea, Nile
|
| El Salvador
|
Lempa
|
| Equatorial Guinea
|
Ntem, Ogooue
|
| Eritrea
|
Baraka, Nile
|
| Estonia
|
Narva, Western Dvina (Daugava)
|
| Eswatini |
Incomati, Maputo |
| Ethiopia
|
Awash, Lake Turkana, Nile, Shebelle
|
| Finland
|
Iijoki, Kem, Kemijoki, Kokemaenjoki, Kymijoki, Muonio, Oulujoki, Tana (No, Fi), Tuloma, Vuoksi - Neva
|
| France/French Guiana* |
Amazonas*, Ebro, Garonne, Loire, Maroni*, Meuse, Muga, Oyapock*, Po, Rhine, Rhone, Roia, Seine
|
| Gabon
|
Congo, Kouilou, Ntem, Nyanga, Ogooue
|
| Gambia
|
Gambia
|
| Georgia
|
Coruh, Kuban, Kura - Ozero Sevan, Terek
|
| Germany
|
Danube, Elbe River, Meuse, Oder River, Rhine, Weser
|
| Ghana
|
Comoe, Pra, Tano, Volta
|
| Greece
|
Maritsa, Struma, Vardar, Vijose
|
| Guatemala
|
Grisalva, Lempa, Motagua
|
| Guinea
|
Cavally, Cestos, Corubal, Gambia, Geba, Great Scarcies, Little Scarcies, Lofa, Mano-Morro, Moa, Niger, Sassandra - Davo, Senegal, St John, St Paul
|
| Guinea-Bissau
|
Corubal, Geba
|
| Guyana
|
Amazonas, Barima, Corantijn, Cuyuni - Essequibo, Orinoco
|
| Honduras
|
Coco, Lempa, Motagua, Patacua, Ulua
|
| Hungary
|
Danube
|
| Iceland
|
Joekulsa A Fjoellum, Lagarfljot, Oelfusa, Svarta, Skagafiroi, Thjorsa
|
| India
|
Brahmani River (Bhahmani), Cauvery River, Damodar River, Ganges - Brahmaputra, Godavari, Indus, Irrawaddy, Kaladan, Krishna, Mahanadi River (Mahahadi), Mahi River, Narmada, Penner River, Tapti River
|
| Indonesia
|
Batang Hari, Batang Kuantan, Brantas, Eilanden, Fly, Lorentz, Mamberamo, Rajang, Sembakung, Sepik, Solo (Bengawan Solo), Sungai Kajan, Sungai Kapuas, Sungai Mahakam, Uwimbu
|
| Iran (Islamic Republic of)
|
Atrek, Daryacheh-Ye Orumieh, Dasht, Helmand, Kura - Ozero Sevan, Murghab - Hari Rud, Tigris & Euphrates, Van Golu
|
| Iraq
|
Daryacheh-Ye Orumieh, Dead Sea, Tigris & Euphrates
|
| Ireland
|
Bann, Fane, Foyle
|
| Israel
|
Dead Sea
|
| Italy
|
Danube, Po, Rhine, Rhone, Roia
|
| Japan
|
Gono (Go), Ishikari, Kiso, Kitakami, Mogami, Shinano, Chikuma, Tenryu, Tone, Yodo
|
| Jordan
|
Dead Sea, Tigris & Euphrates
|
| Kazakhstan
|
Amu Darya, Aral Drainage, Balkhash, Issyk-Kul, Ob, Syr Darya, Tarim, Ural, Volga
|
| Kenya
|
Galana, Lake Natron, Lake Turkana, Nile, Pangani, Shebelle, Tana
|
| Kuwait
|
Tigris & Euphrates
|
| Kyrgyzstan
|
Amu Darya, Balkhash, Issyk-Kul, Syr Darya, Tarim
|
| Lao People's Democratic Republic
|
Ca, Chao Phraya, Hong (Red River), Ma, Mekong, Tranh (Nr Thu Bon)
|
| Latvia
|
Narva, Neman, Western Dvina (Daugava)
|
| Lebanon
|
Asi (Orontes), Dead Sea
|
| Lesotho
|
Orange, Tugela
|
| Liberia
|
Cavally, Cestos, Lofa, Mano-Morro, Moa, St John, St Paul
|
| Libya
|
Lake Chad
|
| Liechtenstein
|
Rhine
|
| Lithuania
|
Neman, Western Dvina (Daugava)
|
| Luxembourg
|
Meuse, Rhine
|
| Madagascar
|
Betisboka, Mangoky, Tsiribihina
|
| Malawi
|
Congo, Rovuma, Zambezi
|
| Malaysia
|
Kelantan, Kinabatangan, Pahang, Perak, Rajang, Sembakung, Sungai Kajan, Sungai Kapuas, Sungai Mahakam
|
| Mali
|
Bandama, Comoe, Niger, Senegal, Volta
|
| Mauritania
|
Niger, Senegal
|
| Mexico
|
Armeria, Balsas, Bravo, Colorado River (Pacific Ocean), Conception, Fuerte, Grisalva, Panuco, Papaloapan, San Pedro, Santiago, Verde, Yaqui
|
| Mongolia
|
Amur, Lake Ubsa, Ob, Yenisei
|
| Montenegro
|
Danube, Drin
|
| Morocco
|
Dra, Sebou, Tafna
|
| Mozambique
|
Buzi, Incomati, Limpopo, Lurio, Maputo, Messalo, Rovuma, Save, Zambezi
|
| Myanmar
|
Chao Phraya, Ganges - Brahmaputra, Irrawaddy, Kaladan, Mae Klong, Mekong, Salween, Sittang River
|
| Namibia
|
Cunene, Okavango, Orange, Zambezi
|
| Nepal
|
Ganges - Brahmaputra, Indus
|
| Netherlands
|
Meuse, Rhine
|
| New Zealand
|
Clutha, Waikato River
|
| Nicaragua
|
Coco, Grande De Matagalpa, Patacua, San Juan
|
| Niger
|
Lake Chad, Niger
|
| Nigeria
|
Cross, Lake Chad, Niger, Oueme, Sanaga
|
| North Macedonia |
Danube, Drin, Struma, Vardar |
| Norway
|
Angerman, Dalalven, Dramselv, Gloma, Kemijoki, Lule, Muonio, Tana (No, Fi), Vaenern-Goeta
|
| Pakistan
|
Amu Darya, Dasht, Helmand, Indus, Tarim
|
| Panama
|
Atrato
|
| Papua New Guinea
|
Fly, Mamberamo, Purari, Sepik, Uwimbu
|
| Paraguay
|
Parana
|
| Peru
|
Amazonas, Canete, Chira, Lake Titicaca, Majes, Ocona, Santa, Tumbes, Zarumilla
|
| Poland
|
Danube, Dniestr, Elbe River, Neman, Oder River, Wisla
|
| Portugal
|
Douro, Guadiana, Lima, Mino, Tejo
|
| Republic of Korea
|
Han-Gang (Han River), Naktong
|
| Republic of Moldova | Danube, Dniestr |
| Romania
|
Danube
|
| Russian Federation
|
Alazeya, Amur, Anabar, Anadyr, Dniepr, Don, Indigirka, Kamchatka, Kem, Kemijoki, Khatanga, Kolyma, Kovda, Kuban, Kura - Ozero Sevan, Lake Taymur, Lake Ubsa, Lena, Mezen, Nadym, Narva, Neman, Nizhny Vyg (Soroka), Northern Dvina (Severnaya Dvina), Ob, Olenek, Omoloy, Onega, Oulujoki, Palyavaam, Pechora, Ponoy, Popigay, Pur, Pyasina, Taz, Terek, Tuloma, Ural, Varzuga, Volga, Vuoksi - Neva, Western Dvina (Daugava), Yana, Yenisei
|
| Rwanda
|
Congo, Nile
|
| Saudi Arabia
|
Dead Sea, Tigris & Euphrates
|
| Senegal
|
Gambia, Geba, Senegal
|
| Serbia
|
Danube, Drin, Struma, Vardar
|
| Sierra Leone
|
Great Scarcies, Little Scarcies, Mano-Morro, Moa, Niger
|
| Slovakia
|
Danube, Oder River, Wisla
|
| Slovenia
|
Danube
|
| Somalia
|
Shebelle
|
| South Africa
|
Doring, Gamka, Groot, Groot-Kei, Groot-Vis, Incomati, Limpopo, Maputo, Orange, Tugela, Olifants, Inkomati-Usuthu, Pongola-Uzimkulu, Vaal, Mzimvubu-Tsitsikamma, Breede-Gouritz, Berg-Olifants
|
| South Sudan
|
Congo, Lake Turkana
|
| Spain
|
Douro, Ebro, Garonne, Guadalquivir, Guadiana, Lima, Mino, Muga, Tejo
|
| Sudan
|
Baraka, Congo, Lake Chad, Nile
|
| Suriname
|
Amazonas, Coppename, Corantijn, Maroni, Suriname
|
| Sweden
|
Angerman, Dalalven, Gloma, Kalixaelven, Lake Vattern, Lule, Muonio, Vaenern-Goeta
|
| Switzerland
|
Danube, Po, Rhine, Rhone
|
| Syrian Arab Republic
|
Asi (Orontes), Dead Sea, Tigris & Euphrates
|
| Tajikistan
|
Amu Darya, Syr Darya, Tarim
|
| Thailand
|
Chao Phraya, Kelantan, Mae Klong, Mekong, Perak, Salween
|
| Togo
|
Mono, Oueme, Volta
|
| Tunisia
|
Medjerda
|
| Turkey
|
Asi (Orontes), Coruh, Daryacheh-Ye Orumieh, Kel Kit, Kizilirmak, Kura - Ozero Sevan, Maritsa, Rezvaya, Sakarya, Tigris & Euphrates, Van Golu, Veleka
|
| Turkmenistan
|
Amu Darya, Atrek, Murghab - Hari Rud
|
| Uganda
|
Congo, Lake Turkana, Nile
|
| Ukraine
|
Danube, Dniepr, Dniestr, Don, Southern Bug, Wisla
|
| United Kingdom of Great Britain And Northern Ireland
|
Bann, Fane, Foyle, Spey, Thames, Trent, Tweed
|
| United Republic of Tanzania | Congo, Galana, Lake Natron, Nile, Pangani, Rovuma, Rufiji, Ruvu, Zambezi |
| United States of America
|
Alabama River & Tombigbee, Alsek River, Altamaha River, Apalachicola River, Bravo, Brazos River, Cape Fear River, Colorado River (Caribbean Sea), Colorado River (Pacific Ocean), Columbia River, Colville River, Conception, Connecticut River, Copper River, Delaware River, Eel River (Calif.), Fraser River, Great Salt Lake, Hudson River, James River, Klamath River, Kobuk River, Kuskokwim River, Merrimack River, Mississippi River, Nelson River, Noatak River, Nueces River, Nushagak River, Pearl River, Pee Dee River, Penobscot River, Potomac River, Roanoke River, Rogue River, Sabine River, Sacramento River - San Joaquin River, Saint John River, Salinas, San Antonio River, Santee River, Savannah River, St. Croix River, St. Johns River, St. Lawrence, Stikine River, Susitna River, Susquehanna River, Suwannee River, Taku River, Trinity River (Texas), Yaqui, Yukon River
|
| Uruguay
|
Lagoon Mirim, Negro (Uruguay), Uruguay
|
| Uzbekistan
|
Amu Darya, Aral Drainage, Issyk-Kul, Syr Darya
|
| Venezuela (Bolivarian Republic of)
|
Amazonas, Barima, Cuyuni - Essequibo, Magdalena, Orinoco
|
| Viet Nam
|
Ca, Chao Phraya, Hong(Red River), Ma, Mekong, Saigon, Tranh (Nr Thu Bon), Xi Jiang - Bei Jiang
|
| Zambia
|
Congo, Zambezi
|
| Zimbabwe
|
Buzi, Limpopo, Okavango, Save, Zambezi
|
Glossary - Water
- Area with water stress: There is no universally accepted methodology for classifying an area as water stressed, nor for identifying whether facilities are located in a water stressed area. CDP’s reporting guidance for W1.2d suggests some publicly available and credible tools for identifying water stressed areas based on physical scarcity. As good practice, a water stressed area should be at the catchment level as a minimum.
- Baseline water stress: The ratio of total annual water withdrawals to total available annual renewable supply.
- Board: The board, or board of directors, refers to a body of elected or appointed members who jointly oversee the activities of a company or organization. Some countries use a two-tiered system where “board” refers to the “supervisory board” while “key executives” refers to the “management board” (adapted from the Recommendations of the Task Force for Climate-related Financial Disclosures).
- Boundaries of your organization: For CDP disclosure this is a management boundary, rather than a physical boundary or a legal entity. Water is considered to have crossed the boundary of your organization, at either the corporate or site level, when your organization in any way uses it, comes into contact with it, is required to manage it or when it becomes incorporated into your products. It therefore includes any water use and management by your organization outside of its physical corporate fence.
- Company: Throughout this information request, “your company” refers collectively to all the companies, businesses, organizations, other entities or groups that fall within you’re the definition of your reporting boundary. It is used interchangeably with "your organization".
- C-suite: A term used to collectively refer to the most senior executive team.
- Direct operations: An organization’s operations include anything it does itself for the purpose of producing goods and services and maintaining the functionality of the business. This covers any internal supply chains between the organization’s business units. For example, a business unit within a company that supplies components to another business unit within the company would be considered part of the organization’s direct operations.
- Direct water use: includes all water that is used for activities within your organization (as defined by your ‘reporting boundary’).
- Downstream (value chain): Part of the value chain, beyond direct operations, where finished materials, products and services flow from the organization to users/customers/consumers via distributors/retailers etc.
- Employee incentives: Payments, benefits or concessions additional to the employee’s usual benefits that depend on the achievement of a performance goal.
- Entrained water (Metals & mining sector only): In the metals & mining sector entrained water refers to the volumes of water in the raw material.
- Facility: “Facilities” may be used throughout this questionnaire as a broad term and not restricted to a particular site or grouping of fixed buildings and factories. For example, if your organization is in the extractive industries you might normally collate business information for assets or business units, and so you may wish to define ‘facility’ information in this way.
- Facility boundary: This is a management boundary, rather than a physical boundary or a legal entity. Water is considered to have crossed the boundary of your facility when your organization in any way uses it, comes into contact with it, is required to manage it or when it becomes incorporated into your products. It therefore includes any water use and management by your organization outside of the physical fence of a facility; for example, to provide a street cleaning service or when used in fields that are remote from a processing plant.
- Facility reference number: The facility reference number is used to track information related to a facility that is disclosed in different questions. The number is not specific to an organization, but simply avoids an organization having to repeat contextual information such as river basin and facility name.
- Financial planning: Refers to an organization’s consideration of how it will achieve and fund its objectives and strategic goals. The process of financial planning allows organizations to assess future financial positions and determine how resources can be utilized in pursuit of short- and long-term objectives. Organizations often create “financial plans” that outline the specific actions, assets, and resources (including capital) necessary to achieve its objectives over a 1-5 year period. However, ‘financial planning’ ‘is broader as it includes long-term capital allocation and other considerations that may extend beyond the 5 year period (e.g., investment, research and development, manufacturing, and markets) (adapted from the Recommendations of the Task Force for Climate-related Financial Disclosures).
- Fresh surface water, including rainwater, water from wetlands, rivers and lakes: Water that is naturally occurring water on the Earth's surface in ice sheets, ice caps, glaciers, icebergs, bogs, ponds, lakes, rivers and streams, and has a low concentration of dissolved solids.
For the purposes of reporting water accounting data to CDP, this surface water source includes water of a quality generally acceptable for, or requiring minimal treatment to be acceptable for, domestic, municipal or agricultural uses (at least <10,000 mg/l TDS, though a range of additional quality properties may also be considered). ‘High quality’ fresh water sources considered acceptable for potable use are typically characterized as having concentrations of dissolved solids less than 1,000 mg/l.
- Freshwater: The generally accepted definition of high quality freshwater is water with concentration of dissolved solids equal to or below 1,000 mg/l TDS (World Health Organization, Guidelines for Drinking-water Quality, 2017). For the purposes of CDP’s questionnaire, ‘freshwater’ is used to refer to a broader category that includes water of a standard generally acceptable for, or requiring minimal treatment to be acceptable for, domestic, municipal or agricultural uses (at least <10,000 mg/l TDS, though a range of additional quality properties may also be considered).
- Goal: A long term qualitative outcome or a specific change in behavior or circumstances.
- Good quality freshwater: Any water used for your organization’s activities that must be of a quality requiring only minimal treatment to be acceptable for domestic, municipal or agricultural uses or safe for freshwater ecosystems. A company is considered dependent on this if it is not possible to use a lower quality water instead. Water quality can refer to physical, chemical, biological, and organoleptic properties of water. ‘High quality’ fresh water sources, of potable standard, are typically characterized as having concentrations of dissolved solids less than 1,000 mg/l.
- Governance: A system whereby an organization is influenced and controlled based on the interests of shareholders and stakeholders. This involves relationships and communication between management, the board, the shareholders and stakeholders. Governance provides a framework for an organization to set objectives, monitor performance, and evaluate results (adapted from the Recommendations of the Task Force for Climate-related Financial Disclosures).
- Groundwater (non-renewable): Water which is being held in, and can be recovered from, an underground formation. Non-renewable groundwater has a negligible rate of natural recharge on the human time-scale (more than 50 years), and is generally located at deeper depths than renewable groundwater. This is sometimes referred to as “fossil” water.
- Groundwater (renewable): Water which is being held in, and can be recovered from, an underground formation. Renewable groundwater sources can be replenished within 50 years and are usually located at shallow depths.
- Impact driver: The factor/ driving force causing the impact being reported. Impact drivers are typically physical (e.g. weather extreme events), regulatory, reputational and markets related, or technological.
- Indirect water use: includes all water use that takes place anywhere within your value chain outside your direct operations and direct control. This includes water use upstream of your direct operations, use such as by your suppliers, and downstream, for example water needed for the use of your products.
- Inherent risk: The risk that exists in the absence of controls, i.e. not taking into account any potential mitigation or management measures that could be implemented.
- Internal water price: A metric reflecting the economic value of water to an organization in monetary terms - beyond the market price paid to water utilities or other direct costs of supply. This value may account for internal and/or external costs associated with water use as well as benefits to the company derived from water (e.g. regulatory costs, water-related capital expenditure, river basin water scarcity impacts, services provided by water ecosystems, social benefits, link to share price). This may be current and/or forward looking, and reflect various levels of time-scales, uncertainty, and geographies. An internal water price may be used in strategic, operational or financial planning.
- Measurement: The collection of quantified data for a water aspect - either as a single volume/quality figure or an aggregation of volumes/ quality figures.
- Monitoring: This is the tracking of measurements over time, i.e. a trend or indication of change in measured figures.
- Onboarding: The process used to support and facilitate working with a new supplier.
- Organization: This refers collectively to all the companies, businesses, other entities or groups that fall within the definition of the reporting boundary. This term is used interchangeably with “company”, as CDP recognizes that some disclosing organizations may not consider themselves to be, or be formally classified, as “companies”.
- Other stages of the value chain: Refers to the activities or partners, either upstream or downstream of direct operations, that provide value to or receive value from an organization's products and services; for example, in the supply chain, during product use and activities by franchisees. See also 'Value chain (beyond direct operations)'.
- Physical risk: Risk driven by water stress or scarcity (too little water), flooding (too much water) or pollution (lower water quality).
- Potential water pollutants: Physical (including thermal), biological, or chemical agents (organic, inorganic substances or heavy metals) that have the direct or indirect potential to negatively modify/contaminate water bodies and/or water ecosystems or affect human health.
- Produced water: Water which enters the organization’s boundary as a result of the extraction, processing, or use of any raw material, so that it must be managed by the organization.
- Recycled/reused water: Water and wastewater (treated or untreated) that has been used more than once before being discharged from the organization’s boundary, so that water demand is reduced. This may be in the same process (recycled), or used in a different process within the same facility or another of the organization’s facilities (reused).
- Regulatory risk: Risks driven by an expected or unexpected change or uncertainty, in law or regulation that may have direct or indirect impacts on a company.
- Reporting boundary: This determines which organizational entities, such as groups, businesses and companies, are included in or excluded from your disclosure. These may be included according to your financial control, operational control, equity share, or another measure.
- Reputational risk: Risk driven by litigation, product risks due to changes in consumer behavior, and risks that may impact decisions made by investors, consumers and current/potential employees concerning a company.
- Requesting CDP supply chain member: Companies working with CDP’s supply chain program to manage climate change impacts, deforestation risks, and/or water security in their supply chain. If you are responding to CDP because of a request from your customer(s), you will need to answer the relevant (SC, SF, and/or SW) Supply chain module in addition to the main questionnaire.
- Residual risk: The risk remaining after a specific action has been taken to manage the risk.
- Revenue: Income arising in the course of an entity's ordinary activities (less discounts, allowances and returns) - before deducting costs for the goods/services sold and operating expenses to arrive at profit (based on the International Financial Reporting Standard).
- Risk driver: The factor/ driving force that could cause the potential impact. Risk drivers are typically physical (e.g. weather extreme events), regulatory, reputational and markets related, or technological.
- Safely managed WASH services: The universal provision of safely managed water, sanitation, and hygiene services has dedicated targets within the Sustainable Development Goals (SDG 6.1 and 6.2). As a minimum, this disclosure refers to a company’s tracking of its provision of drinking water for all workers, available when needed and from sources compliant with faecal and chemical standards, as well as sanitation facilities where excreta are safely disposed in situ or transported and treated offsite.
- Scenario analysis: A strategic planning process/tool to help an organization understand how it might perform in a range of probable, possible or preferred futures.
- Strategy: A plan of action to achieve your organization's long-term objectives/anticipated future state.
- Substantive impact: An impact that has a considerable or relatively significant effect on an organization at the corporate level. This could include operational, financial or strategic effects that undermine the entire business or part of a business.
- Sustainable development goals (SDGs): The UN Sustainable Development Goals are a set of 17 goals for 2030 that look to balance the three dimensions of sustainable development: the economic, social and environmental.
- Target: A specific measurable output to be achieved within a specific timeline. Targets often act as steps towards a wider and long-term corporate goal.
- Technological risk: Risk driven by technological improvements or innovations; for example, those that support water security or the transition to a lower-carbon, energy-efficient economic system.
- Total water use: The sum of water used for all activities in direct operations in the reporting year. This volume can be calculated as the sum of water drawn into the organization’s boundary (water withdrawals put into storage should be subtracted where this is more than 5% of withdrawals), plus water taken from storage for use prior to discharge, plus water that is recycled/reused within your operations.
- Upstream (value chain) Part of the value chain, beyond direct operations, where the materials used as inputs for manufactured products are produced, extracted, processed, and/or traded.
- Value chain (beyond direct operations): The sequence of activities or partners, either upstream or downstream of direct operations, that provide value to or receive value from an organization’s products and services; for example, suppliers, product users and franchisees.
- Value chain partner: A value chain partner includes any organization/individual that provides or receives value from the organisation’s products and services, up or downstream of its direct activities; for example, a customer, a franchisee or contractor the company engages with on water stewardship strategies.
- Value chain: The entire sequence of activities or partners that provide value to or receive value from an organization’s products and services, either within, upstream or downstream of direct operations.
- Verification (external): Procedure carried out by an independent third party for checking that a product, process, service or system meets the requirements specified by a recognized and relevant standard.
- Water availability: The natural runoff (through groundwater and rivers) minus the flow of water that is required to sustain freshwater and estuarine ecosystems and the human livelihoods and well-being that depend on these ecosystems. Water availability typically varies within the year and also from year to year. Water availability might be reduced by decreases in both the water quantity and quality of water resources (adapted from the CEO Water Mandate's "Corporate Water Disclosure Guidelines").
- Water balance: an account of the volumes of water flowing into and leaving an organization across its boundary. When the two volumes are equal, the net water balance will be zero.
- Water consumption: The amount of water that is drawn into the boundaries of the organization and not discharged back to the water environment or a third party over the course of the reporting year.
- Water depletion: A metric based on the percentage of consumptive use to renewable available water in a water shed.
- Water discharge: The sum of effluents and other water leaving the boundaries of the organization and released to surface water, groundwater, or third parties over the course of the reporting period (adapted from GRI Standard 306-1, 2016).
- Water intensity A metric providing the relationship between a volumetric aspect of water and a unit of production, financial metric or any other unit.
- Water policy: A statement of an organization’s water-related commitments, and the actions that will achieve them, that applies to all its activities.
- Water scarcity: Refers to the volumetric lack of freshwater resources. It is a human-driven concept; it is a function of the volume of human water consumption relative to the volume of water resources in a given area. A region with very little water, but no human water consumption would not be considered “scarce,” but rather “arid.” (adapted from the CEO Water Mandate's "Understanding Key Water Stewardship Terms").
- Water valuation: Method for arriving at a water price or any other type of metric associated with the value of water to the organization.
- Water withdrawal: The sum of all water drawn into the boundaries of the organization from all sources for any use over the course of the reporting period.
- Water-related impact: The effects on an organization of a physical, regulatory, reputational or technological challenge, event or action related directly or indirectly to water. Note that the CEO Water Mandate’s Corporate Water Disclosure Guidelines, and the GRI standards, generally refer to “impacts” as the effects of the business on ecosystems and communities.
- Water-related opportunity: Refers to the potential positive impact on an organization resulting from improved water security or an action to progress it, e.g. cost savings, access to new markets, supply chain resilience.
- Water-related outcomes (scenario analysis): Scenario analysis enables decision makers to identify and evaluate potential outcomes for different scenarios and their effects on their organization, based on a variety of assumptions/input variables. The consequences may be water-related themselves, or have implications for the water management and governance of the organization, or for its wider business strategy.
Terms for responding to Investors (2020 Water Security)
These terms apply if you are submitting a response to the CDP Water Security Questionnaire 2020 to Investors. If you are also submitting a response to Supply Chain Members the Terms for responding to Supply Chain Members (2020 Water Security), below, will also apply.
1.DEFINITIONS
Billing Company: means the organization determined in accordance with the table at the end of these terms.
CDP: means CDP Worldwide, a charitable company registered with the Charity Commission of England and Wales (registered charity no. 1122330 and a company number 05013650). References to “we”, “our” and “us” in these terms are references to CDP and the Billing Company.
Deadline: means 26 August 2020.
Fee: means the fee set out in the table at the end of these terms, which is exclusive of any applicable taxes.
Full Version: means the version of the Questionnaire which contains all questions that are applicable to you.
Minimum Version: means the version of the Questionnaire which contains a subset of the questions included in the Full Version.
Personal Data: means data which relates to an individual who can be identified from the data, such as a person’s name and job title.
Questionnaire: means the Full Version and the Minimum Version of the CDP Water Security Questionnaire 2020.
Responding Company: means the company responding to the Questionnaire. References to “you” and “your” in these terms are references to the Responding Company.
2.PARTIES
The parties to these terms shall be CDP, the Billing Company (where the Billing Company is not CDP) and the Responding Company.
3.THESE TERMS
These are the terms that apply when you submit a response to our Questionnaire to Investors. If you do not agree to these terms, please contact us at [email protected] to discuss them with us.
4.RESPONDING TO OUR QUESTIONNAIRE
General. When responding to our Questionnaire, you will be given a choice as to whether your response can be made public or whether your response is non-public. We strongly encourage you to make your response public.
Deadline for responding. You must submit your response to us using our online response system by the Deadline for your response to be eligible for scoring. If you submit your response after the Deadline but on or before 30 September 2020 (the date our online response system will close in 2020) it will not be scored and may not be included in any report, data product or other analysis.
Public responses. If you agree that your response can be made public, we may use and make it available for all purposes that we decide (whether for a fee or otherwise), including, for example, making your responses available on our website, to our investor signatories and other third parties and scoring your response.
Non-public responses. If your response is non-public, we may use it only as follows:
(a) make it available as soon as it is received by CDP to our investor signatories from time to time (as listed on our website) either directly or through Bloomberg terminals, for any use within their organizations but not for publication unless any data from your response has been anonymized or aggregated in such manner that it has the effect of being anonymized;
(b) make it available as soon as it is received by CDP to our group companies, companies we license to operate using the CDP name and brand (for example, CDP North America, Inc and CDP Europe AISBL), our country partners, research partners, report writers and scoring partners (each from time to time):
(i) to score your response; and
(ii) for any other use within their organizations but not for publication unless any data from your response has been anonymized or aggregated in such manner that it has the effect of being anonymized.
Sharing responses with the CEO Water Mandate. If, by ticking ‘Yes’ in response to question W10.2 of the Questionnaire, you agree to us sharing your response to questions W2.1a (response to impacts), W4.2 and W4.2a (response to risks) with the CEO Water Mandate for publication of suitable projects on its Water Action Hub website, you agree that we may also share the e-mail address of the person within your company registered in our online response system as the 'Main User' with the CEO Water Mandate. This is so that the Hub administrator can alert your company that its data includes a project of potential interest to other parties sharing water resources in the geographies in which you operate. The Hub will publish the project and the associated contact details after providing your company with secure log-in information which enables amendments to the project profile and contact details.
Amending your response. You may amend a response you have submitted before the Deadline (26 August 2020). To do so you must notify us that you wish to amend your response by 20 August 2020 and you must resubmit it by the Deadline for your response to be eligible for scoring. From 21 August 2020, amendments to submitted responses can only be made by our staff and at our discretion and we may charge a fee for making them. Most such amendments to your response will be made from 2 November 2020 at the earliest. Please note that the final date for requesting an amendment is 30 November 2020 and any changes you request to your submitted response from 21 August 2020 may not be reflected in any score, report, data product or other analysis or use of your response. Please email [email protected] for more information about amending your response.
Scoring of responses to the Full Version (of the Questionnaire). If you submit your response to the Full Version in English using our online response system by the Deadline your response will be scored.
Please contact your local CDP office for information about scoring if you intend to submit your response in a language other than English.
Scoring of responses to the Minimum Version (of the Questionnaire). Responses to the Minimum Version will only be scored in certain circumstances. Please contact your local CDP office for further information.
Publication and use of scores. If you are responding to a CDP Water Security Questionnaire for the first time you may choose for your score to be “private” but in all other cases CDP may publish your score, and use and make it available for all purposes that we decide (whether for a fee or otherwise), regardless of whether your response is public or non-public. If you choose for your score to be “private”, unless you achieve an A grade in which case we may make your score public, we may only make it available to our group companies, companies we license to operate using the CDP name and brand, our country partners, research partners, report writers and scoring partners (each from time to time), in each case for any use within their organizations but not for publication. Note that if you also submit your response to Supply Chain Members it will also be available to any Supply Chain Member that has asked you to respond to the Questionnaire. For further details please see the Terms for responding to Supply Chain Members (2020 Water Security).
5.FEE
Fee. We are a not-for-profit organization and charge certain companies an annual administrative fee to enable us to maintain the disclosure system. Unless you are exempt from paying the Fee, as set out below, if you are listed, incorporated or headquartered in a country/region that is listed in the next paragraph, you are required to pay the Fee plus any applicable taxes. The Fee is payable once regardless of how many responses (climate change, forests and water security) you submit in 2020. Please note that we may charge an additional fee if you want to amend your response after the Deadline or if you submit your response after the Deadline and you would like it to be scored.
Countries/regions where the Fee applies. A Responding Company will be required to pay the Fee if it is listed, incorporated or headquartered in any one of the following countries/regions:
Algeria, Argentina, Australia, Austria, Bahamas, Bahrain, Belarus, Belgium, Bermuda, Brazil, Canada, Cayman Islands, Channel Islands, Chile, Colombia, Denmark, Egypt, Finland, France, Gabon, Germany, Hong Kong, Iceland, India, Indonesia, Iran (Republic of), Ireland, Israel, Italy, Japan, Kazakhstan, Kenya, Kuwait, Luxembourg, Malaysia, Mexico, Mongolia, Netherlands, New Zealand, Nigeria, Norway, Oman, Pakistan, Peru, Philippines, Portugal, Qatar, Russian Federation, Saudi Arabia, Singapore, South Africa, South Korea, Spain, Sweden, Switzerland, Taiwan, Thailand, Turkey, United Arab Emirates, the UK or the USA.
Exemptions from the Fee. A Responding Company is exempt from paying the Fee if:
(a) it falls within one of CDP’s investor samples and it has not submitted a response to CDP in the last three years; or
(b) it is responding only to CDP’s supply chain request.
Please note we will decide in our absolute discretion as to whether the Fee is payable or not and we will notify you before you submit your response. A full list of companies in our investor samples is available on our website.
Payment of the Fee. You must pay the Fee by credit or debit card or request an invoice via CDP’s online corporate dashboard, which must be paid within such time as set out in the invoice. Please note that you will not be able to submit your response unless you have paid the Fee, you have requested an invoice or you are exempt from paying the Fee.
6.RIGHTS IN THE RESPONSES
Ownership. All intellectual property rights in your response will be owned by you or your licensors.
License. You grant to us, or shall procure for us, a perpetual, irrevocable, non-exclusive, assignable, sub-licensable, royalty-free and global license to use your response and any copyright and data base rights in your response for the uses set out in these terms.
7.IMPORTANT REPRESENTATIONS
You confirm that:
(a) the person submitting the response to us is authorized by you to submit the response;
(b) you have obtained all necessary consents and permissions to submit the response to us; and
(c) the response that you submit:
(i) does not infringe the rights of any third party (including privacy, publicity or intellectual property rights);
(ii) does not defame any third party; and
(iii) does not include any Personal Data.
8.LIABILITY
We do not exclude or limit in any way our liability to you where it would be unlawful to do so. This includes liability for death or personal injury caused by our negligence or the negligence of our employees, agents or subcontractors; for fraud or fraudulent misrepresentation.
We are not liable for business losses. Subject to these terms, CDP and the Billing Company have no liability to you in any circumstances for any loss of revenue, loss of profit, loss of business, business interruption, loss of business opportunity, loss of goodwill, loss of reputation, loss of, damage to or corruption of data or software or any indirect or consequential loss or damage.
Exclusion of liability. Subject to these terms, CDP and the Billing Company have no liability to you in any circumstances arising from the content or submission of your response to us, our use of your response or your score and/or the use of your response or your score by any third parties.
Limitation of liability. Subject to these terms, CDP and the Billing Company’s total liability to you in all circumstances shall be limited to an amount equivalent to the Fee or to £785 if you are not required to pay the Fee.
9.GENERAL
We may transfer our rights to someone else. We may transfer our rights and obligations under these terms to another organization.
Nobody else has any rights under these terms. These terms are between you and us. No other person shall have any rights to enforce any of its terms.
Entire agreement. These terms constitute the entire agreement between you and us unless you also choose to share your response with supply chain members, in which case you will also be subject to our Terms for responding to Supply Chain Members (2020 Water Security).
Variation. CDP (acting on its own behalf and the Billing Company’s behalf, if applicable) reserves the right to change these terms at any time. Such changes shall be effective immediately or such other time as CDP elects. In the event of any materially adverse changes, you may request to withdraw your response within 30 days of us notifying you of the change.
If a court finds part of these terms illegal, the rest will continue in force. Each of the paragraphs of these terms operates separately. If any court or relevant authority decides that any of them are unlawful, the remaining paragraphs will remain in full force and effect.
Governing law and jurisdiction. These terms are governed by English law and you and us both agree to the exclusive jurisdiction of the English courts to resolve any dispute or claim arising out of or in connection with these terms or their subject matter or formation.
Language. If these terms are translated into any language other than English, the English language version will prevail.
10.AMOUNT OF FEE
| Location of Responding Company
|
Fee (exclusive of any applicable taxes)
|
|
Brazil
|
BRL 4,000
|
|
India
|
INR 67,000
|
|
Japan
|
JPY 97,500
|
|
UK
|
GBP 785
|
|
Europe (excluding UK)
|
EUR 925
|
|
Rest of the world
|
USD 975
|
11.BILLING COMPANY
| Billing Company | Location of Responding Company |
|---|
CDP Worldwide
| Algeria, Australia, Bahamas, Bahrain, Belarus, Bermuda, Cayman Islands, Channel Islands, Egypt, Gabon, Hong Kong, Indonesia, Iran (Republic of), Ireland, Israel, Kazakhstan, Kenya, Kuwait, Malaysia, Mongolia, New Zealand, Nigeria, Oman, Pakistan, Philippines, Qatar, Russian Federation, Saudi Arabia, Singapore, South Africa, South Korea, Taiwan, Thailand, Turkey, United Arab Emirates, United Kingdom
|
CDP Worldwide (Europe) gGmbH
| Austria, Belgium, Denmark, Finland, France, Germany, Iceland, Italy, Luxembourg, Netherlands, Norway, Portugal, Spain, Sweden, Switzerland
|
CDP North America, Inc
| Canada, USA
|
Carbon Disclosure Project (Latin America)
| Argentina, Brazil, Chile, Colombia, Mexico, Peru
|
Carbon Disclosure Project India
| India
|
一般社団法人
CDP Worldwide-Japan
| Japan
|
If the Responding Company is located in a territory that is not listed in the table above, the Billing Company shall be CDP Worldwide.
Terms for responding to Supply Chain Members (2020 Water Security)
These terms apply if you are submitting a response to the CDP Water Security Questionnaire 2020 to Supply Chain Members. If you are also submitting a response to Investors the Terms for responding to Investors (2020 Water Security), above, will also apply.
1.DEFINITIONS
CDP: means CDP Worldwide, a charitable company registered with the Charity Commission of England and Wales (registered charity no. 1122330 and a company number 05013650). References to “we”, “our” and “us” in these terms are references to CDP.
Deadline: means 26 August 2020.
Full Version: means the version of the Questionnaire which contains all questions that are applicable to you.
Minimum Version: means the version of the Questionnaire which contains a subset of the questions included in the Full Version.
Personal Data: means data which relates to an individual who can be identified by such data, such as a person’s name and job title.
Questionnaire: means the Full Version and the Minimum Version CDP Water Security Questionnaire 2020.
Responding Company: means the company responding to the Questionnaire. References to “you” and “your” in these terms are references to the Responding Company.
Supply Chain Member: means an organization that is requesting data from its suppliers.
2.PARTIES
The parties to these terms shall be CDP and the Responding Company.
3.THESE TERMS
These are the terms that apply when you submit a response to our Questionnaire to Supply Chain Members. If you do not agree to these terms, please contact us at [email protected] to discuss them with us.
4.RESPONDING TO OUR QUESTIONNAIRE
General. When responding to our Questionnaire, you will be given a choice as to whether your response can be made public or whether your response is non-public. We strongly encourage you to make your response public, but in either case, we will not divulge the relationship between you and any Supply Chain Member that has asked you to respond other than to our group companies, companies we license to operate using the CDP name and brand (for example, CDP North America, Inc and CDP Europe AISBL), our country partners, research partners, report writers and scoring partners (each from time to time), all of which are obliged to keep such relationship confidential.
Deadline for responding. You must submit your response to us using our online response system by the Deadline for your response to be eligible for scoring. If you submit your response after the Deadline but on or before 30 September 2020 (the date our online response system will close in 2020) it will not be scored and may not be included in any report, data product or other analysis.
Public responses. If you agree that your response can be made public, we may use and make it available for all purposes that we decide (whether for a fee or otherwise), including, for example, making your response available on our website, to our investor signatories and other third parties and scoring your response. Note that information you submit within the Supply Chain module (2020 Water Security) will be treated as non-public (see below for details).
Non-public responses. If your response is non-public, we may use it only as follows:
(a) make it available as soon as it is received by CDP to any Supply Chain Member that has asked you to respond to the Questionnaire for any use within their organization but not for publication unless any data from your response has been anonymized or aggregated in such manner that it has the effect of being anonymized;
(b) make it available as soon as it is received by CDP to our group companies, companies we license to operate using the CDP name and brand, our country partners, research partners, report writers and scoring partners (each from time to time):
(i) to score your response; and
(ii) for any other use within their organizations but not for publication unless any data from your response has been anonymized or aggregated in such manner that it has the effect of being anonymized.
Supply Chain module (2020 Water Security). Information you submit in response to the Supply Chain module (2020 Water Security) (questions SW0, SW1, SW2, and SW3 of the Questionnaire) will be treated as non-public even if you choose to make your response public. Questions SW1.1, SW2.1, and SW2.2a ask you to select a Supply Chain Member using a drop-down menu in our online response system, and only the Supply Chain Member you select for each row will have access to the information in it. For all other questions in the Supply Chain module (2020 Water Security) the information you submit will be accessible to any Supply Chain Member that has asked you to respond to the Questionnaire. All information you submit in the Supply Chain module (2020 Water Security) will be accessible to CDP and to our group companies, companies we license to use the CDP name and brand, our country partners, research partners, report writers and scoring partners (each from time to time), all of which are obliged to keep such information confidential.
Sharing responses with the CEO Water Mandate. If, by ticking ‘Yes’ in response to question W10.2 of the Questionnaire, you agree to us sharing your response to questions W2.1a (response to impacts), W4.2 and W4.2a (response to risks) with the CEO Water Mandate for publication of suitable projects on its Water Action Hub website, you agree that we may also share the e-mail address of your registered CDP user with the CEO Water Mandate. This is so that the Hub administrator can alert your company that its data includes a project of potential interest to other parties sharing water resources in the geographies in which you operate. The Hub will publish the project and the associated contact details after providing your company with secure log-in information which enables amendments to the project profile and contact details.
Amending your response. You may amend a response you have submitted before the Deadline (26 August 2020). To do so you must notify us that you wish to amend your response by 20 August 2020 and you must resubmit it by the Deadline for your response to be eligible for scoring. From 21 August 2020, amendments to submitted responses can only be made by our staff and at our discretion and we may charge a fee for making them. Most such amendments to your response will be made from 2 November 2020 at the earliest. Please note that the final date for requesting an amendment is 30 November 2020 and any changes you request to your submitted response from 21 August 2020 may not be reflected in any score, report, data product or other analysis or use of your response. Please email [email protected] for more information about amending your response.
Scoring of responses to the Full Version (of the Questionnaire). If you submit your response to the Full Version in English using our online response system by the Deadline your response will be scored.
Please contact your local CDP office for information about scoring if you intend to submit your response in a language other than English.
Scoring of responses to the Minimum Version (of the Questionnaire). Responses to the Minimum Version will only be scored in certain circumstances. Please contact your local CDP office for further information.
Publication of scores. Unless you achieve an A grade, in which case we may make your score public, we may only make your score available to any Supply Chain Member that has asked you to respond to the Questionnaire, our group companies, companies we license to operate using the CDP name and brand, our country partners, research partners, report writers and scoring partners (each from time to time), in each case for any use within their organizations but not for publication.
5.RIGHTS IN THE RESPONSES
Ownership. All intellectual property rights in your response will be owned by you or your licensors.
License. You grant to us, or shall procure for us, a perpetual, irrevocable, non-exclusive, assignable, sub-licensable, royalty-free and global license to use your response and any copyright and data base rights in your response for the uses set out in these terms.
6.IMPORTANT REPRESENTATIONS
You confirm that:
(a) the person submitting the response to us is authorized by you to submit the response;
(b) you have obtained all necessary consents and permissions to submit the response to us; and
(c) the response that you submit:
(i) does not infringe the rights of any third party (including privacy, publicity or intellectual property rights);
(ii) does not defame any third party; and
(iii) does not include any Personal Data.
7.LIABILITY
We do not exclude or limit in any way our liability to you where it would be unlawful to do so. This includes liability for death or personal injury caused by our negligence or the negligence of our employees, agents or subcontractors; for fraud or fraudulent misrepresentation.
We are not liable for business losses. Subject to these terms, CDP has no liability to you in any circumstances for any loss of revenue, loss of profit, loss of business, business interruption, loss of business opportunity, loss of goodwill, loss of reputation, loss of, damage to or corruption of data or software or any indirect or consequential loss or damage.
Exclusion of liability. Subject to these terms, CDP has no liability to you in any circumstances arising from the content or submission of your response to us, our use of your response and/or the use of your response by any third parties.
Limitation of liability. Subject to these terms, CDP’s total liability to you in all circumstances shall be limited to £785.
8.GENERAL
We may transfer our rights to someone else. We may transfer our rights and obligations under these terms to another organization.
Nobody else has any rights under these terms. These terms are between you and us. No other person shall have any rights to enforce any of its terms.
Entire agreement. These terms constitute the entire agreement between you and us, unless you also choose to share your response with investors in which case you will also be subject to our Terms for responding to Investors (2020 Water Security).
Variation. CDP reserves the right to change these terms at any time. Such changes shall be effective immediately or such other time as CDP elects. In the event of any materially adverse changes, you may request to withdraw your response within 30 days of us notifying you of the change.
If a court finds part of these terms illegal, the rest will continue in force. Each of the paragraphs of these terms operates separately. If any court or relevant authority decides that any of them are unlawful, the remaining paragraphs will remain in full force and effect.
Governing law and jurisdiction. These terms are governed by English law and you and us both agree to the exclusive jurisdiction of the English courts to resolve any dispute or claim arising out of or in connection with these terms or their subject matter or formation.
Language. If these terms are translated into any language other than English, the English language version will prevail.
About CDP
CDP is an international non-profit that drives companies and governments to reduce their greenhouse gas emissions, safeguard water resources and protect forests.
Voted number one climate research provider by investors and working with institutional investors with assets of US$96 trillion, we leverage investor and buyer power to motivate companies to disclose and manage their environmental impacts.
Please visit www.cdp.net or follow us @CDP to find out more.
What is the legal status of CDP?
CDP Worldwide (CDP) is a UK Registered Charity no. 1122330 and a company limited by guarantee registered in England no. 05013650. The charity has wholly owned subsidiaries in Germany and China and companies in Australia, Brazil and India over which it exercises control through majority Board representation. In the US, CDP North America, Inc. is an independently incorporated affiliate which has United States IRS 501(c)(3) charitable status.
© 2020 CDP Worldwide
Supported by