CDP States and Regions 2021 Reporting Guidance
Guidance introduction
The aim of this online guidance is to assist all states and regions completing the CDP States and Regions 2021 Questionnaire. The online guidance provides a high-level overview of each questionnaire section as well as further information and guidance on each question. This online guidance also provides examples of good responses for selected questions.
States and Regions are asked to respond to the questionnaire using CDP's disclosure platform. The disclosure platform consists of the States and Regions Dashboard and the Online Response System (ORS).
Please note, you must submit your response in the ORS, CDP cannot accept responses provided in other formats (i.e. PDF or Word documents).
At the start of the disclosure year CDP will send an invitation email to nominated contacts associated to your region with relevant information and an activation link to access the dashboard and ORS.
Should you need any further support with answering the questions or using CDP’s platform, please contact CDP by e-mail on [email protected] or by phone on +44 (0) 203 818 3908. Office hours are 09:00 – 17:30 GMT/BST, Monday to Friday.
Our work with subnational governments
CDP believes that subnational governments play a vital role in driving climate action and delivering sustainable economies. To limit global warming to 2 degrees, it is imperative that states and regions set ambitious climate targets and drive global standards of climate leadership. CDP provides a global platform for subnational governments to measure, manage and disclose their environmental impacts. CDP's States and Regions program aims to use annual reporting to promote transparency and increase climate action, ambition and accountability of these governments. The program works with over 120 states and regions from 35 countries, representing US $17 trillion - 20% of the global economy, with a combined population of 669 million people.
The 2021 questionnaire is composed of a series of sections to capture a holistic understanding of subnational environmental action. Each section asks questions about an aspect of your region including: greenhouse gas (GHG) emissions, risks and opportunities from climate change, strategies for mitigating emissions, and strategies for adapting to changes in the climate.
The information generated from this questionnaire will assist in improving the understanding of state and regional GHG emissions. It provides a framework for the development/enhancement of GHG inventories ensuring that emissions are reported in a meaningful way. It can highlight potential risks and opportunities arising from climate change, promote consideration of adaptation and resilience building activities and facilitate target setting. Through our disclosure platform, data and tools, we will support state and regional government reduce emissions, avoid deforestation, deliver water security and build resilience to climate change.
Encouraging state and regional governments to disclose their environmental information through CDP’s States and Regions Questionnaire provides the foundation to achieve this mission.
Acknowledgements
CDP would like to thank its partners on the States and Regions program for their assistance in the development of this online guidance:
The Climate Group
For their support on providing definitions, additional information and best practices on the following topics:
- Region-wide emissions inventory
- Emissions reduction targets
- Energy efficiency targets
- Renewable energy/electricity targets
- Climate actions
Regions4
For reviewing the guidance information and providing feedback on the following topics:
- Climate change risks and adaptation actions
- Socio-economic risks
- Water supply risks
States and regions initiatives
The data collected from this information request is used for analysis and research by CDP and its partners, and supports the following initiatives:
RegionsAdapt
Regions4 is a global network that represents solely regional governments (states, regions, and provinces) before UN processes, European Union initiatives and global discussions in the field of sustainable development. Through advocacy, cooperation, and capacity building, Regions4 empowers regional governments to accelerate global action to halt biodiversity loss, raise ambition towards climate change adaptation and achieve the sustainable development goals and the 2030 Agenda.
The RegionsAdapt initiative, launched at COP21 in Paris, is the first global initiative that supports the acceleration of climate adaptation by subnational governments. With over 70 signatory regions, the RegionsAdapt aims to inspire and support regional governments to take concrete action, collaborate and report on climate adaptation. By joining the initiative, regions commit to report on the progress of their adaptation actions and goals on an annual basis. Regions4 is the network that supports the initiative through its Secretariat and by involving members from the five continents.
For more information, please visit www.regions4.org #RegionsAdapt #RegionsVoice
- States and regions that have joined the RegionsAdapt initiative are required to answer the Introduction, Governance, Risks and Adaptation as well as Water modules of the 2021 questionnaire.
New York Declaration on Forests
CDP is one of the Assessment Partners for the New York Declaration on Forests (NYDF), which is a voluntary and non-binding international declaration to take action to halt global deforestation. NYDF aims to cut natural forest loss in half by 2020 and strive to end it by 2030. There are over 200 endorsers (including national governments, sub-national governments, multi-national companies, indigenous communities and non-government organizations), which committed to doing their part to achieve the NYDF’s ten goals and follow its accompanying action agenda.
The questionnaire's Forest module will collect data to showcase how states and regions are addressing deforestation and forest degradation impacts resulting from non-agricultural drivers, including mining.
For further information on the NYDF Progress Assessment visit: https://forestdeclaration.org/about/about-assessme...
- States and regions from the following countries will be requested to answer the Forest module of the 2021 questionnaire.
1. Introduction
Pathway diagram
This diagram shows the questions contained in this section. To access question-level guidance, use the menu on the left to navigate to the question.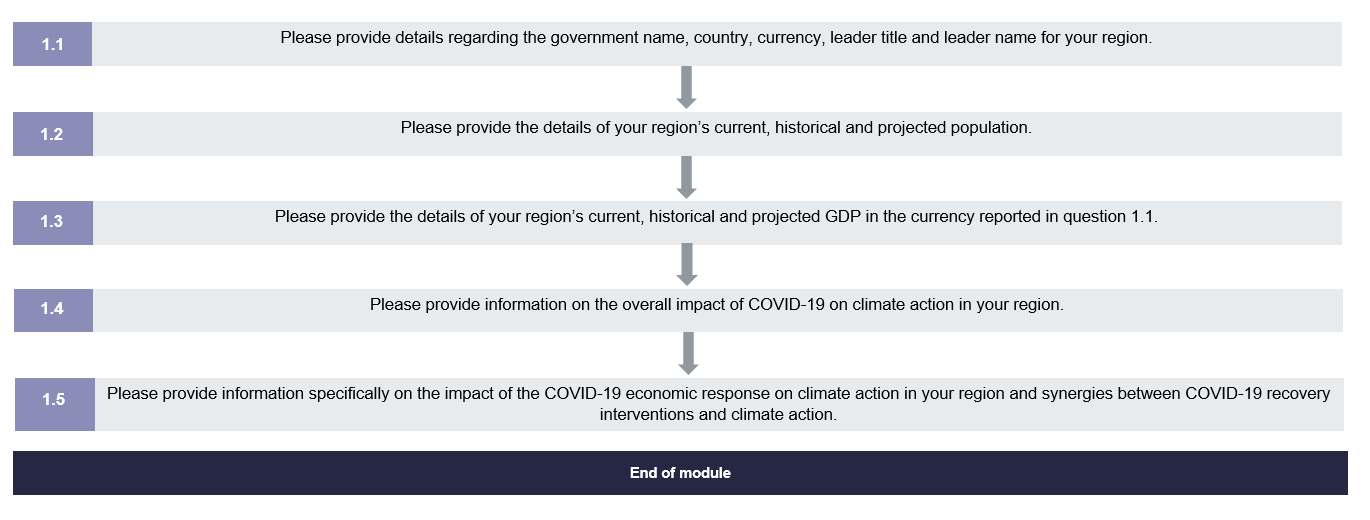
General information
1.1 Please provide the following details for your region.
Change from 2020
No change
Response Options
Please complete the following table:
| Profile | Details |
|---|---|
|
Government name |
Text field |
|
Country |
Text field |
|
Currency |
Select from Appendix A |
|
Leader title (e.g. Governor, Premier…) |
Text field |
|
Leader name |
Text field |
Guidance
This is a table question, which asks for details for your region’s general profile. The table has the following fields:
- Government name: Please state the name of your region’s government.
- Country: Please state the country where the region is located.
- Currency: Appendix A provides a list of currencies. The currency selected for your region would be used for the reported GDP (see question 1.3) and for any projects that may require financing (see question 2.7).
- Leader title: Please state the official title of your region’s leader (e.g. Governor, Premier).
- Leader name: Please state the full name of your region’s leader.
1.2 Please provide the details of your region’s current, historical and projected population.
Change from 2020
No change
Response Options
Please complete the following table:
| Region's current population | Region's current population year (2011-2021) | Region's population in year 2010 | Region's medium-term projected population |
|---|---|---|---|
|
Numerical field |
Select from: 2011-2021 |
Numerical field |
Numerical field |
| Region's medium-term projected population year (20212-2030) | Region's long-term projected population | Region's long-term projected population year (2031-2050) | Comments |
|---|---|---|---|
| Select from: 2022-2030 | Numerical field | Select from: 2031-2050 | Text field |
Guidance
This is a table question, which asks about your region’s current population size, its historical population (in year 2010) and how it is forecast to change in the future. Please ensure that the population figure is entered in a full format i.e. if your regions population is 1.87 million then you will enter 1870000. This question assists CDP in understanding the demographic changes that have occurred in a region in the past and what the projections are for the region towards 2050. Should you not have this information available, please provide a comment on this in the comments text field. The table has the following fields:
- Region’s current population: Please state your region’s population size as a number.
- Region’s current population year (2011 - 2020): Please state the year for which the population figure was determined in numerical form.
- Region’s population in year 2010: Please state your region’s population size in 2010 as a number.
- Region's medium-term projected population: Please state your region's medium-term projected population as a number.
- Region’s medium-term projected population year (2021-2030): Please state the year of your region’s medium-term projected population.
- Region's long-term projected population: Please state your region's long-term projected population as a number.
- Region’s long-term projected population year (2031-2050): Please state the year of your region’s long-term projected population.
- Comments: Please provide any comments you have about your region’s population in this field.
1.3 Please provide the details of your region’s current, historical and projected total GDP in the currency reported in question 1.1.
Change from 2020
No change
Response Options
Please complete the following table:
| Region's current GDP | Region's current GDP year (2011-2021) | Region's GDP in year 2010 | Region's medium-term projected GDP |
|---|---|---|---|
|
Numerical field |
Select from: 2011-2021 |
Numerical field |
Numerical field |
| Region's medium-term projected GDP year (2022-2030) | Region's long-term projected GDP | Region's long-term projected GDP year (2031-2050) | Comments |
|---|---|---|---|
Select from: 2022-2030 | Numerical field | Select from: 2031-2050 | Text field |
Guidance
This question assists CDP in understanding the economic changes that have occurred in a region in the past and what the projections are for the region towards 2050. It is preferred that you report your regions real GDP, however if you are reporting nominal GDP then please state this in the comments text field. Should you not have GDP information available, please provide a comment on this in the comments text field. The table has the following fields:
- Region’s current GDP: Provide the most current value available of your region’s gross domestic product in your native currency, or the currency used for calculation.
- Region’s current GDP year (2011-2020): Please select the year for which the GDP value you are reporting was calculated.
- Region’s GDP in year 2010: Please state your region’s GDP in 2010.
- Region's medium-term projected GDP: Please state your region's medium-term projected GDP.
- Region’s medium-term projected GDP year (2021-2030): Please select the year of your region’s medium-term projected GDP.
- Region's long-term projected GDP: Please state your region's long-term projected GDP.
- Region’s long-term projected GDP year (2031-2050): Please select the year of your region’s long-term projected GDP.
- Comments: Please provide any comments you have about your region’s GDP in this field, this field can include information on what the primary sectors of your region's economy are. It is preferred that you report your regions real GDP, however if you are reporting nominal GDP then please state this here.
Explanation of Terms
Gross Domestic Product (GDP): Gross Domestic Product (GDP) at market prices is the expenditure on final goods and services minus imports: final consumption expenditures, gross capital formation, and exports less imports. "Gross" signifies that no deduction has been made for the depreciation of machinery, buildings, and other capital products used in production. "Domestic" means it is production by the resident institutional units of the country. The products refer to final goods and services, that is, those that are purchased, imputed, or otherwise, as: final consumption of households, non-profit institutions serving households and government; fixed assets; and exports (minus imports). For more information see the definitions developed by the OECD.
1.4 Please provide information on the overall impact of COVID-19 on climate action in your region.
Change from 2020
New question
Response Options
Please complete the following table:
| Impact of COVID-19 on climate action in your region | Comment |
|---|---|
|
Select from:
|
Text field |
1.5 Please provide information specifically on the impact of the COVID-19 economic response on climate action in your region and synergies between COVID-19 recovery interventions and climate action.
Change from 2020
New question
Response Options
Please complete the following table:
| Impact of COVID-19 economic response on city’s budget for financing climate action in your region | COVID-19 recovery interventions and climate action synergies | Explanation |
|---|---|---|
|
Select from:
|
Select all that apply:
|
Text field |
2. Governance
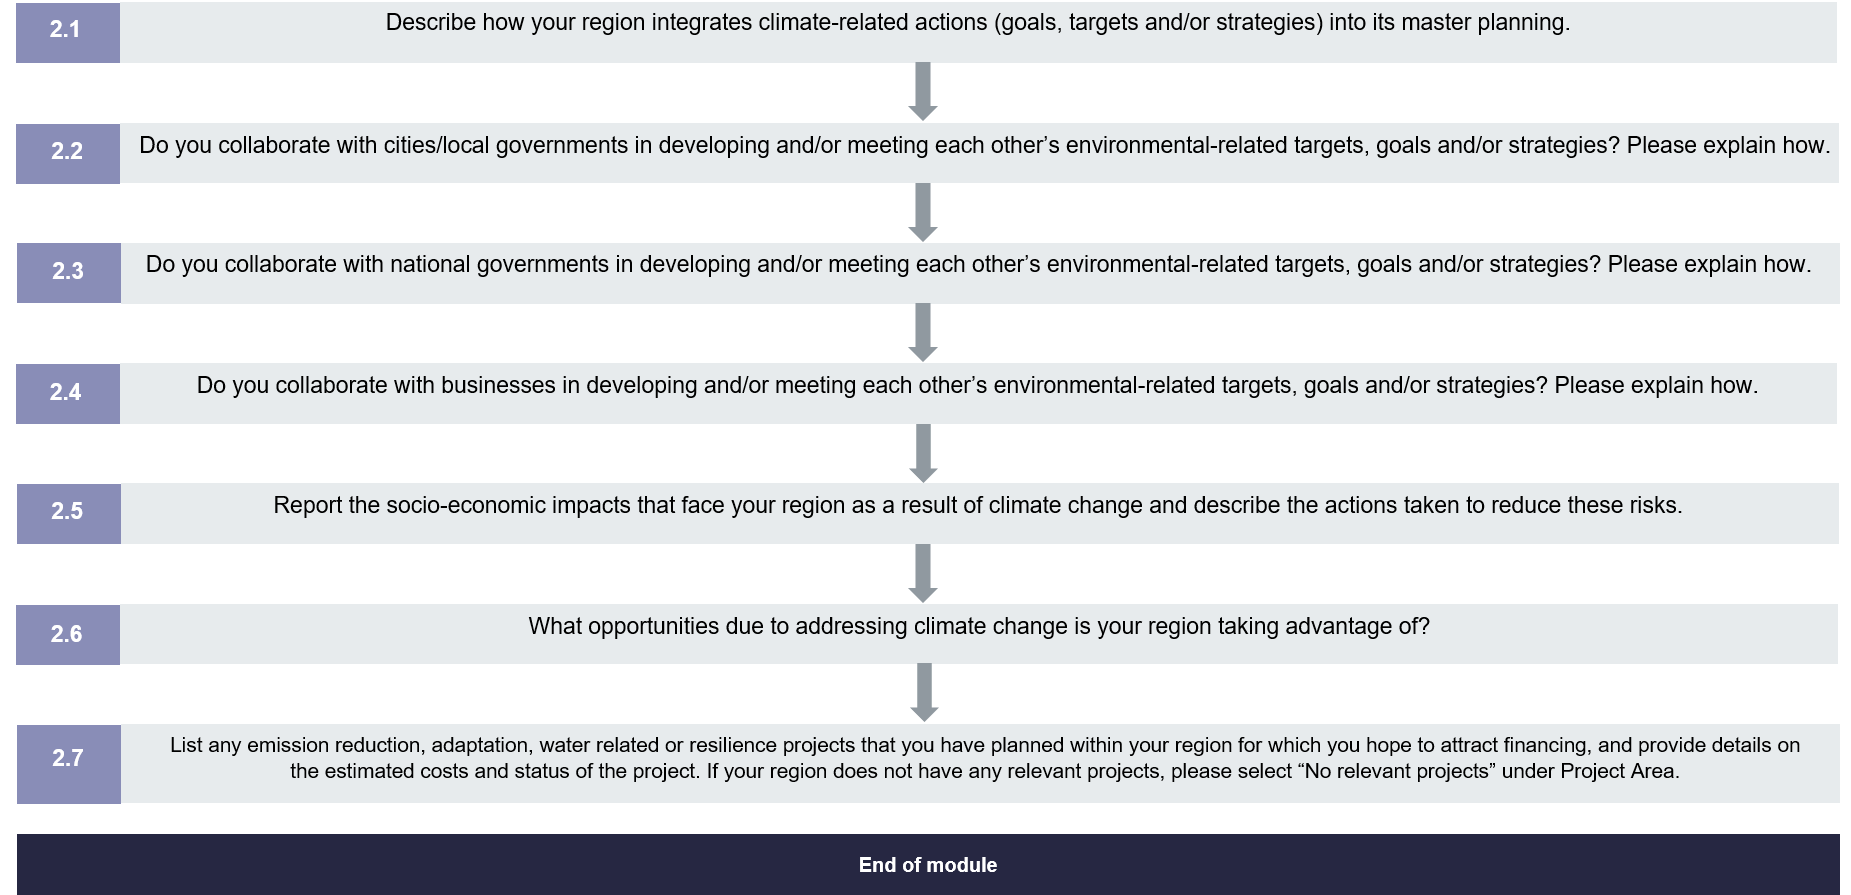
Pathway diagram
This diagram shows the questions contained in this section. To access question-level guidance, use the menu on the left to navigate to the question.
Regional planning
2.1 Describe how your region integrates climate-related actions (goals, targets and/or strategies) into its master planning.
Change from 2020
No change
Response Options
Please complete the following table. You are able to add rows by using the "Add Row" button at the bottom of the table.
| Climate-related actions are integrated in master planning | Sectors that integrate climate-related actions |
Actions integrated | Please explain |
|---|---|---|---|
|
Select from:
|
Select all that apply:
|
Select all that apply:
|
Text field |
[Add Row]
Guidance
This question aims to identify whether your region is considering climate adaptation and mitigation measures in your regions master planning. Mainstreaming climate change - ensuring that it is reflected in and integrated into broader sectoral policy making, is an important process to ensure an all of government approach to climate action.
This is a table question with the following fields:
- Climate-related actions are integrated in master planning: Please select the relevant level of integration of climate-related actions in your regions master planning.
- Sectors that integrate climate-related actions: You will only be presented this column if you select "Yes" in column 1. Please select the relevant sectors where climate-related actions are integrated into your regions master planning. If you want to report a different sector from the options provided, please select ‘Other, please specify’ and specify the type of sector.
- Actions integrated: You will only be presented this column if you select "Yes" in column 1. Please select all the relevant climate-related actions integrated in your master plan. If you want to report a different policy from the options provided, please select "Other, please specify" and specify the type of action.
- Please explain: If applicable please provide a brief description of how climate-related actions are integrated into your regions master planning process. If you select either "No, but we intend to do so within the next two years" or "No, and we have no plans to do so in the next two years" please provide a brief description of how you will or why you are not integrating climate-related actions in your regions master planning. If relevant, details offered could include the following: department, committee responsible for climate change-related activities; information on frequency of actions or disclosing; next steps for governance and planned future changes; governance challenges encountered; and stakeholder engagement processes.
Explanation of Terms
Mainstreaming: Mainstreaming generally means ensuring that a particular issue is constantly taken into account, reflected in and integrated into broader decision making processes and activities, essentially with the result that this issue becomes broadly accepted and is viewed as a normal aspect impacting processes and activities (The Climate Policy Info Hub).
2.2 Do you collaborate with cities/local governments in developing and/or meeting each other’s environmental-related targets, goals and/or strategies? Please explain how.
Change from 2020
No change
Response Options
Please complete the following table. You are able to add rows by using the “Add Row” button at the bottom of the table.
| Collaborate with local governments | Action area | Type of collaboration | Please explain |
|---|---|---|---|
|
Select from:
|
Select from:
| Select all that apply:
|
Text field |
[Add Row]
Guidance
This is a table question with the following fields:
- Collaborate with local governments: If your region is jointly working with city-level governments on developing and/or meeting each other’s environmental-related targets, goals and/or strategies, please select “Yes”. If you are not working with city-level governments, please select the most applicable “No” option.
- Action area: Please select the relevant type of action. If you want to report a different action from the options provided, please select “Other, please specify” and specify the type of action.
- Type of collaboration: There are several collaborative actions that regions can take with cities and local governments to support the achievement of their environmental-related actions. Select the type of actions that your region is taking from the list provided and explain in the next field how these collaborative actions are supporting the relevant action selected.
- Please explain: Please briefly explain how your region is working with city-level governments on the relevant action selected. You can explain here how your region's climate-related targets, policies and legislation are integrated with local/city climate-related targets, policies, and legislation. You can also describe your region's approach to cooperation with cities/local governments, outlining key lessons learned and best practice.
This question allows you to report on multiple actions by adding an additional row.
Case Study
Basque Country’s multilevel governance for climate action
The Basque Country is a great example of how a subnational government can lead sustainable development and support low carbon and resilient climate actions locally, while also engaging and profiling its action at European and international level. The Basque Country has been able to support, through long-term cooperation, its own local governments to commit and reach ambitious targets, and to implement sustainable plans, while showcasing internationally how regional commitments can impact global climate action. The Basque Government works closely and supports the Basque network of Municipalities for Sustainability (Udalsarea21), which supports directly municipalities in the territory, setting up a very successful example of multi-level partnership and effective institutional coordination. Udalsarea21 coordinates the Basque Country Local Sustainability Observatory, and to monitor effectively the implementation of the over 25,000 actions at local level, has developed the MUGI21 application. In addition, this application provides municipalities with the opportunity to extract data and gain a better overview of their local process and the effectiveness of their Local Action Plan.
Reference: European Union and the Committee of the Regions (2017), An overview of regions and cities with-in the global climate change process - a perspective for the future. Available at: https://cor.europa.eu/en/engage/studies/Documents/overview-LRA-global-climate-change-process.pdf
2.3 Do you collaborate with national governments in developing and/or meeting each other’s environmental-related targets, goals and/or strategies? Please explain how.
Change from 2020
No change
Response Options
Please complete the following table. You are able to add rows by using the “Add Row” button at the bottom of the table.
| Collaborate with national governments | Action area | Type of collaboration | Please explain |
|---|---|---|---|
|
Select from:
|
Select from:
| Select all that apply:
|
Text field |
[Add Row]
Guidance
The aim of this question is to identify examples of multilevel governance of climate actions focusing on national and subnational government levels. National governments often depend on subnational governments to deliver climate action through directly implementing policies. Subnational governments can strengthen and reinforce national policies to help reach higher ambitions, for example, through addressing market failures not dealt with by national policy or increasing policy stringency in subnational delivery; subnational governments are often best placed to identify local needs and benefits and to exploit synergies across investment priorities through mobilizing local resources and coordinating between individuals, institutions and sectors that are crucial to mitigation action (Reference: Low Emissions Development Strategies (LEDS) Global Partnership Working Group on Sub-national Integration). The role of regional governments in meeting national climate targets is further emphasized by the Paris Agreement, which illustrated the importance of ‘non-Party stakeholders’ (which includes states and regions) in securing the Agreement’s objectives to keep the global temperature increase well below 2 degrees Celsius above pre-industrial levels, and to pursue efforts to limit the temperature increase to 1.5 degrees Celsius (Reference: United Nations Framework Convention on Climate Change, Paris Agreement, December 2015).
This is a table question with the following fields:
- Collaborate with national governments: If your region is jointly working with national-level governments on developing and/or meeting each other’s environmental-related targets, goals and/or strategies, please select “Yes”. If you are not working with city-level governments, please select the most applicable “No” option.
- Action area: Please select the relevant type of action. If you want to report a different action from the options provided, please select 'Other, please specify' and specify the type of action.
- Type of collaboration: There are several collaborative actions that regions can take with national governments to support the achievement of their environmental-related actions. Select the type of actions that your region is taking from the list provided and explain in the next field how these collaborative actions are supporting the relevant action selected.
- Please explain: Please briefly explain how your region is working with national-level governments on the relevant action selected. You can explain here how your region's environmental-related targets, policies and legislation are integrated with national climate-related targets, policies, and legislation. You can also describe your region's approach to cooperation with national governments, outlining key lessons learned and best practice.
This question allows you to report on multiple actions by adding an additional row.
Additional Information
The Paris Climate Package and the reference to subnational governments
The Paris Climate Package includes both the Paris Agreement and the COP21 decisions on implementation, and it explicitly recognizes and engages local and sub-national governments in climate action. Paragraph 15 of the preamble of the Paris Agreement recognizes the importance of the engagements of all levels of government and various actors. Paragraph 15 of the preamble of the COP21 Decision that supports the Paris Agreement also agrees to uphold and promote regional and international cooperation in order to mobilize stronger and more ambitious climate action by all Parties and non-Party stakeholders, including civil society, the private sector, financial institutions, cities and other sub-national authorities, local communities and indigenous peoples.
The COP21 Decision further envisages active engagement of Non-Party Stakeholders as appropriate, including through the technical examination processes on mitigation and adaptation and high-level events of the COP Presidencies. National governments have also recognized cities and regions in their Nationally Determined Contributions (NDCs), approximately half of which encourage and foresee action at the local and sub-national levels. This figure is promising for the role of cities and regions as nations work toward achieving their climate commitments.
2.4 Do you collaborate with businesses in your region in developing and/or meeting your regions environmental-related targets, goals and/or strategies? Please explain how.
Change from 2020
No change
Response Options
Please complete the following table. You are able to add rows by using the “Add Row” button at the bottom of the table.
| Collaborate with businesses | Action area | Business sectors | Type of collaboration | Please explain |
|---|---|---|---|---|
|
Select from:
|
Select from:
|
Select all that apply:
|
Select all that apply:
|
Text field |
[Add Row]
Guidance
Please note, you are only requested to report the most significant collaborative actions with businesses that contribute towards meeting your regions environmental-related targets, goals and/or strategies. This is a table question with the following fields:
- Collaborate with businesses: If your region is jointly working with businesses on developing and/or meeting each other’s environmental-related targets, goals and/or strategies, please select “Yes”. If you are not working with businesses, please select the most applicable “No” option.
- Action area: Please select the relevant type of action. If you want to report a different action from the options provided, please select “Other, please specify” and specify the type of action.
- Type of collaboration: There are several collaborative actions that regions can take with businesses to support the achievement of their environmental-related targets and/or goals. Select the type of actions that your region is taking from the list provided and explain in the next field how these collaborative actions are supporting the relevant action selected.
- Please explain: Please briefly explain how your region is working with businesses on the relevant action selected. You can explain here how your region's environmental-related targets, policies and legislation are integrated with local/city environmental-related targets, policies, and legislation. You can also describe your region's approach to cooperation with cities/local governments, outlining key lessons learned and best practice.
This question allows you to report on multiple goals, targets and/or strategies by adding an additional row.
Socio-economic risks and opportunities
2.5 Report the socio-economic impacts that your region faces as a result of climate-related risks and describe the actions taken to manage these risks.
Change from 2020
No change
Response Options
Please complete the following table. You are able to add rows by using the “Add Row” button at the bottom of the table.
| Impact | Anticipated timescale | Estimated magnitude of impact | Estimated probability of impact | Impact description | Actions taken to manage risk |
|---|---|---|---|---|---|
|
Select from:
|
Select from:
|
Select from:
| Select from:
|
Text field |
Text field |
[Add Row]
Guidance
The first field describes a number of possible social risks of climate change, which can be selected from the drop-down menu. Additional entries can be made in the question, using the "Add row" button at the base of the question. This table has the following fields:
- Impacts: Please select the impacts for your region from the options provided. Please select “Other, please specify” if you want to provide a different socio-economic risk not covered in the drop-down list and specify this risk in the text field provided.
- Anticipated timescale: Please choose the timescale by which you expect to experience social risks arising from climate change. The field offers four choices for timescale:
Current - If your region is already experiencing the identified effect from climate change.
Short term - if you anticipate your region will experience the identified effect from climate change by 2025.
Medium term - If you anticipate your region will experience the identified effect from climate change between 2026 and 2050.
Long term - If you anticipate your region will experience the identified effect from climate change after 2051.
- Estimated magnitude of impact: CDP asks regions to assess their level of risk by estimating the potential impact along with the likelihood of that effect occurring. The categories of risk are general and all that is necessary is an estimate. Four options are available to describe the seriousness of the climate change impact selected:
Extremely serious - If you anticipate that the expected effect of climate change poses the highest level of potential concern to your region. For example, you might choose this option if you expect large storms to have a significant impact on your region within a short time period.
Serious - If you anticipate that the expected effect of climate change poses a significant level of concern to your region. For example, you might choose this option if you expect large storms to have a significant impact on your region within a medium time frame.
Less serious - If you anticipate that the expected effect of climate change will have a lower impact within a longer timescale.
Other, please specify - Please specify the level of risk associated with the socio-economic risk selected.
- Estimated probability of impact: CDP asks regions to assess their likelihood of risk by estimating the probability of that effect occurring. The categories of probability are general and all that is necessary is an estimate.
- Impact description: You may wish to describe the effect experienced / anticipated, the level of risk, anticipated timescale and sectors affected. Please use this field to provide any additional information about any socio-economic risk you selected.
- Action taken to manage risk: Please include information on the actions/measures you are taking to manage the impact of these socio-economic risks.
Example Response
| Impact | Anticipated timescale | Estimated magnitude of impact | Estimated probability of impact | Impact description | Action taken to manage risk |
|---|---|---|---|---|---|
|
Increased risk to already vulnerable populations |
Medium term |
Serious | High |
With longer heat events, at-risk populations that have limited access to cooling centers or do not have air-conditioning units within their place of residence are more susceptible to facing heat-related illnesses or death |
A heat-health watch alert system has been enforced, which will trigger response from the government and public health system to communicate risks and cost-effective preventative measures during heat wave events. |
|
Increased conflict and/or crime |
Short term |
Less serious | Medium |
In addition, loss of power after extreme weather events, such as hurricanes, can mean higher incidence of crime (e.g. looting and theft) |
The region has implemented neighbourhood watch schemes across different municipalities to ensure that crime is prevented. |
2.6 What opportunities due to addressing climate change is your region taking advantage of?
Change from 2020
No change
Response Options
Please complete the following table. You are able to add rows by using the “Add Row” button at the bottom of the table.
| Opportunities | Please explain |
|---|---|
|
Select from:
|
Text field |
[Add Row]
Guidance
This question invites you to detail the opportunities for your region due to addressing climate change, and asks you to describe how your region is seizing them. Please select as many options that apply to your region from the drop-down list. The table has the following fields:
- Opportunities: Please select the relevant opportunity for your region. If you want to add other types of opportunities that are not listed in the provided drop-down options, please select "Other, please specify" and specify the type of opportunity.
- Please explain: For each of the opportunities identified, please use this field to highlight what your region is doing to seize the relevant opportunity. If you selected "No opportunities from addressing climate change identified" then please explain why this is the case.
This question allows you to report on multiple opportunities by adding an additional row.
Regional projects seeking financing
2.7 List any emission reduction, adaptation, water related or resilience projects that you have planned within your region for which you hope to attract financing, and provide details on the estimated costs and status of the project. If your region does not have any relevant projects, please select “No relevant projects” under Project Area.
Change from 2020
No change
Response Options
Please complete the following table. You are able to add rows by using the “Add Row” button at the bottom of the table.
| Project area | Status of project | Status of financing | Project description | Total cost of project in the currency reported in question 1.1 | Total investment cost needed in the currency reported in question 1.1 (if relevant) |
|---|---|---|---|---|---|
|
Select from:
|
Select from:
|
Select from:
|
Text field |
Numerical field |
Numerical field |
[Add Row]
Guidance
The goal of this question is to understand what climate-change related projects your region is currently seeking external financing for from public or private institutions. These may be projects relating to renewable energy, sustainable transport, building or energy efficiency, waste or other climate-related areas. Use the table in this question to list the different projects your region is looking to attract financing for – you can add multiple projects by clicking “Add row”. If your region is not currently seeking financing on any relevant projects, please select “No relevant projects” in the Project Area field. The table has the following fields:
- Project area: Use the drop-down options to select the project area that is closest to the project that your region is seeking financing for. If your region does not have any projects currently seeking financing, please select “No relevant projects”. Please select “Other” if you want to report a project that cannot be categorized using the options provided in the drop-down list.
- Status of project: Please indicate the current status of the project by selecting from the following options:
Scoping – If your region is in the process of developing a project plan, this is also known as the identification phase.
Pre-feasibility study – If your region is researching the feasibility of the project plan, this is known as the evaluation phase.
Pre-implementation – If your region has developed a project plan but not begun implementation, this is also known as the feasibility or definition phase.
Implementation – If the project has started implementation (execution).
Operation – If the project is in full operation.
Complete – If the project is complete.
Measurement and reporting – If the project is complete and results are being measured.
- Status of financing: Please indicate the status of the project’s financing by selecting from the following options:
Project not funded and seeking partial funding – If the project is not funded and your region is seeking financing for part of the project. If your project is in this status, please use the Total investment cost needed (if relevant) field in the table to indicate the amount of finance being sought.
Project not funded and seeking full funding – If the project is not funded and seeking financing for the whole project. If your project is in this status, please indicate how much finance is being sought in the Total investment cost needed (if relevant) field of the table.
Project partially funded and seeking additional funding – If the project is partially financed, but your state/region is still seeking additional finance. If your project is in the status, please indicate how much finance has already been received and how much additional finance is being sought.
Project fully funded – If the project is fully financed, but your state/region is still seeking additional finance. If your project is in the status, please indicate how much finance has already been received and how much additional finance is being sought.
Other – Please use this option if there is a different status that best describes your region’s project(s).
- Project description: Use this text field to describe the project. This can include, for example, further information on the type of project (i.e. whether the project is an infrastructure development, policy and regulation based, a financial mechanism, education and awareness raising, ICT etc.), whether this project contributes towards meeting a climate-related target in your region and the impact of the project (i.e. emissions reduction, energy security, green economy, sustainable mobility, job creation etc.).
- Total cost of project: Give an estimate of the total overall cost of the project, including any financing, which has already been secured. The currency reported in question 1.1 would be used here.
- Total investment cost needed (if relevant): Indicate how much finance you hope to raise for the project. If your project is partially financed and seeking additional finance, please indicate the amount of money your region is still seeking. The currency reported in question 1.1 would be used here.
3. Emissions - Region-wide
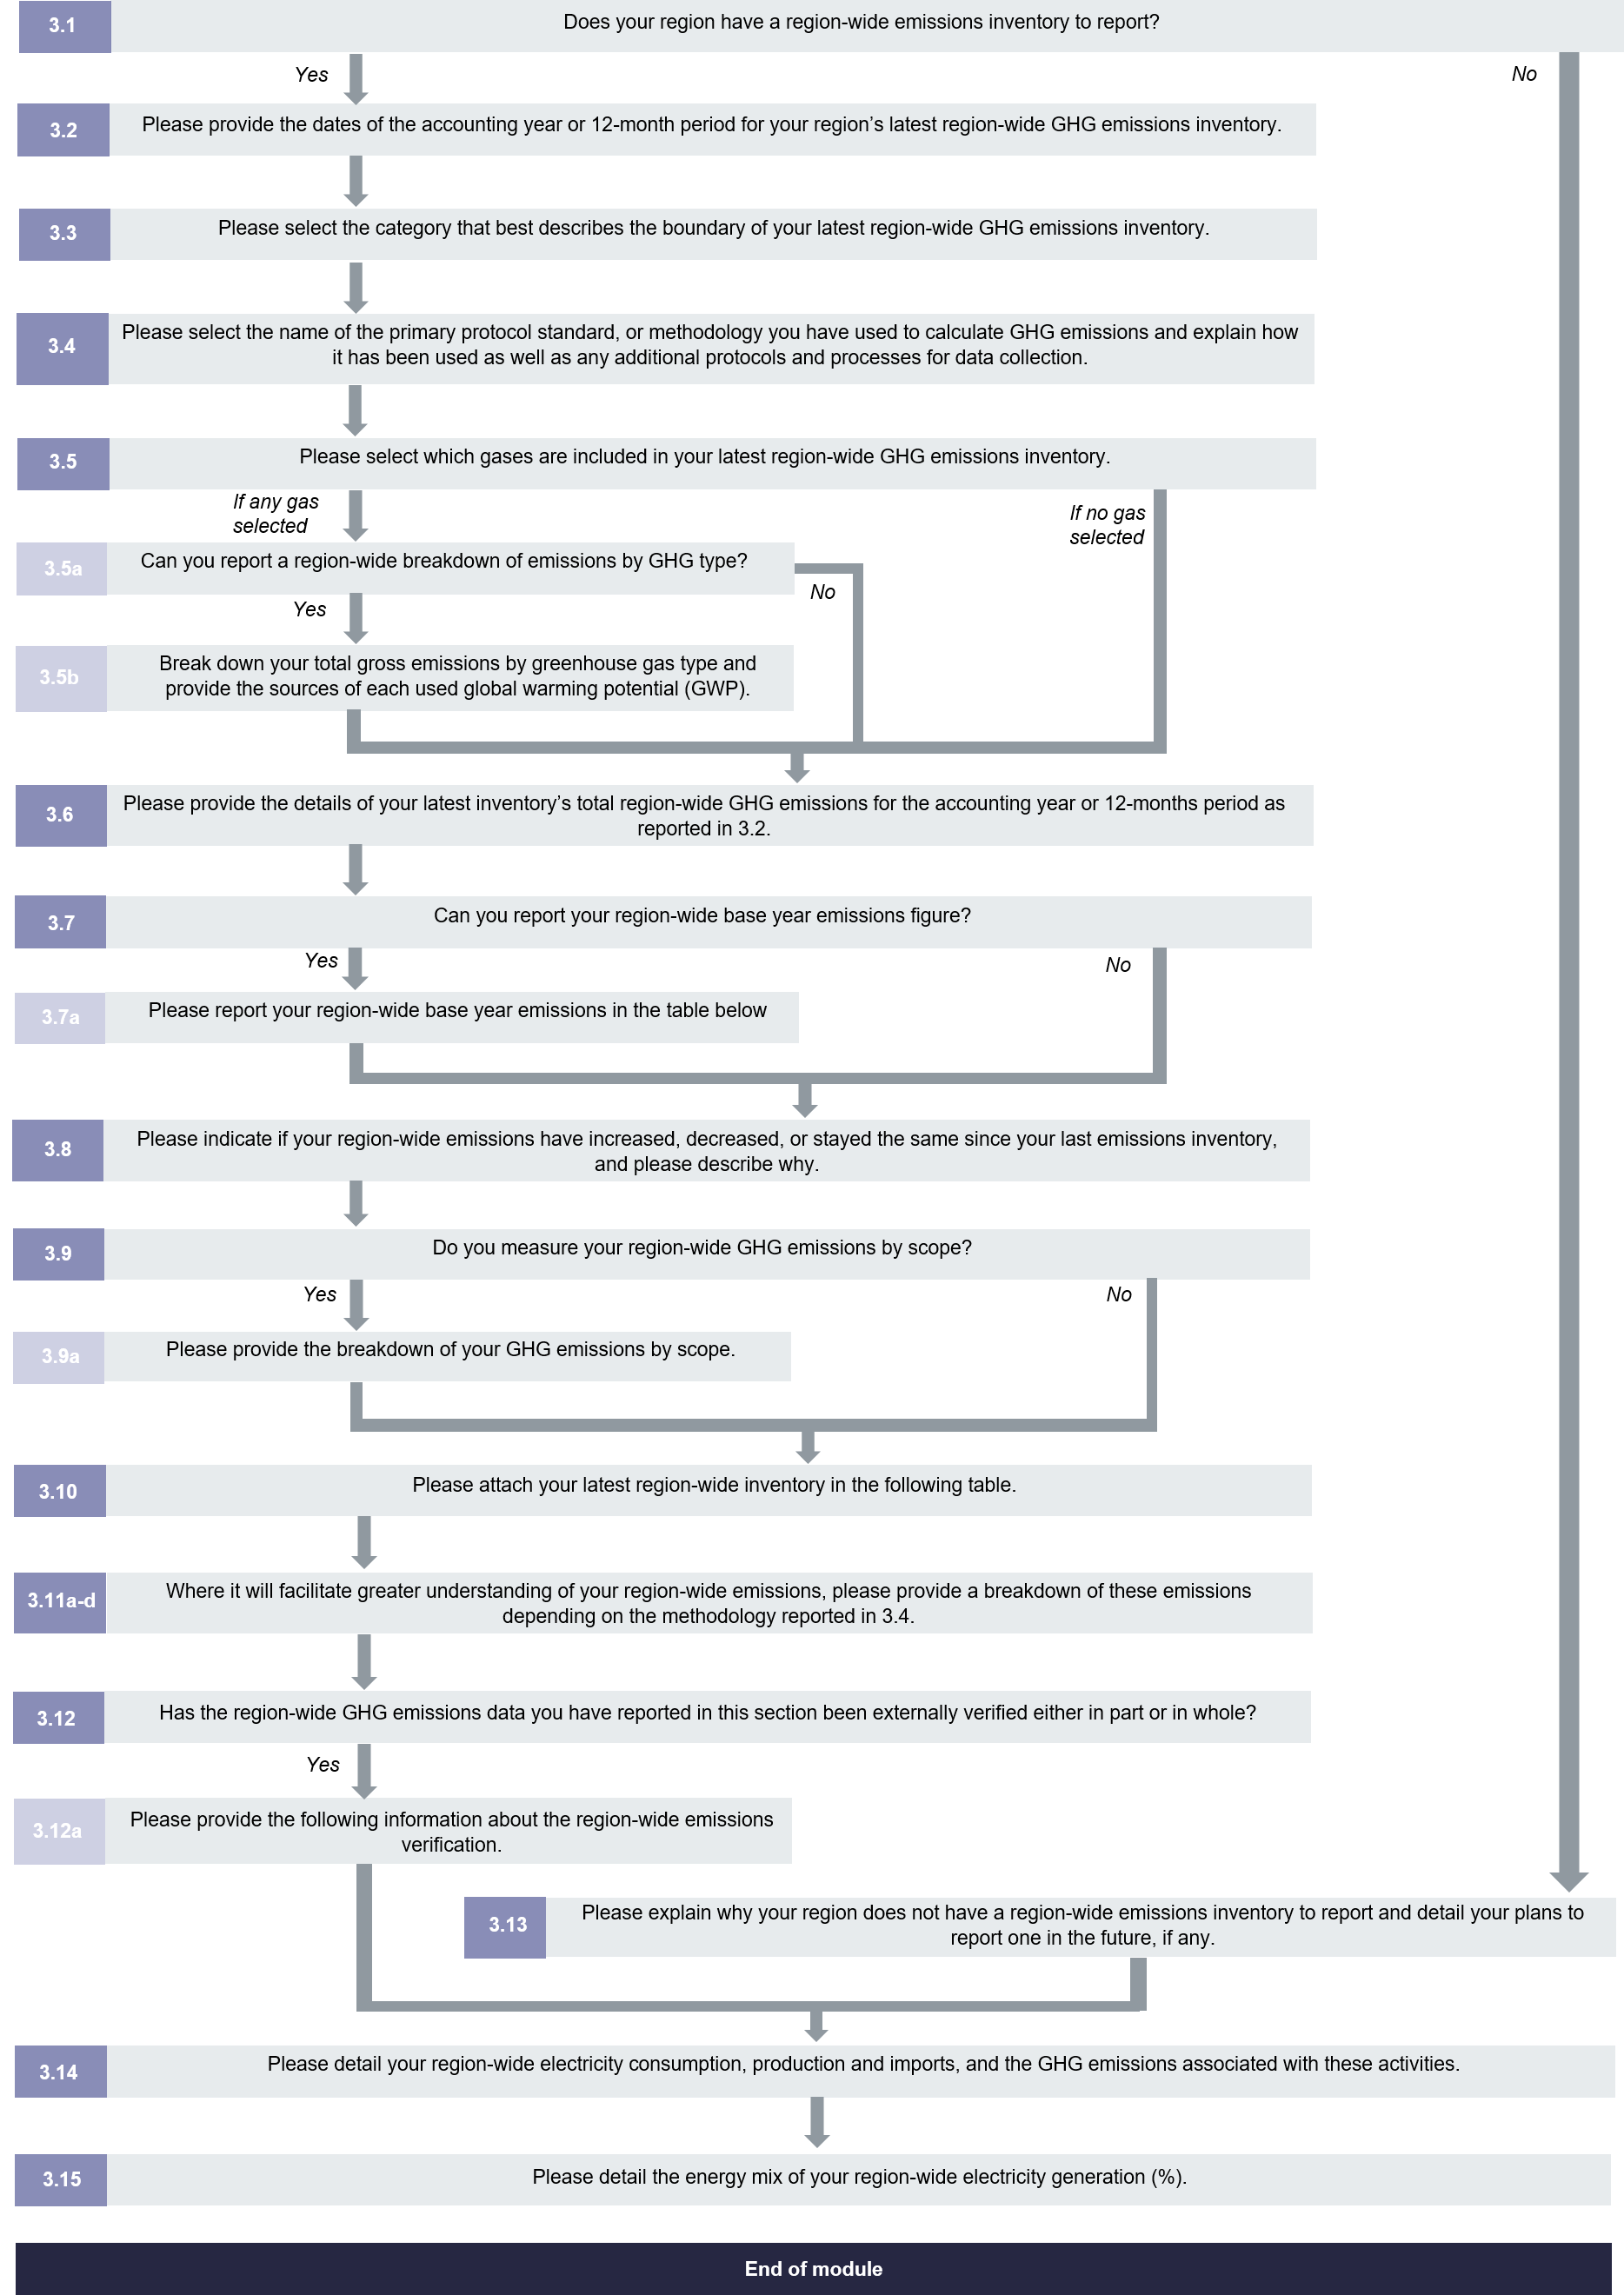
Pathway diagram
This diagram shows the questions contained in this section. To access question-level guidance, use the menu on the left to navigate to the question.
Greenhouse gas (GHG) emissions data – Region-wide
3.1 Does your region have a region-wide emissions inventory to report?
Change from 2020
No change
Response Options
Select one of the following options:
- Yes
- No
Guidance
This question asks states and regions whether they have a region-wide emissions inventory to report. By selecting “Yes”, you are indicating that you have region-wide GHG emissions data from the entire region over which the regional government can exercise a degree of influence through the policies and regulations they implement to report at this time. This question allows states and regions to select “No” as a response to this question. This directs them to question 3.13, which invites them to explain the reasoning behind their response. States and regions that responded with “No” will only see this question, while those that have selected “Yes” will see additional questions designed to ask states and regions specific details regarding their region-wide emissions inventory.
Capturing region-wide emissions – often referred to as the “territorial” emissions inventory – creates a snapshot of all the region-wide activities and their contribution to global climate change. Collating region-wide emissions can provide a basis from which regions can develop policy and enact regulation with the aim of reducing these emissions. This distinction and imperative to capture data for both government operations emissions and the wider region represent the greatest difference between appropriate region-specific protocols and corporate emissions disclosing protocols.
3.2 Please provide the dates of the accounting year or 12-month period for your region’s latest region-wide GHG emissions inventory.
Question dependencies
This question only appears if you select “Yes” in response to 3.1.
Change from 2020
No change
Response Options
Please complete the following table:
| From | To | Year of publication |
|---|---|---|
|
Drop-down calendar |
Drop-down calendar | Select from: Drop-down list: 1990 – 2021 |
Guidance
The reporting platform provides a drop-down calendar for you to enter the dates requested. Entries must be for a 12-month period. Please provide the start and end dates of the period covered by your emissions inventory. Please ensure that this is the year covered by the emissions inventory and not the year of publication or the year when the assessment was made. If you do not have data for the entire 12-month period or if your inventory covers multiple years, please extrapolate to 12 months. This 12-month period should align with the inventory period reported in 3.6. If the period your enter is not a 12-month period you will receive an error message in the reporting platform and will be unable to submit your response. In the column ‘Year of publication’ please select from the drop-down list provided the year in which the region-wide emissions inventory was published.
Additional information
It is good practice to use a calendar year for reporting emissions and removals. The IPCC provides Approaches to Data Collection, on how to proceed when data for the calendar year reporting are not available or not considered suitable.
Example Response
| From | To | Year of publication |
|---|---|---|
|
01/01/2015 |
31/12/2015 | 2016 |
3.3 Please select the category that best describes the boundary of your latest region-wide GHG emissions inventory.
Question dependencies
This question only appears if you select “Yes” in response to 3.1.
Change from 2020
No change
Response Options
Select one of the following options:
- Geopolitical Boundary—physical areas over which your government has jurisdictional control
- Other, please specify
Guidance
In your answer, please choose from the list of options provided. Examples of approaches that might be used by your region other than its geopolitical boundary in the US for instance include county or regional GHG accounting. Circumstances where this might be undertaken include where your region’s geopolitical boundary is small relative to the total population, economic activity and land area that are symbiotic with a particular urban center of the region. If you select "Other, please specify", you will be given the opportunity to enter the relevant boundary in the text field. You can use the comment box to outline if the boundary of the emissions inventory does or does not match with the administrative boundary of the reporting entity. If it does not, then please specify the exclusions and/or additions to the administrative boundary.
3.4 Please select the name of the primary protocol, standard, or methodology you have used to calculate GHG emissions and explain how it has been used as well as any additional protocols and processes for data collection.
Question dependencies
This question only appears if you select “Yes” in response to 3.1.
Change from 2020
No change
Response Options
Please complete the following table:
| Primary protocol | Please explain | Inventory quality control measures |
|---|---|---|
|
Select from:
|
Text field |
Text field |
Guidance
In CDP’s reporting platform, you will see a list of methodologies developed by third parties. Please select the primary methodology that you followed in measuring greenhouse gas emissions for your region. If you do not see your chosen methodology reflected in the list please select “Other, please specify” and describe your methodology. We recognize that many regions follow multiple protocols in creating their inventories; if this is the case for your region, please choose the protocol that is best described as your “primary” protocol. The explanation field is incorporated in this question to allow states and regions to briefly explain how the selected protocol is used and any additional protocols and processes use for the collection of data and development of region-wide inventories. If your response to this question is “Other, please specify”, please provide enough information to make clear issues such as boundaries, data capture and accounting/calculation techniques, and decision-making criteria for which emissions to include.
Region-wide GHG emissions inventory protocols and methodologies
The options to choose from include:
- 1996 IPCC Guidelines for National Greenhouse Gas Inventories
- 2006 IPCC Guidelines for National Greenhouse Gas Inventories
- International Emissions Analysis Protocol (ICLEI)
- The Climate Registry General Reporting Protocol
- US. EPA Greenhouse Gas Disclosing Program (includes US EPA SIT tool, FLIGHT tool, etc.)
- EMEP/EEA air pollution emission inventory guidebook (EMEP CORINAIR emission inventory)
- Regional specific methodology – For protocols, methodologies and/or standards that are used for a specific region
- Country specific methodology – For protocols, methodologies and/or standards that are used for a specific country
- Other – Please specify the protocol/methodology you used
These values are not meant to be exhaustive. If you have used a proprietary methodology or a third party methodology that you do not see listed here, please select “Other, please specify” and enter the name of the methodology in the text field provided.
Some of these measurement methodologies share general principles. Many of these principles are included in the WRI/WBCSD GHG Protocol (and other similar methods) and the following is quoted directly from the ICLEI International Emissions Analysis Protocol:
- Relevance: the greenhouse gas inventory shall appropriately reflect the greenhouse gas emissions of the government operations or the region and should be organized to reflect the areas over which regional governments exert control and hold responsibility in order to serve the decision-making needs of users.
- Completeness: all greenhouse gas emission sources and activities within the chosen inventory boundary shall be accounted for. Any specific exclusion should be disclosed.
- Consistency: consistent methodologies to allow for meaningful comparisons of emissions over time shall be used. Any changes to the data, inventory boundary, methods, or any relevant factors in the time series shall be disclosed.
- Transparency: all relevant issues shall be addressed in a factual and coherent manner to provide a clear audit trail, should auditing be required. Any relevant assumptions shall be disclosed and include appropriate references to the accounting calculation methodologies and data sources used, which may include this protocol and any relevant supplements.
- Accuracy: the quantification of greenhouse gas emissions should not be systematically over or under the actual emissions. Accuracy should be sufficient to enable users to make decisions with reasonable assurance as to the integrity of the reported information.
Many methodologies also suggest similar best practices in measuring greenhouse gas emissions. Some of these suggestions are detailed here:
- Definition of boundaries (operational and organizational) to restrict emissions to only those that are relevant (or material) to the organization. In general, this relates to those emissions under the direct control or influence of the organization (and excludes regional emissions) this is dealt with in a later section of the questionnaire.
- Attention to the integrity of the data sources and calculation rules to produce consistent results.
- Disaggregating total emissions for sector- or activity-based disclosing.
- Many methodologies (though not all) also encourage the use of “Scopes” to differentiate the level of control over the source of the emissions.
- Use of emissions factors to normalize emissions data (carbon intensity or carbon equivalents) across gases, activities or geographies.
- Disclosing against, as a minimum, the six main greenhouse gases defined by the United Nations Framework Convention on Climate Change (UNFCCC): carbon dioxide (CO2), methane (CH4), nitrous oxide (N2O), perfluorocarbons (PFCs), hydrofluorocarbons (HFCs) and sulphur hexafluoride (SF6).
Inventory quality control measures
- Please use this column to explain any quality control and/or improvement processes your region has in place for your region-wide inventory. Chapter 6 of the 2006 IPCC Guidelines for National Greenhouse Gas Inventories describes methods to drive inventory improvement.
- Quality Control (QC) is defined in the 2006 IPCC Guidelines for National Greenhouse gas Inventories as a system of routine technical activities to assess and maintain the quality of the inventory as it is being compiled. It is performed by personnel compiling the inventory. The QC system is designed to:
- Provide routine and consistent checks to ensure data integrity, correctness, and completeness;
- Identify and address errors and omissions;
- Document and archive inventory material and record all QC activities.
3.5 Please select which gases are included in your latest region-wide GHG emissions inventory.
Question dependencies
This question only appears if you select “Yes” in response to 3.1.
Change from 2020
No change
Response Options
Select all that apply:
- CO2
- CH4
- N2O
- HFCs
- PFCs
- SF6
- NF3
Guidance
The list consists of the main greenhouse gases defined by the United Nations Framework Convention on Climate Change (UNFCCC): carbon dioxide (CO2), methane (CH4), nitrous oxide (N2O), hydrofluorocarbons (HFCs), perfluorocarbons (PFCs), sulphur hexafluoride (SF6), as well as nitrogen trifluoride (NF3).
3.5a Can you report a region-wide breakdown of emissions by GHG type?
Question dependencies
This question only appears if you select any gas in response to 3.5.
Change from 2020
No change
Response Options
- Yes
- No
- Don't know
Guidance
This question asks states and regions if they can break down their emissions by greenhouse gas type, as greenhouse gases other than carbon dioxide are significant and relevant. This question allows states and regions to select "No" as a response to this question. Those that have selected "Yes" will see an additional question where states and regions will be requested to break down their emissions in CO2-equivalents (CO2e) by greenhouse gas type.
3.5b Break down your total gross emissions by greenhouse gas type and provide the source of each used global warming potential (GWP).
Question dependencies
This question only appears if you select “Yes” in response to 3.5a.
Change from 2020
No change
Response Options
| Greenhouse gas | Total gross emissions (metric tonnes CO2e) | Global Warming Potential reference (select relevant IPCC Assessment Report) |
|---|---|---|
Select from:
|
Numerical field | Select from:
|
[Add row]
Guidance
Because greenhouse gases are often only reported in CO2-equivalents, their contribution to overall emissions are sometimes masked. UNFCCC Global Warming Potentials (GWPs) are used to estimate, compare, and aggregate the relative climate effects of various greenhouse gases (GHGs). They are a measure of the relative radiative effect of a given substance compared to another, integrated over a chosen time horizon.
- Greenhouse gas: Please report your regions emissions of the Kyoto greenhouse gases, which are:
- Carbon dioxide (CO2)
- Methane (CH4)
- Nitrous oxide (N2O)
- Hydrofluorocarbon family of gases (HFCs)
- Perfluorocarbon family of gases (PFCs)
- Sulfur hexafluoride (SF6)
- Nitrogen trifluoride (NF3) has been included in the basket of mandated GHGs as it is considered a potent contributor to climate change and is therefore mandated to be included in national inventories under the United Nations Framework Convention on Climate Change (UNFCCC).
- While only the above-named seven gases are requested, you may enter others if you wish by selecting the "Other, please specify" option from the drop-down menu in column 1 and entering the name of the gas.
- Total gross emissions (metrics tons of CO2e): Report your emissions of the greenhouse gas selected in column 1, in CO2-equivalents (CO2e).
- Global Warming Potential reference (select relevant IPCC Assessment Report): Select the relevant IPCC Assessment Report from which you have sourced the GWP's used to standardized your emissions to a carbon dioxide equivalent (CO2e). If you have used a calculation tool and do not know which GWPs have been applied to your data, you may wish to consult the tool documentation or reference sources.
Explanation of Terms
Global Warming Potential (GWP): The intergovernmental Panel on Climate Change (IPCC)'s Fifth Assessment Report (AR5) defines the Global Warming Potential (GWP) as “an index, based on radiative properties of greenhouse gases, measuring the radiative forcing following a pulse emission of a unit mass of a given greenhouse gas in the present-day atmosphere integrated over a chosen time horizon, relative to that of carbon dioxide. The GWP represents the combined effect of the differing times these gases remain in the atmosphere and their relative effectiveness in causing radiative forcing. The Kyoto Protocol is based on GWPs from pulse emissions over a 100-year time frame.” By using GWPs, GHG emissions from multiple gases can be standardized to a carbon dioxide equivalent (CO2e).
3.6 Please provide the details of your latest inventory’s total region-wide GHG emissions for the accounting year or 12-month period as reported in 3.2.
Question dependencies
This question only appears if you select “Yes” in response to 3.1.
Change from 2020
No change
Response Options
Please complete the following table:
| Emission types | Emissions of latest inventory (metric tonnes CO2e) | Comments |
|---|---|---|
|
Total gross emissions (excludes sinks) |
Numerical field
|
Text field |
|
Total net emissions (includes sinks) |
Numerical field |
Text field |
Guidance
This question allows you to enter the total gross and net region-wide GHG emissions for the reported year. Please note that if you enter a value for total net emissions that is higher than or equal to the value for total gross emission you will receive an error message and will not be able to submit your response. If your region does not calculate one of these types of total, please leave that row blank. The table has the following fields:
- Emission types: There are two types of emissions this question requests information on:
Total gross emissions (excludes sinks): Gross emissions are your total GHG emissions from before accounting for any emission reductions from sinks – forest carbon removals, vegetation, and soils. Gross emissions include emissions from the five main IPCC sectors – Energy, Industrial Processes and Product Use (IPPU), Agriculture, Forestry and Other Land Use (AFOLU), Waste and Other.
Total net emissions (includes sinks) – Net emissions include both emissions and removals from land-use change and forestry (LUCF) is the difference between the amount of carbon sequestered in sinks and the amount emitted by sources. The value for total net emissions should be lower than total gross emissions.
- Emissions of latest inventory (metric tonnes CO2e): This question is your opportunity to enter the total figure for your region’s GHG emissions in the selected year. Your answers will be numeric entries (metric tonnes of CO2e).
- Comments: This field is to provide you an opportunity to state additional information regarding your total emissions and/or level of confidence.
Example Response
| Emission types | Emissions of latest inventory (metric tonnes CO2e) | Comments |
|---|---|---|
|
Total gross emissions (excludes sinks) |
404700000 |
Excluding sinks and fugitive emissions from natural gas distribution |
|
Total net emissions (includes sinks) |
404000000 |
This includes sinks from land use, land use change and forestry (LULUCF) |
3.7 Can you report your region-wide base year emissions figure?
Question dependencies
This question only appears if you select “Yes” in response to 3.1.
Change from 2020
No change
Response Options
Select one of the following options:
- Yes
- No
Guidance
The rationale for this question is to get insights on whether states and regions are tracking changes over time from their base year region-wide emissions. Base year emissions, under the Kyoto Protocol, are defined as the aggregate anthropogenic carbon dioxide equivalent emissions of the GHGs sources in a historical base year. It is essential that governments seek to continuously track progress against their targets and adjust their climate policies, incentives and actions accordingly. In order to maintain the momentum that was catalysed by the adoption and ratification of the Paris Agreement, governments must show that their targets are more than just aspirational by reducing their emissions to levels that are lower than their base year (historic reference). If you selected “Yes” as a response to this question, you will be directed to completing the table for question 3.7a.
3.7a Please report your region-wide base year emissions in the table below.
Question dependencies
This question only appears if you select “Yes” in response to 3.7.
Change from 2020
No change
Response Options
Please complete the following table:
| Emissions type | Base year | Total emissions of base year inventory (metric tonnes CO2e) | Comments |
|---|---|---|---|
| Gross emissions (excludes sinks) | Numerical field |
Numerical field | Text field |
| Net emissions (includes sinks) | Numerical field | Numerical field | Text field |
Guidance
It is best practice as part of a robust accounting framework to track emissions over time comprehensively, and consistently from a given base year. Guidelines for defining and adjusting a base year can be found here (US Environment Protection Agency - Climate Leaders GHG Inventory Protocol). The table has the following fields:
- Emissions types: There are two types of emissions this question ask for information on:
- Total gross emissions (excludes sinks): Gross emissions are your total GHG emissions from before accounting for any emission reduction from sinks - forest carbon removals, vegetation, and soils. Gross emissions include emissions from the five main IPCC sectors - Energy, Industrial Processes and Product Use (IPPU), Agriculture, Forestry and Other Land Use (AFOLU), Waste and Other.
- Total net emissions (includes sinks): Net emissions include both emissions and removals from land-use change and foestry (LUFC) is the difference between the amount of carbon sequestered in sinks and the amount emitted by sources. The value of total net emissions should be lower than total gross emissions.
- Base year: Please provide the reference year from which your greenhouse gas reductions are measured.
- Total emissions of base year emissions inventory (metric tonnes CO2e): Please enter the numerical value of your base year gross and net emissions.
- Comments: This field is to provide you an opportunity to state additional information regarding your base year emissions. if you do not have a base year emissions figure, then please report this here.
3.8 Please indicate if your region-wide emissions have increased, decreased, or stayed the same since your last emissions inventory, and please describe why.
Question dependencies
This question only appears if you select “Yes” in response to 3.1.
Change from 2020
No change
Response Options
Please complete the following table:
| Change in emissions | Reason for change | Please epxlain |
|---|---|---|
|
Select from:
|
See drop-down options below
|
Text field |
Reason for change drop-down options:
If “Increased” is selected:
- Increased energy/electricity consumption
- Population increase
- Policy/legislative change
- Financial conditions
- Emissions reduction actions not implemented
- Change in weather conditions
- Change in activity data
- Change in emission factors
- Change in available data
- Change in data collection methods
- Improved data accuracy
- Change in accounting methodology
- Change in calculation following verification
- Other, please specify
If “Decreased” is selected:
- Reduced energy/electricity consumption
- Behavioural change
- Technological change
- Policy/legislative change
- Financial conditions
- Emissions reduction actions implemented
- Change in weather conditions
- Change in activity data
- Change in emission factors
- Change in available data
- Change in data collection methods
- Improved data accuracy
- Change in accounting methodology
- Change in calculation following verification
- Other, please specify
If “This is our first year of calculation” is selected:
- Previous data was not reliable
- Lack of resource / funding overcome
- Lack of knowledge overcome
- Other, please specify
If “Stayed the same” is selected:
- No new inventory to report
- Emissions have not changed
- Other, please specify
If “Do not know” is selected:
- Change in staff
- Lack of documentation
- Change in accounting methodology
- Other, please specify
Guidance
This is a table question with the following fields:
- Change in emissions: Please select how your emissions have changed compared to the emissions you reported last time from the options provided in the drop-down list.
- Reason for change: Please select from the drop-down menu (depending on the response to the Change in emissions field) to indicate some of the reasons you have identified that led to this change. For example, if you previously reported emissions from 2017 and your are now reporting emissions from 2019 please explain any material difference in the figures. For instance, you may have experienced population increase, change in reporting methodology, financial conditions, which may have affected the figures.
- Please explain: This field is added for you to explain the changes in your emissions. If this figure is available, then please report the change in emissions from the latest emissions inventory as a percentage or absolute value.
Example Response
| Change in emissions | Reason for change | Please explain |
|---|---|---|
|
Decreased |
Policy change |
Last year we reported emissions from our last inventory calculated in 2017. This year we have updated our inventory and notice a decrease in our total emissions. We believe this change can be explained by our stringent policies, which we have implemented to reduce emissions. |
3.9 Do you measure your region-wide GHG emissions by scope?
Question dependencies
This question only appears if you select “Yes” in response to 3.1.
Change from 2020
No change
Response Options
Select one of the following options:
- Yes
- No
Guidance
Please provide a “Yes” or “No” answer using the drop-down menu provided. If you answer “Yes” you will be directed to question 3.9a.
3.9a Please provide the breakdown of your GHG emissions by scope.
Question dependencies
This question only appears if you select “Yes” in response to 3.9.
Change from 2020
No change
Response Options
Please complete the following table:
| Scope | Metric tonnes CO2e | Comments |
|---|---|---|
|
Scope 1 emissions excluding emissions from grid-supplied energy generation |
Numerical field |
Text field |
|
Scope 1 emissions from grid-supplied energy generation within the region’s boundary |
Numerical field |
Text field |
|
Total Scope 1 emissions (Row 1 + Row 2) |
Numerical field |
Text field |
|
Total Scope 2 emissions |
Numerical field |
Text field |
|
Total (Scope 1 + Scope 2) emissions |
Numerical field |
Text field |
|
Total Scope 3 emissions |
Numerical field |
Text field |
Guidance
If you categorize your emissions by scope, please enter the appropriate figures for your Scope 1, 2 and 3 emissions. Where values are not available, please use the comment field to indicate the reason why. This table question breaks down emissions into scope 1, 2 and scope 3. Scope 1 emissions are further split into emissions excluding grid-supplied energy generation and emissions exclusively from grid-supplied energy generation within your regional boundaries. The table has the following fields:
- Metric tonnes CO2e: Please provide your response as a numeric entry. If you do not break down your scope 1 emissions in this way, then please still fill in your total scope 1 emissions in the third row.
- Comments: If you do not have the full breakdown of your region’s emissions by scope, please use the comments field to indicate this, and any reasoning you may have.
Explanation of terms
- Scope 1: Total amount of fuel that has been consumed within your region-disclosing boundary. Your number will depend on which fuel sources you measure and what you include within your boundary. For instance, you might include the fuel consumed by residential, commercial, and industrial buildings, road transportation, and energy production. Alternatively, you might also include the fuels used by water travel (e.g. water taxis) and planes that take off and land at your regional airports.
- Scope 2: Detail the amount of electricity, heat, steam, or cooling, referring to indirect emissions that has been supplied to all of the entities within your region-wide boundary during the disclosing year. Your number will depend on which energy users you include in your total. For instance, you might include residential, commercial, and industrial buildings and industrial processes.
- Scope 3: All other indirect emissions not covered in Scope 2, such as emissions resulting from the extraction and production of purchased materials and fuels, transport-related activities in vehicles not owned or controlled by the disclosing entity (e.g. employee commuting and business travel), outsourced activities, waste disposal, etc.
3.10 Please attach your latest region-wide inventory in the table below.
Question dependencies
This question only appears if you select “Yes” in response to 3.1.
Change from 2020
No change
Response Options
Please complete the following table:
| Document title | Attachment | Level of confidence | Comment on level of confidence |
|---|---|---|---|
|
Text field |
Attach your document here. |
Select from:
|
Text field |
Guidance
This question allows states and regions to directly upload their emissions inventory. If you have an inventory you wish to upload, please complete the table used for this question.
- Document title: Provide the title of your emissions inventory.
- Attach your inventory: Use this field to attach your region’s inventory. You can do this by clicking the attachment icon and uploading inventory file. Please note that if you use a mixture of methodologies you can attach multiple documents to this question.
- Level of confidence: Please select the level of confidence associated with your total emissions figure.
High – Select high if your inventory has a high level of accuracy.
Medium – Select medium if your inventory has a medium level of accuracy.
Low – Select low if your inventory has a low level of accuracy.
- Comment on level of confidence: Use this text field to comment on your selection in the level of confidence drop-down.
3.11a Where it will facilitate a greater understanding of your region-wide emissions, please provide a breakdown of these emissions by the 1996 IPCC sector in the table below.
Question dependencies
This question only appears if you select "1996 IPCC Guidelines for National Greenhouse Gas Inventories" in response to 3.4.
Change from 2020
No change
Response Options
Please complete the following table. You are able to add rows by using the “Add Row” button at the bottom of the table.
| 1996 IPCC sector | Emissions (metric tonnes CO2e) |
|---|---|
|
Select from:
|
Numerical field |
Guidance
The purpose of this question is to understand the breakdown of your state/region’s emissions by sector, as defined by the 1996 IPCC Guidelines for National Greenhouse Gas Inventories. You are provided with a table in the reporting platform to structure your response. Using the “Add row” function in this table allows you to report your state/region’s emissions breakdown using multiple sectors and scopes.
- 1996 IPCC sector: Please select the relevant sector as defined by the 1996 IPCC Guidelines for National Greenhouse Gas Inventories: Energy, Industrial Processes, Solvents, Land use, land use change and forestry, Agriculture and Waste.
- Emissions (metric tonnes CO2e): Report the emissions associated with that sector in metric tonnes CO2e.
- Emissions removal for the Land Use, Land Use Change & Forestry sector: If the emissions
figure for the LULUCF or AFOLU sector is negative due to emissions removals please leave this field blank in the reporting system and report the figure in the text field which is accessed by clicking on the speech bubble icon next to the question the in the reporting system.
Example Response
| 1996 IPCC sector | Emissions (metric tonnes CO2e) |
|---|---|
|
Energy |
475000 |
|
Industrial Processes |
100000 |
|
Solvents |
50000 |
|
Land use, Land use change and Forestry |
80000 |
|
Agriculture |
90000 |
|
Waste |
70000 |
Additional information
Please ensure that when the emissions of each sector are aggregated the total figure is equal to the region-wide total gross or net emissions figure as reported in question 3.6.
3.11b Where it will facilitate a greater understanding of your region-wide emissions, please provide a breakdown of these emissions by the 2006 IPCC sector in the table below.
Question dependencies
This question only appears if you select "2006 IPCC Guidelines for National Greenhouse Gas Inventories" in response to 3.4.
Change from 2020
No change
Response Options
Please complete the following table. You are able to add rows by using the “Add Row” button at the bottom of the table.
| 2006 IPCC sector | Emissions (metric tonnes CO2e) |
|---|---|
|
Select from:
|
Numerical field |
Guidance
The purpose of this question is to understand the breakdown of your state/region’s emissions by sector, as defined by the 2006 IPCC Guidelines for National Greenhouse Gas Inventories. You are provided with a table in the reporting platform to structure your response. Using the “Add row” function in this table allows you to report your state/region’s emissions breakdown using multiple sectors and scopes.
- 2006 IPCC sector: Please select the relevant sector as defined by the 2006 IPCC Guidelines for National Greenhouse Gas Inventories: Energy, Industrial Processes and Product Use, Agriculture, Forestry and Other Land Use, Waste and Other.
- Emissions (metric tonnes CO2e): Report the emissions associated with that sector in metric tonnes CO2e.
- Emissions removal for the Agriculture, Forestry, and Other Land Use sector: If the emissions figure for the LULUCF or AFOLU sector is negative due to emissions removals please leave this field blank in the reporting system and report the figure in the text field which is accessed by clicking on the speech bubble icon next to the question the in the reporting system.
Example Response
| 2006 IPCC sector | Emissions (metric tonnes CO2e) |
|---|---|
|
Energy |
475000 |
|
Industrial Processes and Product Use |
100000 |
|
Agriculture, Forestry and Other Land Use |
80000 |
|
Waste |
90000 |
|
Other |
70000 |
Additional information
Please ensure that when the emissions of each sector are aggregated the total figure is equal to the region-wide total gross or net emissions figure as reported in question 3.6.
3.11c Where it will facilitate a greater understanding of your region-wide emissions, please provide a breakdown of these emissions by UNFCCC sector.
Question dependencies
This question only appears if you select "International Emissions Analysis Protocol (ICLEI)" in response to 3.4.
Change from 2020
No change
Response Options
Please complete the following table. You are able to add rows by using the “Add Row” button at the bottom of the table.
| UNFCCC sector | Scope | Emissions (metric tonnes CO2e) |
|---|---|---|
|
Select from:
|
Select from:
|
Numerical field |
[Add Row]
Guidance
The purpose of this question is to understand the breakdown of your state/region’s emissions by sector, as defined by the UNFCCC and used by International Emissions Analysis Protocol (ICLEI). You are provided with a table in the reporting platform to structure your response. Using the “Add row” function in this table allows you to report your state/region’s emissions breakdown using multiple sectors and scopes.
- UNFCCC sector: Please select the relevant sector as defined by the UNFCC under the International Emissions Analysis Protocol (ICLEI): Stationary Energy, Transport, Fugitive Emissions, Industrial Processes, Agriculture, Land Use, Land Use Change and Forestry, Solid Waste Disposal, Wastewater Treatment and Discharge and Other.
- Scope: Please indicate the scope considered for each sector.
- Emissions (metric tonnes CO2e): Report the emissions associated with that sector in metric tonnes CO2e.
- Emissions removal for the Land Use, Land Use Change & Forestry sector: If the emissions figure for the LULUCF or AFOLU sector is negative due to emissions removals please leave this field blank in the reporting system and report the figure in the text field which is accessed by clicking on the speech bubble icon next to the question the in the reporting system.
Example Response
| UNFCCC sector | Scope | Emissions (metric tonnes CO2e) |
|---|---|---|
|
Stationary Energy |
Scope 1 |
475000 |
|
Transport |
Scope 2 |
35000 |
|
Fugitive Emissions |
Scope 1 |
20000 |
|
Industrial Processes |
Scope 1 |
100000 |
|
Agriculture |
Scope 1 |
80000 |
|
Land Use, Land Use Change and Forestry |
Scope 1 |
90000 |
|
Solid Waste Disposal |
Scope 1 |
90000 |
|
Wastewater Treatment and Discharge |
Scope 1 |
30000 |
Additional information
Please ensure that when the emissions of each sector are aggregated the total figure is equal to the region-wide total gross or net emissions figure as reported in question 3.6.
3.11d Where it will facilitate a greater understanding of your region-wide emissions, please provide a breakdown of these emissions by end user (buildings, water, waste, transport), economic sector (residential, commercial, industrial, institutional), or any other classification system used in your region.
Question dependencies
This question only appears if you select any other methodology in response to 3.4.
Change from 2020
No change
Response Options
Please complete the following table. You are able to add rows by using the “Add Row” button at the bottom of the table.
| Source | Scope | Emissions (metric tonnes of CO2e) |
|---|---|---|
|
Text field |
Select from:
|
Numerical field |
[Add Row]
Guidance
The purpose of this question is to learn more about how your regional government breaks down emissions, which can be valuable information for comparative understanding between states and regions. Please note that this question is flexible to accommodate many of the different kinds of categories used by states and regions. You are provided with a table in the ORS to structure your response. Examples of how your state/region might characterize and differentiate emissions are listed below and shown below.
End user - Buildings, transport, water utilities, wastewater utilities, etc.
Economic sector - Commercial, residential, industrial, agricultural, freight and logistics, etc.
Other - Please describe if your state/region uses another classification approach (e.g. by geography or zone, by zoning or land use classification, etc.).
Example Response
| Source | Scope | Emissions (metric tonnes CO2e) |
|---|---|---|
|
Buildings |
Scope 1 |
475000 |
|
Water |
Scope 1 |
10000 |
|
Transport |
Scope 1 |
10000 |
|
Stationary |
Scope 2 |
379000 |
|
Mobile |
Scope 2 |
18000 |
|
Railways |
Scope 2 |
350000 |
Additional information
Please ensure that when the emissions of each end user, sector or other forms of emissions categorization are aggregated the total figure is equal to the region-wide total gross or net emissions figure as reported in question 3.6.
External verification – Region-wide
3.12 Has the region-wide GHG emissions data you have reported in this section been externally verified either in part or in whole?
Question dependencies
This question only appears if you select “Yes” in response to 3.1.
Change from 2020
No change
Response Options
Select one of the following options:
- Yes
- No
Guidance
Regional governments may see value in having external verification or auditing of their emissions and emission reduction efforts. This can ensure higher levels of quality control/quality assurance. Externally verified information may also be required if performance metrics related to carbon emissions have been devised for government departments or department managers. The ability to call on verified data may provide government organizations a powerful tool in their efforts to influence policy or regulation at other levels of government or with other regional stakeholders. Please only state that you have had or are having verification/assurance carried out if it is by an independent third party accredited to perform verification of GHG data.
Select your response from the following options:
- Yes - will direct you to question 3.12a
- No - will direct you to question 3.12b
3.12a Please provide the following information about the region-wide emissions verification.
Question dependencies
This question only appears if you select “Yes” in response to 3.12.
Change from 2020
No change
Response Options
Please complete the following table:
| Name of verifier | Year of verification | Comments |
|---|---|---|
|
Text field |
Drop-down list: 2010 – 2021 |
Text field |
Guidance
This question only applies if you have answered “Yes” to question 3.12. This question provides an opportunity to describe relevant information about the verification process. CDP regards verification as process undertaken by an independent third party accredited to perform verification/assurance of the GHG emissions data. Report any comments or relevant information you have on the verification process and what emissions have been included in the verification, for example if it is region-wide emissions or sector-specific emissions that have been verified. Activities using external data helps establish the reliability for the intended applications of the inventory. As a valuable element of the Quality Assurance/Quality Control (QA/QC) system of the inventory management, there are different tools for verification published by the IPCC.
3.13 Please explain why your region does not have a region-wide emissions inventory to report and detail your plans to report one in the future, if any.
Question Dependencies
This question only appears if you select "No" in response to 3.1
Change from 2020
No change
Response Options
Please complete the following table
| Reason | Please epxlain |
|---|---|
Select from:
| Text field |
Guidance
This is question only appears if you selected “No” to question 3.1. The aim of this question is to allow states and regions to give more details on why they do not have information to report regarding their region-wide emissions inventory by selecting an option from the drop-down options in the “Reasoning” field. States and regions can also provide more details and additional information to explain their choice in the “Please explain” field.
Region-wide electricity
3.14 Please detail your region-wide electricity consumption, production and imports, and the GHG emissions associated with these activities.
Change from 2020
No change
Response Options
Please complete the following table:
| Region-wide electricity | Amount of electricity | Units | Associated GHG emissions (metric tonnes of CO2e) | Year data applies to | Comments |
|---|---|---|---|---|---|
|
Electricity consumed |
Numerical field |
Select from:
|
Numerical field |
Numerical field |
Text field |
|
Electricity produced |
Numerical field |
Select from:
|
Numerical field |
Numerical field |
Text field |
|
Electricity imported |
Numerical field |
Select from:
|
Numerical field |
Numerical field |
Text field |
Guidance
This question is your opportunity to detail the amount of electricity generated in your region, consumed by your region and imported by your region. Electricity generated refers to “in-state” generation. The associated GHG emissions are also asked for. The table has the following fields:
- Amount of electricity: Your answers must be numeric entries without commas (i.e. 1000).
- Units: Select from the drop-down the corresponding unit for the number entered in the previous field (GWh; MWh; kWh; TJ; GJ; MJ)
- Associated GHG emissions (metric tonnes of CO2e): Your answers must be numeric entries (i.e. 1000).
- Reporting year of data used: Please state the relevant year for the data you used for your region-wide electricity consumption, production and imports.
- Comments: Please provide any contextualizing information on the electricity figures or their associated GHG emissions. This comments field is particularly important for this question as electricity use is quantified differently in different states. Please provide clear information that accurately explains the data you have inputted.
Explanation of terms
- Electricity consumed: Electricity consumption is based on calculated consumption; this equals the energy supplied minus transmission and distribution losses.
- Electricity produced: It is the total amount of electrical energy produced by transforming other forms of energy – minus the consumption of power stations' auxiliary services for Net total.
- Electricity imported: This refers to the total imported electricity used to supply consumers, e.g. through electricity networks connected to systems in other countries.
Example Response
| Region-wide electricity | Amount of electricity | Units | Associated GHG emissions (metric tonnes of CO2e) | Year data applies to | Comments |
|---|---|---|---|---|---|
|
Electricity consumed |
47974.80 |
GWh |
19093954 |
2019 |
Emissions are calculated by applying the National electricity emission factor for 2017 |
|
Electricity produced |
45355.20 |
GWh |
18051385 |
2019 |
Gross electricity production |
|
Electricity imported |
4689.60 |
GWh |
1866441 |
2019 |
Net electricity imports |
3.15 Please detail the energy mix of your region-wide electricity generation (%).
Change from 2020
No change
Response Options
Please complete the following table:
| Energy source | Percentage |
|---|---|
|
Coal |
Percentage field |
|
Gas |
Percentage field |
|
Oil |
Percentage field |
|
Nuclear |
Percentage field |
|
Biomass |
Percentage field |
|
Geothermal |
Percentage field |
|
Hydro |
Percentage field |
|
Solar |
Percentage field |
|
Wind |
Percentage field |
|
Other sources |
Percentage field |
| Scale of energy mix data reported above | Select from:
|
| Year data applies to | Numerical field |
Guidance
The goal of this question is to get a better understanding of the current energy mix of your electricity grid and the contribution made by renewable technologies at the region-wide scale. In the energy source field we have listed the most common sources of energy. If other sources of energy are relevant for your region, please specify them in the comments field. Please indicate the percentage of each energy source constituting your energy mix, where it is applicable. If the energy source is not applicable to your electric grid please enter 0.
Please ensure that the total percentage entered adds up to 100.
Example Response
| Energy source | Percent |
|---|---|
|
Coal |
20 |
|
Gas |
30 |
|
Oil |
0 |
|
Nuclear |
0 |
|
Biomass |
0 |
|
Geothermal |
0 |
|
Hydro |
40 |
|
Solar |
0 |
|
Wind |
10 |
|
Other sources |
0 |
| Scale of energy mix data reported above | Region-wide energy mix reported |
| Year data applies to | 2018 |
4. Strategy
Pathway diagram
This diagram shows the questions contained in this section. To access question-level guidance, use the menu on the left to navigate to the question.
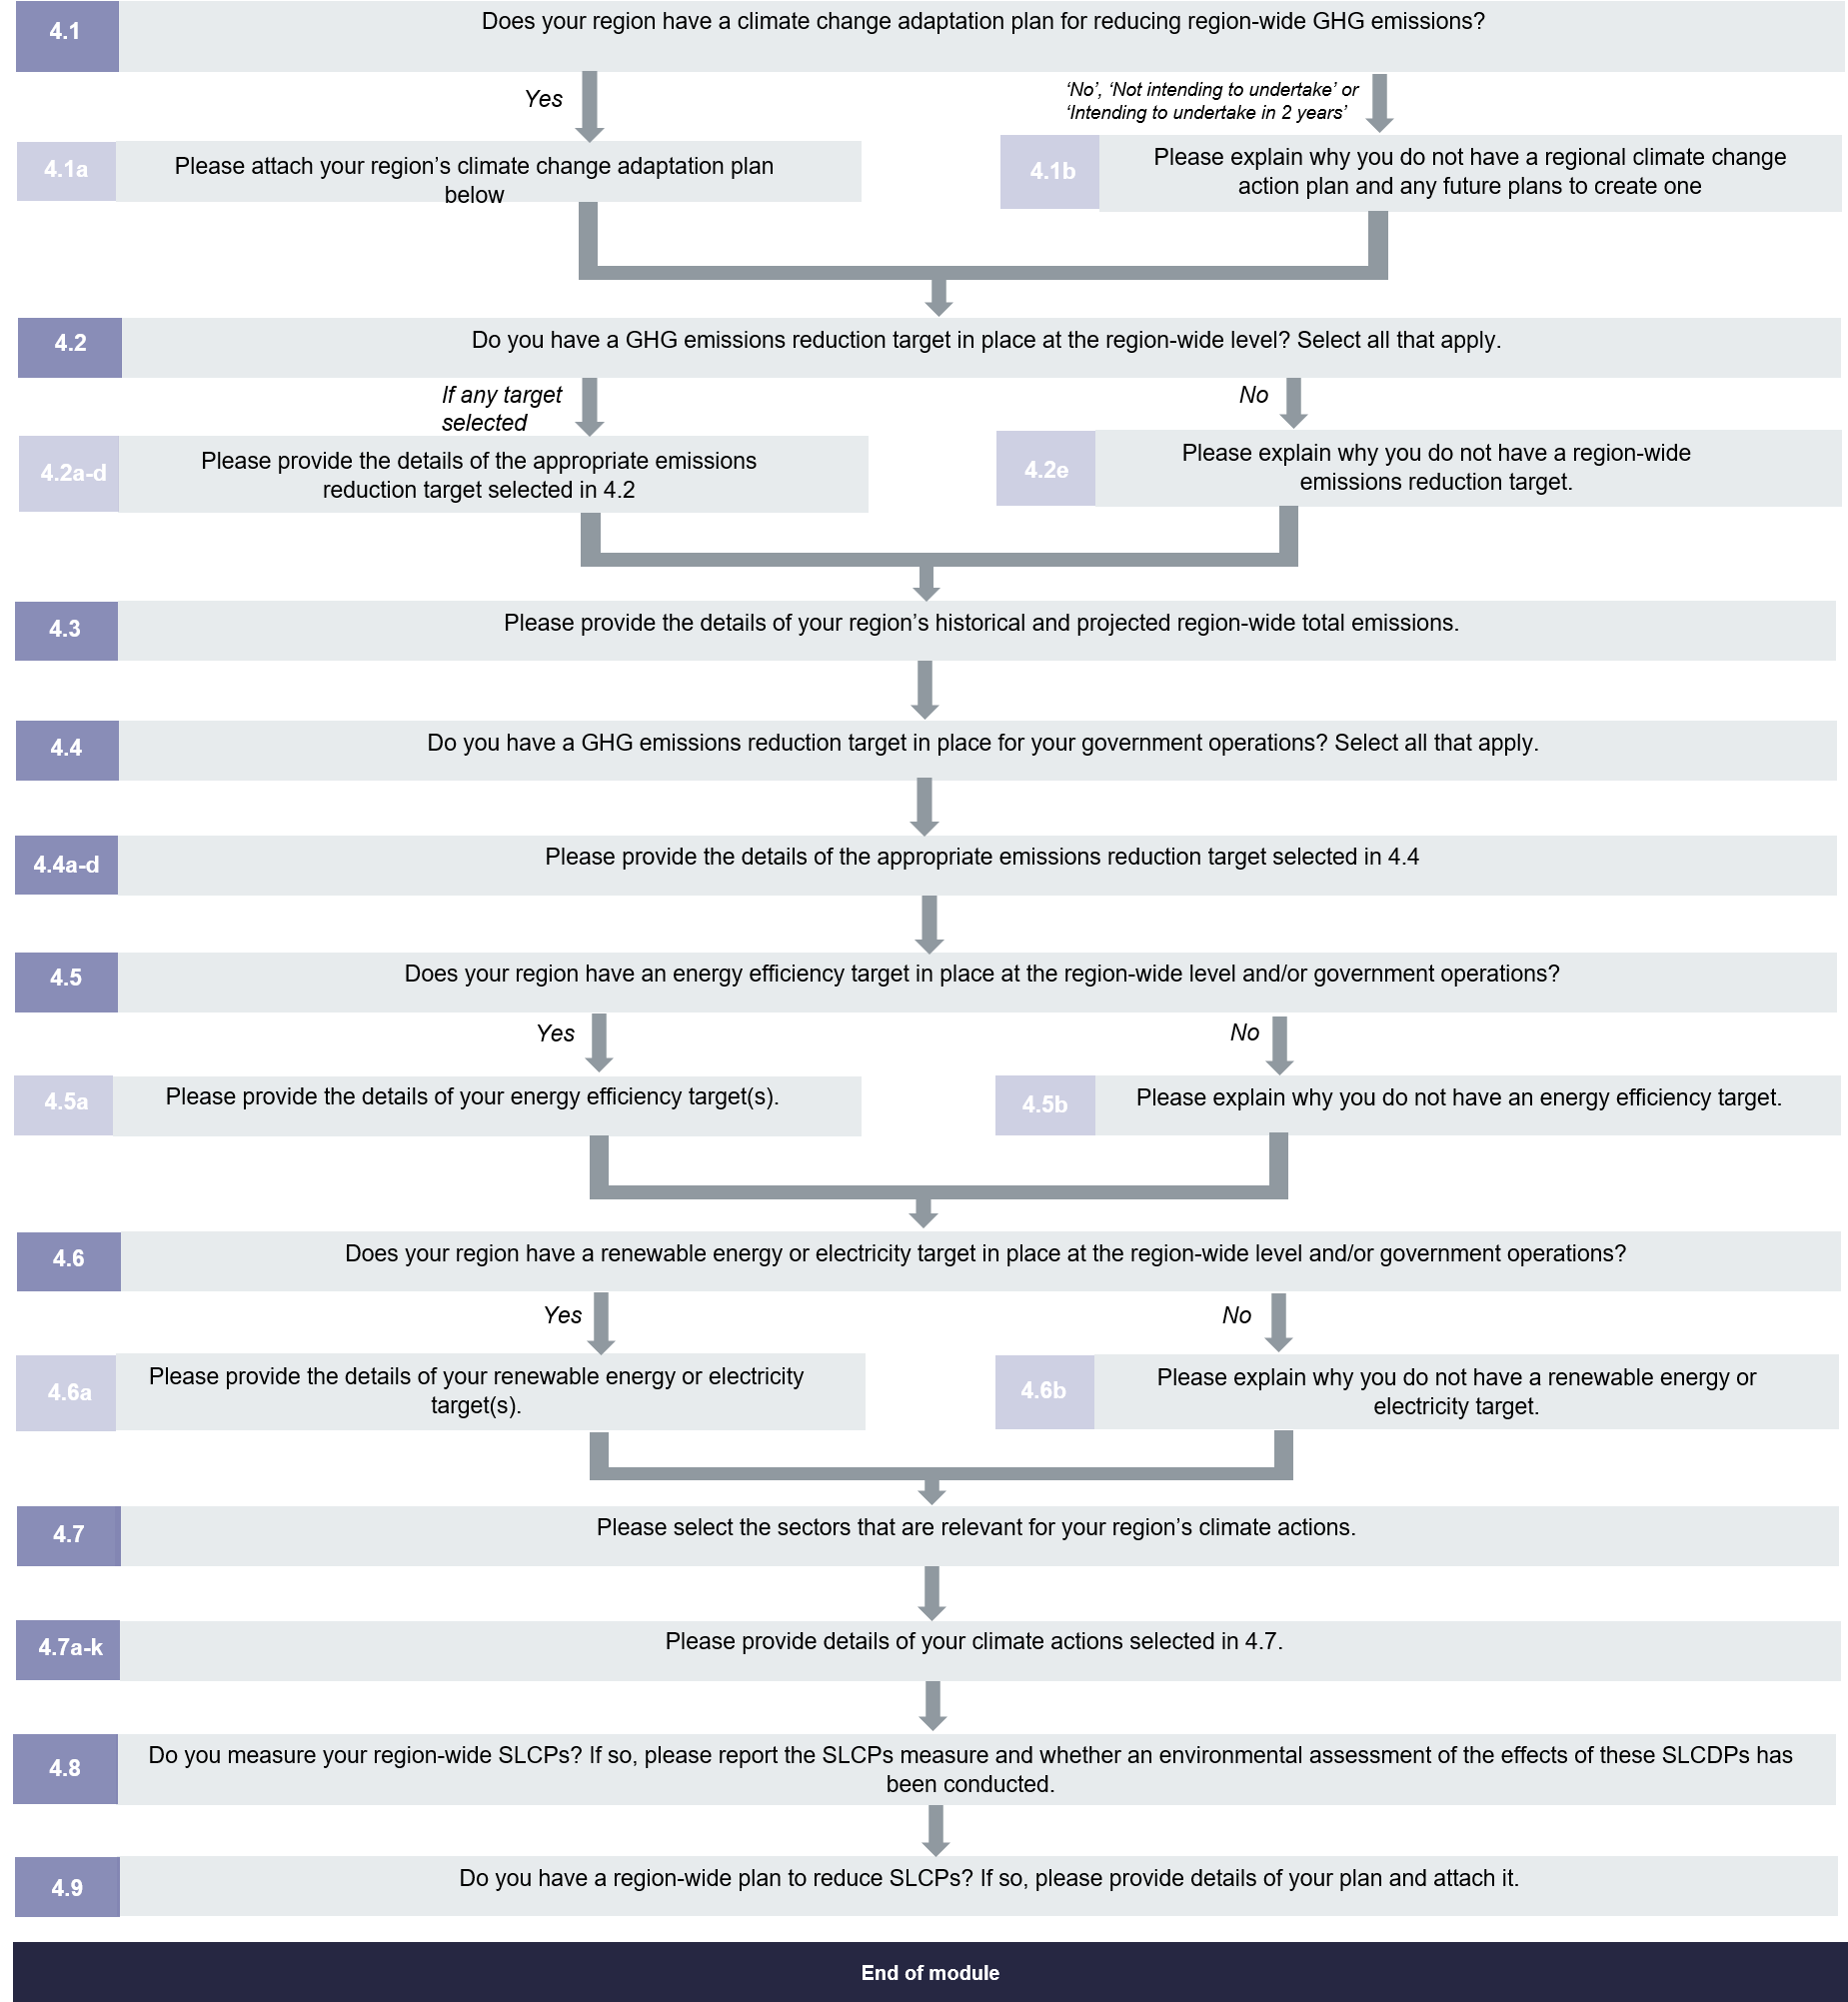
Emissions reduction – Region-wide
4.1 Does your region have a climate change action plan for reducing region-wide GHG emissions?
Change from 2020
No change
Response Options
Select one of the following options:
- Yes
- No
- In progress
- Intending to undertake in the next 2 years
- Not intending to undertake
- Do not know
Guidance
Please indicate whether your region has a climate change action plan by selecting “Yes”; “No”; “In progress”; “Intending to undertake in the next 2 years”; “Not intending to undertake”; or “Do not know” from the drop-down menu provided. If you select “Yes” you will be directed to question 4.1a. If you select “No”, “Not intending to undertake” or “Intending to undertake in the next 2 years” you will be directed to question 4.1b.
Explanation of term
- Climate action plans are comprehensive roadmaps that outline the specific activities that an agency will undertake to reduce greenhouse gas emissions. Climate action plans build upon the information gathered by greenhouse gas inventories and generally focus on those activities that can achieve the relatively greatest emission reductions in the most cost effective manner (Reference: Institute for Local Government).
4.1a Please attach your region's climate change action plan below.
Question dependencies
This question only appears if you select “Yes” in response to 4.1.
Change from 2020
No change
Response Options
Please complete the following table. You are able to add rows by using the “Add Row” button at the bottom of the table.
| Publication title | Year of publication | Attachment | Web link | Stage of implementation |
|---|---|---|---|---|
|
Text field |
Numerical field |
Attach your document here. |
Text field |
Select from:
|
Guidance
If you selected “Yes” in question 4.1, you will be asked to complete this table question to provide additional details about your climate action plan. Please note that if you have multiple climate change action plans, you can provide their information by adding a row when responding to this question. The table has the following fields:
- Publication title: State the official name of your region’s climate action plan.
- Year of publication: Enter the year the plan was published as a numeric value.
- Attachment: Please click the attachment icon to upload your climate change action plan.
- Web link: If it is available online, please provide a web link to the climate action plan.
- Stage of implementation: Indicate the extent to which your region has implemented its climate change action plan by selecting the most applicable response from the list in the table above. If the options do not indicate the stage of implementation of your region's climate change plan, please choose the "Other, please specify" option and specify the appropriate stage of implementation in the text field provided.
4.1b Please explain why you do not have a regional climate change action plan and any future plans to create one.
Question dependencies
This question only appears if you select “No", "Not intending to undertake", or "Intending to undertake in the next 2 years" in response to 4.1.
Change from 2020
No change
Response Options
Please complete the following table:
| Reason | Please explain |
|---|---|
|
Select from:
|
Text field |
Guidance
If you selected “No”, “Not intending to undertake”, or “Intending to undertake in the next 2 years” in question 4.1, you will be asked to complete this table question to explain the reasoning behind your response. The table has the following fields:
- Reason: Please select the most appropriate reason for your response from the options provided. If there is no applicable option, please select "Other, please specify" and specify the reason in the text box provided.
- Please explain: This field is for you to provide additional information to explain the reason selected in the context of your region.
4.2 Do you have a GHG emissions reduction target in place at the region-wide level? Select all that apply.
Change from 2020
No change
Response Options
Select all that apply:
- Base year emissions target
- Base year intensity target
- Baseline scenario (business as usual) target
- Fixed level target
- No target
Guidance
“Region-wide” includes the entire geographic area of the region while “Government operations” focuses on targets applied solely to your government operations. If you want to report your emissions reduction targets in place for your government operations, please see question 4.3. Please note that:
Please select all the relevant types of emissions reductions target that are in place within your region. Depending on the type of target you select, individual tables will appear allowing you to provide additional information about each of those target types. If you currently do not have emissions reduction targets, please select “No target” and you will be directed to question 4.2e where you will be given the opportunity to explain the reason behind your response.
Best practice:
It is considered good practice to set ambitious climate targets that encompass all of Kyoto greenhouse gases – carbon dioxide (CO2), methane (CH4), nitrous oxide (N2O), hydrofluorocarbons (HFCs), perfluorocarbons (PFCs), sulphur hexafluoride (SF6) and nitrogen trifluoride (NF3) – emitted by all IPCC sectors – Energy, Industry, Transport, Agriculture, Waste, and LULUCF.
Please make sure to reflect this in your response by specifying the sectors and gases covered by your total region-wide emissions in the comments field of the table for each type of target type selected. If you would like to report on your individual sector-specific emissions reduction targets, please select the sector in the sector field and specify the gases covered in the comments field.
Explanation of terms
- Base year emissions target: A reduction in greenhouse gas emissions (GHG) emissions relative to an emissions level in a historical base year (see GHG Protocol – Mitigation Goal Standard).
- Base year intensity target: A reduction in emissions intensity relative to an emissions intensity level in a historical base year. Emissions intensity is emissions per unit of output. Examples of units of output include GDP, population, and energy use (see GHG Protocol – Mitigation Goal Standard).
- Baseline scenario (business as usual) target: This target represents a reduction in emissions relative to a baseline scenario emissions level. They are typically framed in terms of a percent reduction of emissions from the baseline scenario, rather than an absolute reduction in emissions (see GHG Protocol – Mitigation Goal Standard).
- Fixed level target: An absolute reduction in emissions to a certain level by a target year, such as carbon neutrality (zero net emissions by a certain date) (Source: Dhakal and Ruth, 2017 - Creating Low Carbon Cities). Fixed-level goals include carbon neutrality goals, which are designed to reach zero net emissions by a certain date (see GHG Protocol – Mitigation Goal Standard).
4.2a Please provide the details of your region-wide base year emissions reduction target(s). You may add rows to provide the details of your sector-specific targets by selecting the relevant sector in the sector field.
Question dependencies
This question only appears if you select “Base year emissions target” in response to 4.2.
Change from 2020
No change
Response Options
Please complete the following table. The table is displayed over several rows for readability. You are able to add rows by using the “Add Row” button at the bottom of the table.
| Sector | Base year | Does this target account for carbon sinks? | Base year emissions (metric tonnes CO2e) | Percentage reduction target |
|---|---|---|---|---|
|
Select from:
|
Numerical field | Select from:
|
Numerical field |
Percentage field |
| Target year | Does this target align with a 1.5-2°C trajectory? | Has a decarbonisation pathway (s) been modelled for your target? | Pathway summary | Please describe the target | Please explain why your base year reported for this target is not the same as the base year reported in 3.7a. Only presented if different base years are reported |
|---|---|---|---|---|---|
Numerical field | Select from:
| Select from:
| Text field | Text field | Text field |
[Add Row]
Guidance
This question allows you to provide the details of your region-wide base year emissions reduction target. You can provide information on multiple targets by adding additional rows. Please try to complete all the relevant fields of this table. If you reported targets in last year's disclosure that are no longer active targets then please remove them from this year's response by clicking 'Delete' in the ORS on the inactive target. This is a table question with the following fields:
- Sector: If your target applies across your entire jurisdiction and covers multiple sectors, please select “Total region-wide emissions” in this field. If you want to provide details of your sector-specific targets, please select the relevant sector in this field.
- Base year: Please enter a numerical value for this field. Your base year is the reference year from which your greenhouse gas reductions are measured. Please ensure the base year corresponds to any emissions inventory you may have for the correct sector selected in the sector field.
- Does this target account for carbon sinks?: This is a new column in this year's questionnaire that explores if the target account for sinks - forest carbon removals, vegetation, and soils. This question helps us differentiate between the type of total emissions (i.e. gross or net emissions) the target refers to. If you select "Yes" for this question, then the accounting sinks refers to net emissions. If you select "No", then the target refers to gross emissions.
- Base year emissions (metric tonnes CO2e): Please enter the numerical value for the emissions in your base year, without commas. Your base emissions are the greenhouse gas emissions from your base year on which your target is based. Please ensure the base year emissions pertain to the total emissions inventory if “Total region-wide emissions” is selected in the sector field. If you are reporting a target for a specific sector of your region-wide emissions inventory, please provide the base year emissions for that sector. Please ensure that the base year emissions correspond with the base year reported.
- Percentage reduction target: Please enter the numerical value of your percentage reduction target, without commas and without the percentage symbol (%). If your target is not currently expressed as a percentage, please convert it into this format (for example an absolute emissions reduction in metric tonnes CO2e can be converted into a percentage reduction relative to the base year). If this is not possible, please note your target reduction and other relevant detail in the ‘Please describe the target’ field for this question.
- Target year: Please enter in numerical form the year by which you anticipate achieving your goal. Please note that the target year cannot be in the past.
- Percentage of target achieved: Please enter a numerical value for the percentage of your emissions reduction target that you have achieved since the “Target year start”, without commas and without the percentage symbol (%).
- Does this target align with a 1.5-2°C trajectory?: This is a new column in this year’s questionnaire that explores if and how regions are aligning their targets with a 1.5-2°C trajectory as outlined in the Paris Agreement. If your target aligns with a 1.5-2°C trajectory then please select either "Yes - 1.5°C" or "Yes - 2°C" and explain how your target aligns with this trajectory and any methodologies used to determine this alignment in the column "Please describe the target". If your target does not align with any of these trajectories then select "No" or if you are unsure whether your target aligns with these trajectories then select "Don't know".
- Has a decarbonisation pathway(s) been modelled for your target: Please detail whether or not a decarbonisation pathway has been modelled for your target by selecting: “Yes”, “No” or “Informal”. Please use informal if you have a decarbonisation pathway modelled but has not been officially verified. Decarbonisation pathways are the different options and strategies in place to meet their emissions reduction targets provides crucial information about how GHG reduction targets can be met, which considers the trade-offs that will have to be made.
- Pathway summary: Please provide a summary of your decarbonisation pathway. A decarbonization pathway or pathway starts with a government’s long-term greenhouse gas (GHG) reduction goal, and then works backwards to identify the technologies, infrastructure and investments that will be required to achieve it. In collaboration with government agencies, the process helps policymakers set intermediate milestones that must be achieved to reach the long-term decarbonization vision, and better understand the costs, risks, trade-offs and co-benefits associated with different policy approaches. The result is a series of tailored options that explore the potential pace at which emission reductions can be achieved, and their social and economic implications within the jurisdiction.
- Please describe the target: Please provide any other contextualizing information about your reduction target in this field including but not limited to:
Short target summary: Please include your short target summary in this field. Examples of short target summaries are presented below for total region-wide emissions and sectoral targets respectively.
Sectors covered: If you selected “Total region-wide emissions” in the sector field, please outline the relevant ones covered by your target in this field.
Gases covered: Please specify all the relevant Kyoto GHGs (CO2, CH4, N2O, HFCs, PFCs and SF6) covered by your emissions target.
Web link of target: If there is additional information regarding your target on your regions website, then please provide the web link in this field.
NDC: You may describe how your region’s target compares to your national governments Nationally Determined Contribution (NDC), describing for example if this target more ambitious than the NDC in terms of GHG emissions reduction and why.
Examples of target summaries
For additional information on base year emissions reduction targets, below are examples of targets that cover both total region-wide and individual sectors.
| Sector | States and regions | Example | Minimum inventory needs |
|---|---|---|---|
|
Total region-wide emissions |
Quebec |
Reduce region-wide CO2e emissions by 37,5% by 2030 based on a 1990 baseline |
Inventory for 1990 and 2030 |
|
Total region-wide emissions |
Thuringia |
Reduce region-wide CO2e emissions by 70% by 2030 based on 1990 levels |
Inventory for 1990 and for 2030 |
|
Total region-wide emissions |
North Rhine-Westphalia |
Reduce the emissions of greenhouse gases (GHG) by at least 80 % by 2050 below 1990 levels |
Inventory for 1990 and 2050 |
| Transport | New Caledonia | Reduce region-wide GHG emissions from the transport sector by 15% by 2030 based on 2014 levels | Inventory for 2014 and 2030 |
| Energy | Alberta | Reduce CO2 emissions of the greenhouses for 45% by 2025 based on 2014 levels | Inventory for 2014 and 2025 |
| Agriculture | Navarra | Reduce CO2 emissions of the greenhouses for 40% by 2030 based on 2005 levels | Inventory for 2005 and 2030 |
Example Response
| Sector | Base year | Does this target account for carbon sinks? | Base year emissions (metric tonnes CO2e) | Percentage reduction target | Target year |
|---|---|---|---|---|---|
|
Total region-wide emissions |
1990 | No |
250000000 |
100 |
2050 |
|
Industry |
1990 | No |
80000000 |
100 |
2050 |
| Does this target align with a 1.5-2°C trajectory? | Has a decarbonisation pathway(s) been modelled for your target? | Pathway summary | Please describe the target |
|---|---|---|---|
| Yes |
Yes |
Pathway developed using Energy PATHWAYS model. Three pathways developed for the regions energy system which focused on electrification, renewable energy and innovation. This work shows that the state can achieve deep emission reductions using a variety of technologies and approaches. |
Reduce region-wide emissions for all 2006 IPCC sectors by 100% based on 1990 levels. This target covers CO2, methane and HFCs. |
| No |
No |
N/A |
Reduce region-wide emissions for the industry sector by 100% based on 1990 levels. This target covers CO2 and methane. |
4.2b Please provide the details of your region-wide base year intensity target(s). An intensity target is usually measured per capita or per unit GDP. You may add rows to provide the details of your sector-specific targets by selecting the relevant sector in the sector field.
Question dependencies
This question only appears if you select “Base year intensity target" in response to 4.2.
Change from 2020
No change
Response Options
Please complete the following table. The table is displayed over several rows for readability. You are able to add rows by using the “Add Row” button at the bottom of the table.
| Sector | Does this target account for carbon sinks? | Intensity unit (Emissions per) | Base year | Population/GDP/Intensity Metric in Base Year Dependent on intensity unit selected | Total base year emissions (metric tonnes CO2e) | Base year emissions per intensity unit (metric tonnes CO2e per denominator) |
|---|---|---|---|---|---|---|
|
Select from:
| Select from:
|
Select from:
|
Numerical field | Numerical field | Numerical field |
Numerical field |
| Percentage reduction target in emissions intensity | Target year | Does this target align with a 1.5-2°C trajectory? | Has a decarbonisation pathway(s) been modelled for your target? | Pathway summary | Please describe the target | Please explain why your base year reported for this target is not the same as the base year reported in 3.7a. Only presented if different base years are reported |
|---|---|---|---|---|---|---|
Percentage field | Numerical field | Select from:
| Select from:
| Text field | Text field | Text field |
[Add Row]
Guidance
This question allows you to provide the details of your region-wide base year intensity target. You can provide information on multiple targets by adding additional rows. Please try to complete all the relevant fields of this table. If you reported targets in last year's disclosure that are no longer active targets then please remove them from this year's response by clicking 'Delete' in the ORS on the inactive target. This is a table question with the following fields:
- Sector: If your target applies across your entire jurisdiction and covers multiple sectors, please select “Total region-wide emissions” in this field. If you want to provide details of your sector-specific targets, please select the relevant sector in this field.
- Does this target account for carbon sinks?: This is a new column in this year's questionnaire that explores if the target account for sinks - forest carbon removals, vegetation and soils. This question helps us differentiate between the type of total emissions (i.e. gross or net emissions) the target refers to. If you select "Yes" for this question, then the accounting of sinks refers to net emissions. If you select "No", then the target refers to gross emissions.
- Intensity unit (Emissions per): Please define the variable used in your region’s intensity target by selecting the relevant variable from the drop-down options (either metric tonnes CO2e per capita, or metric tonnes CO2e per GDP). If your region uses a variable, which is not listed, please select “Other, please specify” and define the variable in the text field provided. Emissions intensity refers to emissions per unit of another variable, which is typically economic output, such as GDP, but may also be population, energy use, or a different variable.
- Base year: Please enter a numerical value for this field. Your base year is the reference year from which your greenhouse gas reductions are measured. Please ensure the base year corresponds to any emissions inventory you may have for the correct sector selected in the sector field.
- Population/GDP/Intensity Metric in Base Year: Please report the base year value of the variable used in your region’s intensity target. For example, this could be the total population or GDP in the base year.
- Total base year emissions (metric tonnes CO2e): Please enter the numerical value for the emissions in your base year, without commas. Your base emissions are the greenhouse gas emissions from your base year on which your target is based. Please ensure the base year emissions pertain to the total emissions inventory if “Total region-wide emissions” is selected in the sector field. If you are reporting a target for a specific sector of your region-wide emissions inventory, please provide the base year emissions for that sector. Please ensure that the base year emissions correspond with the base year reported.
- Base year emissions per intensity unit (metric tonnes CO2e per denominator): Please enter the numerical value of your base year emissions per intensity unit, without commas. Your base year emissions are the greenhouse gas emissions from your base year on which your target is based. Please ensure the base year emissions correspond to the total emissions inventory if "Total region-wide emissions" is selected in the sector field. If you are reporting a target for a specific sector of your region-wide emissions inventory, please provide the base year emissions for that sector. Please ensure that the base year emissions correspond with the base year reported.
- Percentage reduction target in emissions intensity: Please enter the numerical value of your percentage reduction target, without commas and without the percentage symbol (%). If your target is not currently expressed as a percentage, please convert it into this format (for example an emissions reduction in metric tonnes CO2e per intensity metric can be converted into a percentage reduction relative to the base year). If this is not possible, please note your target reduction and other relevant detail in the Comment field for this question.
- Target year: Please enter in numerical form the year by which you anticipate achieving your goal. Please note that the target year cannot be in the past.
- Does this target align with a 1.5-2°C trajectory?: This is a new column in this year’s questionnaire that explores if and how regions are aligning their targets with a 1.5-2°C trajectory as outlined in the Paris Agreement. If your target aligns with a 1.5-2°C trajectory then please select either "Yes - 1.5°C" or "Yes - 2°C" and explain how your target aligns with this trajectory and any methodologies used to determine this alignment in the column "Please describe the target". If your target does not align with any of these trajectories then select "No" or if you are unsure whether your target aligns with these trajectories then select "Don't know".
- Has a decarbonisation pathway(s) been modelled for your target: Please detail whether or not a decarbonisation pathway has been modelled for your target by selecting: “Yes”, “No” or “Informal”. Please use informal if you have a decarbonisation pathway modelled but has not been officially verified. Decarbonisation pathways are the different options and strategies in place to meet your emissions reduction targets, which provides crucial information about how GHG reduction targets can be met and considers the trade-offs that will have to be made.
- Pathway summary: Please provide a summary of your decarbonisation pathway. A decarbonization pathway or pathway starts with a government’s long-term greenhouse gas (GHG) reduction goal, and then works backwards to identify the technologies, infrastructure and investments that will be required to achieve it. In collaboration with government agencies, the process helps policymakers set intermediate milestones that must be achieved to reach the long-term decarbonization vision, and better understand the costs, risks, trade-offs and co-benefits associated with different policy approaches. The result is a series of tailored options that explore the potential pace at which emission reductions can be achieved, and their social and economic implications within the jurisdiction.
- Please describe the target: Please provide any other contextualizing information about your reduction target in this field including but not limited to:
Short target summary: Please include your short target summary in this field. Examples of short target summaries are presented below for total region-wide emissions and sectoral targets respectively.
Sectors covered: If you selected “Total region-wide emissions” in the sector field, please outline the relevant ones covered by your target in this field.
Gases covered: Please specify all the relevant Kyoto GHGs (CO2, CH4, N2O, HFCs, PFCs and SF6) covered by your emissions target.
Web link of target: If there is additional information regarding your target on your regions website, then please provide the web link in this field.
NDC: You may describe how your region’s target compares to your national governments Nationally Determined Contribution (NDC), describing for example if this target more ambitious than the NDC in terms of GHG emissions reduction and why.
Examples of target summaries
For additional information on base year intensity targets, below are examples of targets that cover both total region-wide and individual sectors.
| Sector | States and regions | Goal type | Example | Minimum inventory needs |
|---|---|---|---|---|
|
Total region-wide emissions |
Upper Austria |
Per emissions goal |
Reduce intensity of region-wide CO2e emissions by 70-90% by 2050 based on 2014 levels |
Inventory for 2014 and 2050 |
|
Total region-wide emissions |
Rio de Janeiro |
Per capita goal |
Reduce intensity of region-wide emissions to 0.13 tons CO2e by 2030 from 2005 levels |
Inventory for 2005 and 2030 |
|
Total region-wide emissions |
Gujarat |
Per emissions goal |
Reduce the emissions intensity of GHG by 33-35% by 2030 based on 2005 levels |
Inventory for 2005 and 2030 |
| Transport | Rio de Janeiro | Other | In 2030, the state-wide transport GHG emissions shall be 30% lower than that of 2010. Emissions from this source increased 32.3% between 2010 and 2015 | Inventory for 2010 and 2030 |
Example Response
| Sector | Does this target account for carbon sinks? | Intensity unit (Emissions per) | Base year | Population/GDP/Intensity Metric in Base Year Dependent on intensity unit selected |
Base year emissions (metric tonnes CO2e) | Base year emissions per intensity unit (metric tonnes CO2e per denominator) | Percentage reduction target in emissions intensity |
|---|---|---|---|---|---|---|---|
|
Total region-wide emissions | No |
Metric tonnes of CO2e per capita |
2002 | 1000000 | 2000000 |
2 | 15 |
|
Industry | No |
Metric tonnes of CO2e per capita |
2010 | 550570 | 550570 |
1 | 30 |
| Target year | Does this target align with a 1.5-2°C trajectory? |
Has a decarbonisation pathway(s) been modelled for your target? | Pathway summary | Please describe the target |
|---|---|---|---|---|
|
2050 |
Yes |
No | N/A |
The target is for a 15% reduction on per capita emissions from 2002 by 2050. This target covers all 2006 IPCC sectors and all Kyoto GHGs. |
|
2030 |
No |
Informal | The state is in the process of developing a pathway to achieve deep decarbonization of the energy system. We have taken the first step in analyzing the technical and economic feasibility in order to provide a basic vision for decarbonization for the state. |
The target ifs for a 30% reduction on per capita emissions from 2010 by 2050. This target covers all Kyoto GHGs. |
4.2c Please provide the details of your region-wide baseline scenario target(s), including projected business as usual emissions. You may add rows to provide the details of your sector-specific targets by selecting the relevant sector in the sector field.
Question dependencies
This question only appears if you select “Baseline scenario (business as usual) target” in response to 4.2.
Change from 2020
No change
Response Options
Please complete the following table. The table is displayed over several rows for readability. You are able to add rows by using the “Add Row” button at the bottom of the table.
| Sector | Does this target account for carbon sinks? | Base year | Base year emissions (metric tonnes CO2e) | Target year |
|---|---|---|---|---|
|
Select from:
| Select from:
|
Numerical field |
Numerical field |
Numerical field |
| Estimated business as usual absolute emissions in target year (metric tonnes CO2e) | Percentage reduction target from business as usual | Does this target align with a 1.5-2°C trajectory? | Has a decarbonisation pathway(s) been modelled for your target? | Pathway summary | Please describe the target | Please explain why your base year reported for this target is not the same as the base year reported in 3.7a. Only presented if different base years are reported |
|---|---|---|---|---|---|---|
Numerical field | Percentage field | Select from:
| Select from:
| Text field | Text field | Text field |
[Add Row]
Guidance
This question allows you to provide the details of your region-wide baseline scenario (business as usual) target. You can provide information on multiple targets by adding additional rows. Please try to complete all the relevant fields of this table. If you reported targets in last year's disclosure that are no longer active targets then please remove them from this year's response by clicking 'Delete' in the ORS on the inactive target.This is a table question with the following fields:
- Sector: If your target applies across your entire jurisdiction and covers multiple sectors, please select “Total region-wide emissions” in this field. If you want to provide details of your sector-specific targets, please select the relevant sector in this field.
- Does this target account for carbon sinks?: This column requests you to report if the target account for sinks - forest carbon removals, vegetation and soils. This question helps us differentiate between the type of total emissions (i.e. gross or net emissions) the target refers to. If you select "Yes" for this question, then the accounting of sinks refers to net emissions. If you select "No", then the target refers to gross emissions.
- Base year: Please enter a numerical value for this field. Your base year is the reference year from which your greenhouse gas reductions are measured. Please ensure the base year corresponds to any emissions inventory you may have for the correct sector selected in the sector field.
- Base year emissions (metric tonnes CO2e): Please enter the numerical value for the emissions in your base year, without commas. Your base emissions are the greenhouse gas emissions from your base year on which your target is based. Please ensure the base year emissions pertain to the total emissions inventory if “Total region-wide emissions” is selected in the sector field. If you are reporting a target for a specific sector of your region-wide emissions inventory, please provide the base year emissions for that sector. Please ensure that the base year emissions correspond with the base year reported.
- Target year: Please enter in numerical form the year by which you anticipate achieving your goal. Please note that the target year cannot be in the past.
- Estimated business as usual absolute emissions in target year (metric tonnes CO2e): Please indicate the estimated business as usual emissions figure in the target year. A baseline scenario is a reference case that represents the events or conditions most likely to occur in the absence of activities taken to meet a mitigation target.
- Percentage reduction target from business as usual: Please enter the percentage reduction relative to your region’s baseline scenario emissions. This should not include commas or the percentage symbol (%)
- Does this target align with a 1.5-2°C trajectory?: This is a new column in this year’s questionnaire that explores if and how regions are aligning their targets with a 1.5-2°C trajectory as outlined in the Paris Agreement. If your target aligns with a 1.5-2°C trajectory then please select either "Yes - 1.5°C" or "Yes - 2°C" and explain how your target aligns with this trajectory and any methodologies used to determine this alignment in the column "Please describe the target". If your target does not align with any of these trajectories then select "No" or if you are unsure whether your target aligns with these trajectories then select "Don't know".
- Has a decarbonisation pathway(s) been modelled for your target: Please detail whether or not a decarbonisation pathway has been modelled for your target by selecting: “Yes”, “No” or “Informal”. Please use informal if you have a decarbonisation pathway modelled but has not been officially verified. Decarbonisation pathways are the different options and strategies in place to meet your emissions reduction targets, which provides crucial information about how GHG reduction targets can be met and considers the trade-offs that will have to be made.
- Pathway summary: Please provide a summary of your decarbonisation pathway. A decarbonization pathway or pathway starts with a government’s long-term greenhouse gas (GHG) reduction goal, and then works backwards to identify the technologies, infrastructure and investments that will be required to achieve it. In collaboration with government agencies, the process helps policymakers set intermediate milestones that must be achieved to reach the long-term decarbonization vision, and better understand the costs, risks, trade-offs and co-benefits associated with different policy approaches. The result is a series of tailored options that explore the potential pace at which emission reductions can be achieved, and their social and economic implications within the jurisdiction.
- Please describe the target: Please provide any other contextualizing information about your reduction target in this field including but not limited to:
Short target summary: Please include your short target summary in this field. Examples of short target summaries are presented below for total region-wide emissions and sectoral targets respectively.
Sectors covered: If you selected “Total region-wide emissions” in the sector field, please outline the relevant ones covered by your target in this field.
Gases covered: Please specify all the relevant Kyoto GHGs (CO2, CH4, N2O, HFCs, PFCs and SF6) covered by your emissions target.
Web link of target: If there is additional information regarding your target on your regions website, then please provide the web link in this field.
NDC: You may describe how your region’s target compares to your national governments Nationally Determined Contribution (NDC), describing for example if this target more ambitious than the NDC in terms of GHG emissions reduction and why.
Examples of target summaries
For additional information on baseline scenario targets, below are examples of targets that cover both total region-wide and individual sectors.
| Sector | States and regions | Example | Minimum inventory needs |
|---|---|---|---|
|
Total region-wide emissions |
Azores |
Reduce region-wide emissions by 38% in 2030 compared to business-as-usual (BUA) scenario. |
Inventory for 2014 (BUA) and 2030 |
Example Response
| Sector | Does this target account for carbon sinks? | Base year | Base year emissions (metric tonnes CO2e) | Target year | Estimated business as usual absolute emissions in target year (metric tonnes CO2e) |
|---|---|---|---|---|---|
|
Total region-wide emissions |
No |
2005 |
740000000 |
2025 | 790000000 |
|
Transportation |
No |
2002 |
48000000 |
2030 | 38000000 |
| Percentage reduction target from business as usual | Does this target align with a 1.5-2°C trajectory? | Has a decarbonisation pathway(s) been modelled for your target? | Pathway summary | Please describe the target |
|---|---|---|---|---|
20 | Yes | Yes | The decarbonisation pathway that has been modelled for this target outlines that energy demand reductions are needed. In addition also required is investment in energy-efficient and low-carbon technologies. Passenger cars will need to be predominately electric. | Reduce region-wide emissions by 20% in 2025 compared to a BAU scenario. This target covers Energy, Transport and Industry sectors as well as all Kyoto GHGs. |
10 | No | No | N/A | Reduce region-wide emissions by 10% in 2030 compared to a BAU scenario for the Transport sector. This target only covers CO2. |
4.2d Please provide the details of your region-wide fixed level target(s). Fixed level targets are not expressed relative to either a historical base year or a projected baseline scenario. You may add rows to provide the details of your sector-specific targets by selecting the relevant sector in the sector field.
Question dependencies
This question only appears if you select “Fixed level target” in response to 4.2.
Change from 2020
No change
Response Options
Please complete the following table. The table is displayed over several rows for readability. You are able to add rows by using the “Add Row” button at the bottom of the table.
| Sector | Carbon neutrality target? | Target year | If 'No' selected in Carbon neutrality target: Target year absolute emissions (metric tonnes CO2e) |
|---|---|---|---|
|
Select from:
|
Select from:
|
Numerical field | Numerical field |
| If 'No' selected in Carbon neutrality target:Does this target account for carbon sinks? | Does this target align with a 1.5-2°C trajectory? | Has a decarbonisation pathway(s) been modelled for your target? | Pathway summary | Please describe the target |
|---|---|---|---|---|
Select from:
| Select from:
| Select from:
| Text field | Text field |
[Add Row]
Guidance
This question allows you to provide the details of your region-wide fixed level target. You can provide information on multiple targets by adding additional rows. Please try to complete all the relevant fields of this table. If you reported targets in last year's disclosure that are no longer active targets then please remove them from this year's response by clicking 'Delete' in the ORS on the inactive target. This is a table question with the following fields:
- Sector: If your target applies across your entire jurisdiction and covers multiple sectors, please select “Total region-wide emissions” in this field. If you want to provide details of your sector-specific targets, please select the relevant sector in this field.
- Carbon neutrality target?: Select "Yes" if this target aims to reduce region-wide or sector CO2e emissions to net zero by the target year. If not then select ‘No’, you will then be asked to report your target year absolute emissions in metric tonnes CO2e.
- Target year: Please enter in numerical form the year by which you anticipate achieving your goal. Please note that the target year cannot be in the past.
- Target year absolute emissions (metric tonnes CO2e): Please complete this column if "No" is selected in the column “Carbon neutrality target?”. This figure is the estimated absolute emissions in metric tonnes CO2e in the target year.
- Does this target account for carbon sinks?: This is a new column in this year's questionnaire that explores if the target account for sinks - forest carbon removals, vegetation and soils. This question helps us differentiate between the type of total emissions (i.e. gross or net emissions) the target refers to. If you select "Yes" for this question, then the accounting of sinks refers to net emissions. If you select "No", then the target refers to gross emissions.
- Does this target align with a 1.5-2°C trajectory?: This is a new column in this year’s questionnaire that explores if and how regions are aligning their targets with a 1.5-2°C trajectory as outlined in the Paris Agreement. If your target aligns with a 1.5-2°C trajectory then please select either "Yes - 1.5°C" or "Yes - 2°C" and explain how your target aligns with this trajectory and any methodologies used to determine this alignment in the column "Please describe the target". If your target does not align with any of these trajectories then select "No" or if you are unsure whether your target aligns with these trajectories then select "Don't know".
- Has a decarbonisation pathway(s) been modelled for your target: Please detail whether or not a decarbonisation pathway has been modelled for your target by selecting: “Yes”, “No” or “Informal”. Please use informal if you have a decarbonisation pathway modelled but has not been officially verified. Decarbonisation pathways are the different options and strategies in place to meet your emissions reduction targets, which provides crucial information about how GHG reduction targets can be met and considers the trade-offs that will have to be made.
- Pathway summary: Please provide a summary of your decarbonisation pathway. A decarbonization pathway or pathway starts with a government’s long-term greenhouse gas (GHG) reduction goal, and then works backwards to identify the technologies, infrastructure and investments that will be required to achieve it. In collaboration with government agencies, the process helps policymakers set intermediate milestones that must be achieved to reach the long-term decarbonization vision, and better understand the costs, risks, trade-offs and co-benefits associated with different policy approaches. The result is a series of tailored options that explore the potential pace at which emission reductions can be achieved, and their social and economic implications within the jurisdiction.
- Please describe the target: Please provide any other contextualizing information about your reduction target in this field including but not limited to:
Short target summary: Please include your short target summary in this field. Examples of short target summaries are presented below for total region-wide emissions and sectoral targets respectively.
Sectors covered: If you selected “Total region-wide emissions” in the sector field, please outline the relevant ones covered by your target in this field.
Gases covered: Please specify all the relevant Kyoto GHGs (CO2, CH4, N2O, HFCs, PFCs and SF6) covered by your emissions target.
Web link of target: If there is additional information regarding your target on your regions website, then please provide the web link in this field.
NDC: You may describe how your region’s target compares to your national governments Nationally Determined Contribution (NDC), describing for example if this target more ambitious than the NDC in terms of GHG emissions reduction and why.
Examples of target summaries
For additional information on baseline scenario targets, below are examples of targets that cover both total region-wide and individual sectors.
| Sector | States and regions | Example | Minimum inventory needs |
|---|---|---|---|
|
Total region-wide emissions |
Galicia |
Reduce GHG emissions to achieve zero net emissions by 2050 |
Inventory for 2050 |
|
Total region-wide emissions |
Washington |
Aim to reduce emissions to 1990 levels by 2050 |
Inventory for 1990 and 2050 |
|
Total region-wide emissions |
Bavaria |
Reduce GHG emissions to under 4 tonnes of CO2e per capita by 2030 |
Inventory for 2030 |
Example Response
| Sector | Carbon neutrality target? | Target year | Does this target account for carbon sinks? | Does this target align with a 1.5-2°C trajectory? | Has a decarbonisation pathway(s) been modelled for your target? | Pathway summary | Please describe the target |
|---|---|---|---|---|---|---|---|
|
Total region-wide emissions |
Yes |
2050 | No | Yes |
No | N/A |
To reduce state-wide CO2-e emissions to net zero by 2050 and covers all 2006 IPCC sectors as well as all Kyoto GHGs |
|
Energy |
Yes |
2040 | No | Yes |
Yes | The decarbonisation pathway modelled incorporates energy efficiency and low-carbon technology and infrastructure, including low-carbon electricity which is primarily provided by solar and wind resources, while natural gas generation continues to provide energy when solar and wind are not available until the year 2040 when energy storage is expected to contribute in meeting demand during these periods. |
No emissions from energy generation by 2040. This target covers only CO2 emissions. |
4.2e Please explain why you do not have a region-wide emissions reduction target and any plans to set one in the future.
Question dependencies
This question only appears if you select “No target” in response to 4.2.
Change from 2020
No change
Response Options
Please complete the following table:
| Reason | Please explain |
|---|---|
|
Select from
|
Text field |
Guidance
Please give more details on why you do not have a region-wide target by selecting the most suitable option from the drop-down options provided in the “Reason” field and give an explanation in the context of your region. Select “Other, please specify” if you have a different reason that best explains your region’s lack of emissions reduction target and specify it in the text field provided.
4.3 Please provide the details of your region's historical and projected region-wide total emissions.
Change from 2020
No change
Response Options
Please complete the following table:
| Scenario | Region’s total emissions in year 2010 | Region's total medium-term projected emissions | Region’s medium-term projected emissions year (2021-2030) | Region’s total long-term projected emissions | Region's long-term projected emissions year (2031-2050) | Emission type of historical and projected emissions reported | Comment |
|---|---|---|---|---|---|---|---|
Reported Policies Scenario (effect of reported policies and targets are included) |
Numerical field | Numerical field |
Select from: 2021-2030 Default value is 2030 |
Numerical field | Select from: 2031-2050 Default value is 2050 | Select from:
|
Text field |
BAU Scenario (effect of reported policies and targets are excluded) | Numerical field | Numerical field | Select from: 2021-2030 Default value is 2030 |
Numerical field | Select from: 2031-2050 Default value is 2050 | Select from:
|
Text field |
Guidance
This question asks states and regions to report their historical emissions and future projected region-wide emissions. The information reported for this question will help better understand how a state/region’s region-wide emissions will change over time.
The projections for the Reported Policies Scenario should include the impact of the reported emission reduction policies and targets in your response. For example, if your region has reported a net-zero emission target for the year 2050 then for the Reported Policies Scenario you will report 0 in the field "Region's total long-term projected emissions", 2050 in the field "Region's long-term projected population year" and Net emissions in the field "Emission type of projected emissions". The projections for the BAU (business as usual) Scenario do not include the impact of the reported emission policies and targets in your response and can be considered a business as usual scenario.
Emissions reduction – Government operations
4.4 Do you have a GHG emissions reduction target in place for your government operations?
Change from 2020
No change
Response Options
Select all that apply:
- Base year emissions target
- Base year intensity target
- Baseline scenario (business as usual) target
- Fixed level target
- No target in place for government operations
Guidance
Please select all the relevant types of emissions reductions target that are in place for your government’s operations. Depending on the type of target you select, individual tables will appear allowing you to provide additional information about each of those target types.
Best practice:
It is considered good practice to set ambitious climate targets that encompass all of Kyoto greenhouse gases – carbon dioxide (CO2), methane (CH4), nitrous oxide (N2O), hydrofluorocarbons (HFCs), perfluorocarbons (PFCs), sulphur hexafluoride (SF6) and nitrogen trifluoride (NF3) – emitted by all IPCC sectors – Energy, Industry, Transport, Agriculture, Waste, and LULUCF.
Please make sure to reflect this in your response by specifying the sectors and gases covered by your government operations target in the comments field of the table for each type of target type selected. If you would like to report on your individual sector-specific emissions reduction targets, please select the sector in the sector field and specify the gases covered in the comments section.
Explanation of terms
- Base year emissions target: A reduction in greenhouse gas emissions (GHG) emissions relative to an emissions level in a historical base year (see GHG Protocol – Mitigation Goal Standard).
- Base year intensity target: A reduction in emissions intensity relative to an emissions intensity level in a historical base year. Emissions intensity is emissions per unit of output. Examples of units of output include GDP, population, and energy use (see GHG Protocol – Mitigation Goal Standard).
- Baseline scenario (business as usual) target: This target represents a reduction in emissions relative to a baseline scenario emissions level. They are typically framed in terms of a percent reduction of emissions from the baseline scenario, rather than an absolute reduction in emissions (see GHG Protocol – Mitigation Goal Standard).
- Fixed level target: An absolute reduction in emissions to a certain level by a target year, such as carbon neutrality (zero net emissions by a certain date) (Source: Dhakal and Ruth, 2017 - Creating Low Carbon Cities). Fixed-level goals include carbon neutrality goals, which are designed to reach zero net emissions by a certain date (see GHG Protocol – Mitigation Goal Standard).
4.4a Please provide the details of your base year emissions reduction target(s). You may add rows to provide the details of your sector-specific targets by selecting the relevant sector in the sector field.
Question dependencies
This question only appears if you select “Base year emissions target” in response to 4.4.
Change from 2020
No change
Response Options
Please complete the following table. The table is displayed over several rows for readability. You are able to add rows by using the “Add Row” button at the bottom of the table.
| Sector | Base year | Base year emissions (metric tonnes CO2e) | Percentage reduction target |
|---|---|---|---|
|
Select from:
|
Numerical field |
Numerical field |
Percentage field |
| Target year | Has a decarbonisation pathway(s) been modelled for your target? | Comments |
|---|---|---|
Numerical field | Select from:
| Text field |
[Add Row]
Guidance
This question allows you to provide the details of your base year emissions reduction target for your government operations. You can provide information on multiple targets by adding additional rows. Please try to complete all the relevant fields of this table. This is a table question with the following fields:
- Sector: If your target applies for the entire of your government’s operations and covers multiple sectors, please select “Total” in this field. If you want to provide the details of your sector-specific targets, please select the relevant sector in this field.
- Base year: Please enter a numerical value for this field. Your base year is the reference year from which your greenhouse gas reductions are measured. Please ensure the base year corresponds to any emissions inventory you may have for the correct sector selected in the sector field.
- Base year emissions (metric tonnes CO2e): Please enter the numerical value for the emissions in your base year, without commas. Your base emissions are the greenhouse gas emissions from your base year on which your target is based.
- Percentage reduction target: Please enter the numerical value of your percentage reduction target, without commas and without the percentage symbol (%). If your target is not currently expressed as a percentage, please convert it into this format (for example an absolute emissions reduction in metric tonnes CO2e can be converted into a percentage reduction relative to the base year). If this is not possible, please note your target reduction and other relevant detail in the Comment field for this question.
- Target year: Please enter in numerical form the year by which you anticipate achieving your goal. Please note that the target year cannot be in the past.
- Has a decarbonisation pathway(s) been modelled for your target: Please detail whether or not a decarbonisation pathway has been modelled for your target by selecting: “Yes”, “No” or “Informal”. Please use informal if you have a decarbonisation pathway modelled but has not been officially verified. Decarbonisation pathways are the different options and strategies in place to meet their emissions reduction targets provides crucial information about how GHG reduction targets can be met, which considers the trade-offs that will have to be made.
- Comments: Please provide any other contextualizing information about your reduction target in this field including but not limited to:
Short target summary: Please include a brief description of your target in this field.
Sectors covered: If you selected “Total” in the sector field, please outline the relevant ones covered by your target in this field.
Gases covered: Please specify all the relevant Kyoto GHGs (CO2, CH4, N2O, HFCs, PFCs and SF6) covered by your base year emissions target.
Example Response
| Sector | Base year | Base year emissions (metric tonnes CO2e) | Percentage reduction target |
|---|---|---|---|
|
Total |
1990 |
250000000 |
100 |
|
Industry |
1990 |
80000000 |
100 |
| Target year | Has a decarbonisation pathway(s) been modelled for your target? | Comments |
|---|---|---|
|
2050 |
Yes |
Reduce emissions from government operations emissions for all 2006 IPCC sectors by 100% based on 1990 levels. This target covers CO2, methane and HFCs. |
|
2050 |
Informal |
Reduce emissions from industrial government operations sector by 100% based on 1990 levels. This target covers CO2 and methane. |
4.4b Please provide the details of your base year intensity target(s). An intensity target is usually measured per capita or per unit GDP. You may add rows to provide the details of your sector-specific targets by selecting the relevant sector in the sector field.
Question dependencies
This question only appears if you select “Base year intensity target” in response to 4.4.
Change from 2020
No change
Response Options
Please complete the following table. The table is displayed over several rows for readability. You are able to add rows by using the “Add Row” button at the bottom of the table.
| Sector | Intensity unit (Emissions per) | Base year | Base year emissions per intensity unit (metric tonnes CO2e per denominator) |
|---|---|---|---|
|
Select from:
|
Select from:
|
Numerical field |
Numerical field |
| Percentage reduction target in emissions intensity | Target year | Has a decarbonisation pathway(s) been modelled for your target? | Comments |
|---|---|---|---|
Percentage field | Numerical field | Select from:
| Text field |
[Add Row]
Guidance
This question allows you to provide the details of your base year intensity target for your government operations. You can provide information on multiple targets by adding additional rows. Please try to complete all the relevant fields of this table. This is a table question with the following fields:
- Sector: If your target applies for the entire of your government’s operations and covers multiple sectors, please select “Total” in this field. If you want to provide the details of your sector-specific targets, please select the relevant sector in this field.
- Intensity unit (Emissions per): Please define the variable used in your government’s intensity target by selecting the relevant variable from the drop-down options (either metric tonnes CO2e per capita, or metric tonnes CO2e per GDP). If your region uses a variable, which is not listed, please select “Other” and define the variable in the text field provided. Emissions intensity refers to emissions per unit of another variable, which is typically economic output, such as GDP, but may also be population, energy use, or a different variable.
- Base year: Please enter a numerical value for this field. Your base year is the reference year from which your greenhouse gas reductions are measured. Please ensure the base year corresponds to any emissions inventory you may have for the correct sector selected in the sector field.
- Base year emissions per intensity unit (metric tonnes CO2e per denominator): Please enter the numerical value of your base year emissions per intensity unit, without commas. Your base year emissions are the greenhouse gas emissions from your base year on which your target is based.
- Percentage reduction target in emissions intensity: Please enter the numerical value of your percentage reduction target, without commas and without the percentage symbol (%). If your target is not currently expressed as a percentage, please convert it into this format (for example an emissions reduction in metric tonnes CO2e per intensity metric can be converted into a percentage reduction relative to the base year). If this is not possible, please note your target reduction and other relevant detail in the Comment field for this question.
- Target year: Please enter in numerical form the year by which you anticipate achieving your goal. Please note that the target year cannot be in the past.
- Has a decarbonisation pathway(s) been modelled for your target: Please detail whether or not a decarbonisation pathway has been modelled for your target by selecting: “Yes”, “No” or “Informal”. Please use informal if you have a decarbonisation pathway modelled but has not been officially verified. Decarbonisation pathways are the different options and strategies in place to meet your emissions reduction targets, which provides crucial information about how GHG reduction targets can be met and considers the trade-offs that will have to be made.
- Comments: Please provide any other contextualizing information about your reduction target in this field including but not limited to:
Short target summary: Please include a brief description of your target in this field.
Sectors covered: If you selected “Total” in the sector field, please outline the relevant ones covered by your target in this field.
Gases covered: Please specify all the relevant Kyoto GHGs (CO2, CH4, N2O, HFCs, PFCs and SF6) covered by your base year emissions target.
Example Response
| Sector | Intensity unit (Emissions per) | Base year | Base year emissions per intensity unit (metric tonnes CO2e per denominator) |
|---|---|---|---|
|
Total |
Metric tonnes of CO2e per capita |
2002 |
2.1 |
|
Industry |
Metric tonnes of CO2e per capita |
2010 |
1 |
| Percentage reduction target in emissions intensity | Target year | Has a decarbonisation pathway(s) been modelled for your target? | Comments |
|---|---|---|---|
|
15 |
2050 |
No |
Target is for a reduction of 15% per capita emissions from 2002 by 2050. This target covers all 2006 IPCC sectors and all Kyoto GHGs. |
|
30 |
2030 |
Informal |
Target is for a reduction of 30% reduction on per capita emissions from 2010 by 2050. This target covers all Kyoto GHGs. |
4.4c Please provide the details of your baseline scenario target(s), including projected business as usual emissions. You may add rows to provide the details of your sector-specific targets by selecting the relevant sector in the sector field.
Question dependencies
This question only appears if you select “Baseline scenario (business as usual) target” in response to 4.4.
Change from 2020
No change
Response Options
Please complete the following table. The table is displayed over several rows for readability. You are able to add rows by using the “Add Row” button at the bottom of the table.
| Sector | Base year | Base year emissions (metric tonnes CO2e) | Target year |
|---|---|---|---|
|
Select from:
|
Numerical field |
Numerical field |
Numerical field |
| Estimated business as usual absolute emissions in target year (metric tonnes CO2e) | Percentage reduction target from business as usual | Has a decarbonisation pathway(s) been modelled for your target? | Comments |
|---|---|---|---|
Numerical field | Percentage field | Select from:
| Text field |
[Add Row]
Guidance
This question allows you to provide the details of your baseline scenario (business as usual) target for your government operations. You can provide information on multiple targets by adding additional rows. Please try to complete all the relevant fields of this table. This is a table question with the following fields:
- Sector If your target applies for the entire of your government’s operations and covers multiple sectors, please select “Total” in this field. If you want to provide the details of your sector-specific targets, please select the relevant sector in this field.
- Base year: Please enter a numerical value for this field. Your base year is the reference year from which your greenhouse gas reductions are measured. Please ensure the base year corresponds to any emissions inventory you may have for the correct sector selected in the sector field.
- Base year emissions (metric tonnes CO2e): Please enter the numerical value for the emissions in your base year, without commas. Your base emissions are the greenhouse gas emissions from your base year on which your target is based.
- Target year: Please enter in numerical form the year by which you anticipate achieving your goal. Please note that the target year cannot be in the past.
- Estimated business as usual absolute emissions in target year (metric tonnes CO2e): Please indicate the estimated business as usual emissions figure in the target year. A baseline scenario is a reference case that represents the events or conditions most likely to occur in the absence of activities taken to meet a mitigation target.
- Percentage reduction target from business as usual: Please enter the percentage reduction relative to your region’s baseline scenario emissions. This should not include commas or the percentage symbol (%)
- Has a decarbonisation pathway(s) been modelled for your target: Please detail whether or not a decarbonisation pathway has been modelled for your target by selecting: “Yes”, “No” or “Informal”. Please use informal if you have a decarbonisation pathway modelled but has not been officially verified. Decarbonisation pathways are the different options and strategies in place to meet your emissions reduction targets, which provides crucial information about how GHG reduction targets can be met and considers the trade-offs that will have to be made.
- Comments: Please provide any other contextualizing information about your reduction target in this field including but not limited to:
Short target summary: Please include your short target summary in this field.
Sectors covered: If you selected “Total region-wide emissions” in the sector field, please outline the relevant ones covered by your target in this field.
Gases covered: Please specify all the relevant Kyoto GHGs (CO2, CH4, N2O, HFCs, PFCs and SF6) covered by your emissions target.
Example Response
| Sector | Base year | Base year emissions (metric tonnes CO2e) | Target year |
|---|---|---|---|
|
Total |
2005 |
740000000 |
2025 |
|
Transport |
2002 |
48000000 |
2030 |
| Estimated business as usual absolute emissions in target year (metric tonnes CO2e) | Percentage reduction target from business as usual | Has a decarbonisation pathway(s) been modelled for your target? | Comments |
|---|---|---|---|
|
790000000 |
20 |
Yes |
20% reduction in emissions in 2025 compared to a BAU scenario. This target covers Energy, Transport and Industry sectors as well as all Kyoto GHGs. |
|
38000000 |
10 |
Yes |
10% reduction in emissions in 2030 compared to a BAU scenario for the Transport sector. This target only covers CO2. |
4.4d Please provide the details of your fixed level target(s). Fixed level targets are not expressed relative to either a historical base year or a projected baseline scenario. You may add rows to provide the details of your sector-specific targets by selecting the relevant sector in the sector field.
Question dependencies
This question only appears if you select “Fixed level Target” in response to 4.4.
Change from 2020
No change
Response Options
Please complete the following table. You are able to add rows by using the “Add Row” button at the bottom of the table.
| Sector | Percentage reduction target | Target year | Has a decarbonisation pathway(s) been modelled for your target? | Comments |
|---|---|---|---|---|
|
Select from:
|
Percentage field |
Numerical field |
Select from:
|
Text field |
[Add Row]
Guidance
This question allows you to provide the details of your fixed level target for your government operations. You can provide information on multiple targets by adding additional rows. Please try to complete all the relevant fields of this table. This is a table question with the following fields:
- Sector: If your target applies for the entire of your government’s operations and covers multiple sectors, please select “Total” in this field. If you want to provide the details of your sector-specific targets, please select the relevant sector in this field.
- Percentage reduction target: Please express your target as a numerical percentage, where possible. This should not include commas or the percentage symbol (%). For example, if your target is to limit or have no emissions from a specific sector, then please enter 100. If this is not possible, please explain your target other relevant detail in the Comment field for this question.
- Target year: Please enter in numerical form the year by which you anticipate achieving your goal. Please note that the target year cannot be in the past.
- Has a decarbonisation pathway(s) been modelled for your target: Please detail whether or not a decarbonisation pathway has been modelled for your target by selecting: “Yes”, “No” or “Informal”. Please use informal if you have a decarbonisation pathway modelled but has not been officially verified. Decarbonisation pathways are the different options and strategies in place to meet your emissions reduction targets, which provides crucial information about how GHG reduction targets can be met and considers the trade-offs that will have to be made.
- Comments: Please provide any other contextualizing information about your reduction target in this field including but not limited to:
Short target summary: Please include your short target summary in this field.
Sectors covered: If you selected “Total region-wide emissions” in the sector field, please outline the relevant ones covered by your target in this field.
Gases covered: Please specify all the relevant Kyoto GHGs (CO2, CH4, N2O, HFCs, PFCs and SF6) covered by your emissions target.
Example Response
| Sector | Percentage reduction target | Target year | Has a decarbonisation pathway(s) been modelled for your target? | Comments |
|---|---|---|---|---|
|
Total |
100 |
2050 |
Informal |
To reduce government operations’ CO2-e emissions to net zero by 2050 and covers all 2006 IPCC sectors as well as all Kyoto GHGs |
|
Energy |
100 |
2040 |
Yes |
No emissions from energy generation by 2040. This target covers only CO2 emissions. |
Energy
4.5 Does your region have an energy efficiency target in place at the region-wide level and/or your government operations?
Change from 2020
No change
Response Options
Select one of the following options:
- Yes
- No
Guidance
To respond to this question, please select “Yes” or “No” from the drop-down menu. Responding “Yes” will direct you to question 4.5a, where you will be asked to provide details of your reduction target; responding “No” directs you to question 4.5b.
Explanation of term
- Energy efficiency definition: It is the ratio of a delivered good or service to the energy consumed in the process, getting the same level – or an equivalent quality-adjusted – of service from a smaller quantity of energy consumed (Reference: Brennan, T. (2013). Energy Efficiency Policy Puzzles. The Energy Journal, 34(2), 1-25. Available at: http://www.jstor.org/stable/41970480).
4.5a Please provide the details of your energy efficiency target(s).
Question dependencies
This question only appears if you select “Yes” in response to 4.5.
Change from 2020
No change
Response Options
Please complete the following table. The table is displayed over several rows for readability. You are able to add rows by using the “Add Row” button at the bottom of the table.
| Scale | Sector | Target type | Base year | Target year |
|---|---|---|---|---|
|
Select from:
|
Select from:
|
Select from:
|
Numerical field |
Numerical field |
| Target energy | Target (%) | Comments |
|---|---|---|
Select from:
| Percentage field
| Text field |
[Add Row]
Guidance
If you select “Yes” to question 4.5, please complete this table question with the following fields:
- Scale: Please select the relevant scale for your target. “Region-wide” includes the entire geographic area of the region while “Government operations” focuses on targets applied solely to your government operations.
- Sector: If your target applies for the entire of your region or government’s operations and covers multiple sectors, please select “Total” in this field. If you want to provide the details of your sector-specific targets, please select the relevant sector in this field.
- Target type: Please select the type of target you have from the following options:
Increase efficiency: Increasing energy efficiency means getting more from the energy used to deliver goods and services through innovation, and/or cutting out wasted energy, reducing the energy used while maintaining output.
Reduce consumption: Targets refer to reducing consumption patterns of both final and primary energy and electricity to deliver goods and services that is delivering equal or greater output with less energy.
- Base year: Please enter a numerical value for this field. Your base year (also known as a “baseline year” or “representative year”) is the reference year from which your target is measured.
- Target year: Please enter in numerical form the year by which you anticipate achieving your goal. Please note that the target year cannot be in the past.
- Target energy: Please select the relevant target energy for your target from the following options:
Electricity: As a widely used form of energy, targets refer to the efficiency of electric power systems – encompassing generation, transmission, distribution and utilization of electrical energy – that provide electricity to households, industry and transport sector among others.
Final energy: It refers to the form of energy available to end users for consumption such as households, industry and agriculture, following the conversion from primary energy carriers (e.g. crude oil, natural gas, coal, and renewables). Final forms of energy include, among others, electricity, heating oil, fuels, gas and district heat (Reference: European Nuclear Society).
Primary energy: Energy that has not been subjected to any conversion or transformation process. Primary energy includes non-renewable energy and renewable energy (Reference: European Council for an Energy Efficient Economies).
- Target (%): Please express your target as a numerical percentage, where possible. This should not include commas or the percentage symbol (%).
- Comments: Please provide any other contextualizing information about your reduction target in this field including but not limited to:
Short target summary: Please include your short target summary in this field. Examples of short target summaries are presented below.
Sectors covered: If you selected “Total” in the sector field, please outline the relevant ones covered by your target in this field.
Examples of target summaries
For additional information on energy efficiency targets, below are examples of targets that cover both total and individual sectors as well as region-wide and government operations target scale.
| Scale | States and regions | Sectors | Target type | Target energy | Example |
|---|---|---|---|---|---|
|
Region-wide |
Quebec |
Total |
Increase efficiency |
Primary energy |
Increase energy efficiency by 24% by 2030 based on 2018 levels. |
|
Region-wide |
Brittany |
Total |
Reduce consumption |
Final energy |
Reduce the consumption of end-use energy by 30% by 2040 based on 2012 levels |
|
Region-wide |
Sardinia |
Transport |
Reduce consumption |
Primary energy |
Reduce region-wide energy consumption by the transport sector by 8% by 2030 based on 2013 levels |
|
Government operations |
Estado de Mexico |
Energy |
Reduce consumption |
Electricity |
Reduce electricity consumption in public administration buildings by 100% by 2023 based on 2016 levels |
Example Response
| Scale | Sector | Target type | Base year | Target year |
|---|---|---|---|---|
|
Region-wide |
Total |
Increase efficiency |
2013 |
2030 |
|
Government operations |
Industry |
Reduce consumption |
2000 |
2020 |
| Target energy | Target (%) | Comments |
|---|---|---|
|
Primary energy |
15 |
Increase region-wide primary energy efficiency for industrial and transport sectors by 15% by 2030 based on 2013. |
|
Electricity |
20 |
Reduce electricity consumption in state industrial buildings by 20% by 2020 based on 2000. |
4.5b Please explain why you do not have an energy efficiency target.
Question dependencies
This question only appears if you select “No” in response to 4.5.
Change from 2020
No change
Response Options
Please complete the following table:
| Reason | Please explain |
|---|---|
|
Select from:
|
Text field |
Guidance
Please give more details on why you do not have an energy efficiency target by selecting the most suitable option from the drop-down options provided in the “Reason” field and give an explanation in the context of your region. Select “Other, please specify” if you have a different reason that best explains why your region does not have an energy efficiency target and specify it in the text field provided.
4.6 Does your region have a renewable energy or electricity target in place at the region-wide level and/or your government operations?
Change from 2020
No change
Response Options
Select one of the following options:
- Yes
- No
Guidance
To respond to this question, please select “Yes” or “No” from the drop-down menu. Responding “Yes” will direct you to question 4.6a, where you will be asked to provide details of your reduction target; responding “No” directs you to question 4.6b.
Explanation of terms
- Renewable energy definition: Energy derived from renewable non-fossil energy sources and natural processes (e.g. sunlight and wind) that are replenished at a faster rate than they are consumed. Solar, wind, geothermal, hydro, and some forms of biomass are common sources of renewable energy (Reference: International Energy Agency).
- Renewable electricity definition: Electricity generated by means of a renewable energy source is considered “renewable electricity”. Sources include wind, solar, hydro power, biomass, geothermal energy, wave, tidal energy and the renewable part of waste (Reference: RECS International)
4.6a Please provide details of your renewable energy or electricity target(s).
Question dependencies
This question only appears if you select “Yes” in response to 4.6.
Change from 2020
No change
Response Options
Please complete the following table. The table is displayed over several rows for readability. You are able to add rows by using the “Add Row” button at the bottom of the table.
| Scale | Target type | Unit type | Base year | Total renewable energy / electricity covered by target in base year (in unit specified in column 3) | Target year |
|---|---|---|---|---|---|
|
Select from:
|
Select from:
| Select from:
|
Numerical field |
Numerical field
|
Numerical field |
| Total renewable energy / electricity covered by target in target year (in unit specified in column 3) | Percentage of renewable energy / electricity covered by target in target year (%) | Web link with target information | Comments |
|---|---|---|---|
Numerical field
| Numerical field | Text field | Text field
|
[Add Row]
Guidance
- Scale: Please select the relevant scale for your target. “Region-wide” includes the entire geographic area of the region while “Government operations” focuses on targets applied solely to your government operations.
- Target type: Please select the relevant type for your target from the following options:
Renewable electricity consumption: It is the electricity generated from renewable energy sources delivered to consumers (public and private). It can be defined as the ratio between the electricity produced from renewable energy sources and the gross national electricity consumption – which comprises national electricity generation from all fuels (including auto production), plus electricity imports, minus exports (Reference: European Environment Agency).
Renewable electricity production: It refers to the process of producing or generating electrical energy by transforming other forms of renewable energy, for example wind power or geothermal energy (Reference: Eurostat).
Renewable energy consumption: It is the consumption of energy from renewable sources. It can be defined as the energy commodities delivered for energy purposes to industry, transport, households, services, agriculture, forestry and fisheries, including electricity and heat consumed by the energy sector and losses of electricity and heat in distribution and transmission (Reference: Eurostat).
Renewable energy production: It refers to the primary production of energy from renewable sources, that is the extraction of energy products in a useable form from natural sources. This occurs when natural sources are exploited (e.g. hydro power plants, wind farms). Transforming energy from one form into another (from solar to heat) is not primary production (Reference: Eurostat).
Other, please specify: Please specify the type of target you have.
- Unit type: Please select the appropriate unit type for your renewable production or consumption figure. The associated units that can be selected for this question include: GW, MW, GWh, MWh, and %.
- Base year: Please enter a numerical value for this field. Your base year (also known as a "baseline year" or "representative year") is the reference year from which your target is measured.
- Total renewable energy / electricity covered by target in base year (in unit specified in column 3): Please provide your base year’s total renewable production or consumption, as either a production value, consumption value or percentage as a numerical value without commas and the percentage symbol (%).
- Target year: Please enter in numerical form the year by which you anticipate achieving your goal. Please note that the target year cannot be in the past.
- Total renewable energy / electricity covered by target in target year (in unit specified in column 3): Please provide your target year’s total renewable production or consumption, as a production value, consumption value or percentage as a numerical value without commas and the percentage symbol (%).
- Percentage of renewable energy / electricity covered by target in target year (%): Please express your target as a numerical percentage, where possible. This should not include commas or the percentage symbol (%).
- Web link of target: If it is available online, please provide a web link to the target.
- Comments: Please provide any other contextualizing information about your reduction target in this field including a short target summary. Examples of short target summaries are presented below.
Examples of target summaries
For additional information on renewable energy targets, below are examples of target summaries.
| Scale | States and regions | Target type | Examples |
|---|---|---|---|
|
Region-wide |
Baden Wurttemberg |
Renewable energy consumption |
Increase renewables to 80% of gross final energy consumption by 2050 based on 2017 levels. |
| Region-wide | New Caledonia | Renewable electricity consumption | Increase renewable electricity consumption by 100% in 2030 based on 2014 levels. |
|
Region-wide |
Navarra |
Renewable electricity consumption |
Increase renewable electricity consumption by 50% in 2030 based on 2017 levels. |
Example Response
| Scale | Target type | Base year | Total renewable energy / electricity covered by target in base year (in unit specified in column 3) | Unit type | Target year |
|---|---|---|---|---|---|
|
Region-wide |
Renewable energy consumption |
2000 |
2816 |
MW |
2020 |
|
Government operations |
Renewable electricity production |
2000 |
750 |
MW |
2025 |
| Total renewable energy / electricity covered by target in target year (in unit specified in column 3) | Percentage of renewable / electricity covered by target in target year (%) | Web link with target information | Comments |
|---|---|---|---|
4500 | 20 | www.stateand region.com/renewableenergytarget2020 | Increase renewable consumption by 20% of by 2020. |
1500 | 30 | www.stateand region.com/renewableenergytarget2025 | Increase renewable production to 1,500 MW of production by 2025. |
4.6b Please explain why you do not have a renewable energy or electricity target.
Question dependencies
This question only appears if you select “No” in response to 4.6.
Change from 2020
No change
Response Options
Please complete the following table:
| Reason | Please explain |
|---|---|
|
Select from:
|
Text field |
Guidance
Please give more details on why you do not have a renewable energy/electricity target by selecting the most suitable option from the drop-down options provided in the “Reason” field and give an explanation in the context of your region. Select “Other, please specify” if you have a different reason that best explains why your region does not have a renewable energy/electricity target and specify it in the text field provided.
Climate actions
4.7 Please select the sectors that are relevant for your region's climate actions.
Change from 2020
No change
Response Options
Select all that apply:- Agriculture
- Buildings & Lighting
- Energy
- Finance & Economy
- Governance
- Industry
- Land use
- Transport
- Waste
- Water
- Healthcare
Guidance
This question covers which climate actions you are taking in your region. A total of 114 possible climate actions available, grouped into the 11 sectors as outlined below. To disclose the climate actions you are taking for a specific sector, simply click on the sector you wish to disclose your actions for, and tables will appear outlining the climate actions associated with selected sectors. You can select more than one sector and if your region currently does not have any climate actions planned or implemented, please skip this question.
Number of climate actions by sector:
- Agriculture sector (6 possible actions)
- Buildings & Lighting sector (18 possible actions)
- Energy sector (22 possible actions)
- Finance & Economy sector (15 possible actions)
- Governance sector (7 possible actions)
- Industry sector (7 possible actions)
- Land use sector (6 possible actions)
- Transport sector (14 possible actions)
- Waste sector (12 possible actions)
- Water sector (4 possible actions)
- Healthcare sector (3 possible actions)
4.7a - 4.7k Please provide details of your climate actions in the [Agriculture, Buildings & Lighting, Energy, Finance & Economy, Governance, Industry, Land use, Transport, Waste and Water, Healthcare] sector.
Question dependencies
Tables with relevant climate action by sector will appear depending on the response to 4.7.
Change from 2020
No change
Response Options
Please complete the following table:
| Climate actions | Is your region taking this action? | What is the scale of its implementation? | Does your government have jurisdictional power to implement this action? | Action description |
|---|---|---|---|---|
|
Select from Appendix B
|
Select from:
|
Select from:
| Select from:
|
Text field
|
Guidance
Tables with relevant climate actions by sector will appear depending on the response to 4.7. Each table will present all relevant climate actions for that sector asking you to provide additional information on the following fields:
- Climate actions: This field will present all the relevant actions for selected sectors in different rows. A complete list of climate actions for each sector is outlined in Appendix B.
- Is your region taking this action: Please indicate whether each climate action presented in the table is being taken by your region by selecting “Yes”, “No” or “Planned in the next 2 years”
- What is the scale of its implementation: Please select: “Pilot stage” when your region is trialing a climate action, “Limited implementation” when the climate action has been partly deployed in your region/applicable areas, and “Comprehensive implementation” when the climate action has been fully deployed across your region/applicable areas.
- Does your government have jurisdictional power to implement this action? Select ‘Yes’ if your government has the exclusive or concurrent (shared with national/local government) authority or control to implement the climate action being reported.
- Action description: Please provide a description of your climate action in the context of your region.
Additional information on the different climate actions for each sector
Agriculture
| Climate action | Description / Additional information |
|---|---|
|
Improve capacity of farmers and rural organizations (e.g. educating farmers on innovative and cost-effective measures, providing financial support, developing farm level carbon footprint) |
More info: FAO - http://www.fao.org/rural-institutions/en/ |
| Improve grassland and cropland management (e.g. improve nutrient management, implement rotational or prescribed grazing methods) | More info: Intechopen - https://www.intechopen.com/online-first/strategic-management-of-grazing-grassland-systems-to-maintain-and-increase-organic-carbon-in-soils |
| Reduce methane emissions from manure (e.g. install dairy digesters) | More info: Journal of
Dairy Science - https://www.journalofdairyscience.org/article/S0022-0302(18)30939-1/abstract |
| Reduce methane emissions from livestock digestive systems (e.g. feed management to improve productivity) | More info: Journal of Animal Science and Technology - https://www.ncbi.nlm.nih.gov/pmc/articles/PMC6004689/ University of Reading - https://www.futurelearn.com/courses/climate-smart-agriculture/0/steps/26577 |
| Improve soil health/soil carbon sequestration capacity | More info: Nature - https://www.nature.com/scitable/knowledge/library/soil-carbon-storage-84223790 |
| Promote other sustainable farming practices | More info: UC Davis -
http://asi.ucdavis.edu/programs/sarep/about/what-is-sustainable-agriculture IIED - https://www.iied.org/five-ways-make-farming-more-sustainable |
| Other, please specify |
Buildings & Lighting
| Climate action | Description / Additional information |
|---|---|
|
Improve heating and cooling efficiency (e.g. audits, insulation, HVAC maintenance, white roofs, etc.) |
More info: IEA - https://www.iea.org/publications/freepublications/publication/buildings_roadmap.pdf |
|
Increase awareness/engage public on energy efficiency/clean energy programs |
More info: EEA - https://www.eea.europa.eu/publications/achieving-energy-efficiency-through-behaviour/file |
|
Install biomass heating |
More info: Forest - https://ec.europa.eu/energy/intelligent/projects/sites/iee-projects/files/projects/documents/forest_guide_for_designers_and_architects_en.pdf |
|
Install clean cook stoves |
More info: Global Alliance for Clean Cook stoves - http://cleancookstoves.org/resources/272.html |
|
Install energy efficient lighting systems (e.g. LED) |
More info: WBDG - www.wbdg.org/resources/energy-efficient-lighting |
| Install geothermal heating | More info: US EPA - https://www.epa.gov/rhc/geothermal-heating-and-cooling-technologies |
|
Install more efficient luminaires in outdoor lighting (e.g. LED) |
More info: EC - http://ec.europa.eu/environment/gpp/pdf/tbr/street_lighting_tbr.pdf |
|
Install smart energy meters/sub-meters |
Smart meters use digital technology to enable a customer to see real time energy consumption and cost in a way that might cause them to reduce their energy consumption and become more efficient. Source: CNEE - https://spotforcleanenergy.org/wp-content/uploads/2016/03/ee936982af6480acb10ae1ca83ea5913.pdf |
|
Install solar heating/hot water |
More info: Autodesk - https://sustainabilityworkshop.autodesk.com/buildings/solar-hot-water Energy Saving Trust - https://www.energysavingtrust.org.uk/renewable-energy/heat/solar-water-heating |
|
Promote and strengthen building energy performance rating/certification/benchmarking |
"Benchmarking" assesses building energy performance based on actual energy use information. Public disclosure and rating or certification of building energy performance can support investment in energy efficiency improvements and increase transparency to buyers and renters. Source: ACEEE - https://database.aceee.org/city/benchmarking-disclosure |
|
Promote energy efficient appliances |
More info: EC - https://ec.europa.eu/energy/en/topics/energy-efficiency/energy-efficient-products |
|
Set/strengthen appliance efficiency standards |
Examples: US Energy Department - https://energy.gov/eere/buildings/appliance-and-equipment-standards-program |
| Set/strengthen HVAC efficiency standards | Example: California Energy Commission 2019 Building Energy Efficiency Standards For Residential And Nonresidential Buildings https://www.energy.ca.gov/2018publications/CEC-400... |
|
Set/strengthen lighting efficiency standards |
More info: EESI - http://www.eesi.org/papers/view/fact-sheet-energy-efficiency-standards-for-appliances-lighting-and-equipmen |
|
Switch from heating oil to natural gas |
More info: UGIHVAC - https://ugihvac.com/the-low-down-on-heat-switching-from-oil-to-natural-gas/ |
| Commit to reaching net-zero operating emissions in public buildings | More information: World Green Building Council - https://www.worldgbc.org/thecommitment |
| Establish a plan/roadmap for all new buildings to produce net-zero GHG emissions | More info: Cibse Journal & Leti - https://www.cibsejournal.com/technical/countdown-to-zero/ |
| Net Zero Carbon Buildings Commitment participants: reducing operating emissions of government-owned building portfolio | More info: World GBC- https://www.worldgbc.org/thecommitment |
| Other, please specify |
Energy
| Climate action | Description / Additional information |
|---|---|
|
Enable net metering |
"Net metering" is a policy that allows unused distributed power to be delivered to the grid at a per kilowatt hour (kWh) credit. Customers are credited for any power they deliver to the grid and then after they use power, they are billed only for the “net” power they use over their generation (CNEE). Source: CNEE - https://spotforcleanenergy.org/wp-content/uploads/2016/03/e4a2cb1ddfe74438231b1ec98cdadae4.pdf |
|
Expand/improve transmission to integrate renewables |
Renewable Energy Integration focuses on incorporating renewable energy, distributed generation, energy storage, thermally activated technologies, and demand response into the electric distribution and transmission system. The integration also establishes viable business models for incorporating these technologies into capacity planning, grid operations, and demand-side management. Source: Office of Electricity Delivery & Energy Reliability https://energy.gov/oe/services/technology-development/renewable-energy-integration |
|
Install natural gas power | Example: EIA - https://www.eia.gov/todayinenergy/detail.php?id=27072 |
|
Install biomass power |
More info: WBDG - https://www.wbdg.org/resources/biomass-electricity... |
|
Install carbon capture and storage (CCS) |
Carbon capture and geological storage (CCS) is a technique for trapping carbon dioxide emitted from large point sources such as power plants, compressing it, and transporting it to a suitable storage site where it is injected into the ground. Source: European Commission https://ec.europa.eu/clima/policies/lowcarbon/ccs_en |
| Install combined heat and power (CHP) or trigen | More info: UK GOV - https://www.gov.uk/guidance/combined-heat-and-power |
|
Install energy storage system |
More info: Energy Storage Association - http://energystorage.org/energy-storage/energy-storage-technologies |
|
Install hydropower |
More info: The Energy Saving Trust - https://www.energysavingtrust.org.uk/renewable-energy/electricity/hydro |
|
Install microgrids |
A microgrid is a localized grouping of electricity generation, energy storage, and loads that normally operates connected to a traditional centralized grid but can be disconnected and function autonomously. Source: Journal of Clean Energy Technologies - http://www.jocet.org/vol5/342-S012.pdf |
|
Install nuclear power |
More info: World Nuclear Association - http://www.world-nuclear.org/information-library/current-and-future-generation/nuclear-power-in-the-world-today.aspx |
|
Install smart grids |
"Smart grid" is an umbrella term describing an electrical transmission and distribution system that employs a full array of advanced electronic metering, communications, and control technologies. The grid would provide detailed feedback to customers and system operators on energy use and allow precise control of the energy flow in the grid. Source: ACEEE - http://aceee.org/policy-brief/smart-grid |
|
Install solar power (e.g. PV, CSP) |
More info: The Energy Saving
Trust - https://www.energysavingtrust.org.uk/renewable-energy/electricity/solar-panels |
|
Install geothermal power | More info: NREL - https://www.nrel.gov/workingwithus/re-geo-elec-production.html |
|
Install wind power (e.g. onshore, offshore) |
More info: AEWA - https://www.awea.org/wind-power-101 |
|
Install ocean/tidal/wave power |
European Commission - https://setis.ec.europa.eu/system/files/Technology_Information_Sheet_Ocean_Energy.pdf |
|
Measure energy productivity (e.g. GDP per unit of energy) |
Can be widely measure as the physical use of raw material to the economic performance of the whole economy. The policy target aims to improve the efficiency of the use of the resource. For the agricultural sector energy productivity would be the quantity of a given agricultural product per unit of energy required for its production. Sources: More info: Australian Alliance for Energy Productivity - https://a2se.org.au/our-work/2xep-by-2030-project/921-uncategorised/417-what-is-energy-productivity |
|
Promote demand-side management programs |
Demand-side management (DSM) programs consist of the planning, implementing, and monitoring activities to provide cost-effective energy and capacity resources to help defer the need for new sources of power, including generating facilities, power purchases, and transmission and distribution capacity additions. Source: EIA - https://www.eia.gov/electricity/data/eia861/dsm/ |
|
Reform utility revenue policies and rate structures |
Efforts to reform the current utility regulatory construct have taken many forms, including regulating and rewarding utilities based on their performance against certain metrics, rather than the traditional rate of return based on spending. Source: CNEE - https://spotforcleanenergy.org/wp-content/uploads/2017/08/3c8cf27c34a31283233d35966d218e5e.pdf |
|
Phase out coal-fired/inefficient power stations |
More info: Climate Analytics - https://climateanalytics.org/briefings/coal-phase-out/ |
|
Set energy efficiency resource standards (EERS) |
An "energy efficiency resource standard" (EERS) establishes a percentage of energy demand reduction by a specific date or on an annual basis that a utility will achieve through demand reduction programs (e.g. x utility will achieve a 10% reduction in demand (or demand growth) over the next 10 years). Source: CNEE - https://spotforcleanenergy.org/wp-content/uploads/2016/03/1c7edec388b2b5bdeea29ede128e573d.pdf |
| Set a target of 100% zero-carbon power (i.e. based on a large-scale switch to renewable energy) | More info: Systemiq - https://www.systemiq.earth/news-1/2019/7/11/electrification-and-decarbonisation-the-role-of-fusion-in-achieving-a-zero-carbon-power-grid Example: https://www.greentechmedia.com/articles/read/new-mexico-senate-passes-100-carbon-free-electricity-bill#gs.a6lz6b |
| Control methane leaks from oil & gas operatoins | More info: https://www.americangeosciences.org/geoscience-currents/methane-emissions-oil-and-gas-industry |
| Other, please specify |
Finance & Economy
| Climate action | Description / Additional information |
|---|---|
|
Adopt feed in tariff for renewables |
Feed-In Tariffs are payments to ordinary energy users for the renewable electricity they generate. These can be presented as part of schemes that pays people for creating their own “green electricity”. Source: Feed-In Tariffs http://www.fitariffs.co.uk/fits/ |
|
Adopt reverse auction for renewables |
A "reverse auction" mechanism is an auction approach to procurement, wherein sellers, which meet certain minimum criteria, are eligible to submit non-negotiable price bids. The buyer (typically a utility) then selects winning sellers based on the lowest priced bids first, and signs non-negotiable standard contracts with the winning sellers, incorporating the prices bid by that seller. Source: SEIA - https://www.seia.org/initiatives/reverse-auction-mechanism |
|
Enable PACE (long term property tax based loans) financing |
"Property Assessed Clean Energy" (PACE) is a financing mechanism implemented by local governments that allows property owners to finance energy efficiency and renewable energy improvements via a voluntary property tax assessment collected by local governments, just as other public infrastructure investments are financed. Source: CNEE - https://spotforcleanenergy.org/wp-content/uploads/2016/05/32c1e5155f58039fd5d4602f69695008.pdf |
|
Establish GHG emissions trading program |
"GHG trading programs" harnesses market forces to reduce emissions cost-effectively. Also called "cap and trade," the program sets a cap on emissions and allows the market to determine a price on carbon, which drives investment decisions and spurs market innovation. Source: C2ES - https://www.c2es.org/content/cap-and-trade-basics/ |
|
Increase awareness/engage public on financing mechanisms and incentives for energy efficiency/clean energy |
Examples: Cambridge City Council - https://www.cambridge.gov.uk/grants-and-incentives-for-improving-your-homes-energy-efficiency |
|
Invest in clean tech R&D |
Policy examples include tax credit claims for companies in the clean tech Research and Development (R&D) sector (UK) and establishing funding programs to support clean energy R&D initiatives. More info: IEA - https://www.iea.org/media/etp/tracking2017/TrackingCleanEnergyInnovationProgress.pdf |
|
Issue green bonds |
"Green bonds" were created to fund projects that have positive environmental and/or climate benefits. The majority of the green bonds issued are green “use of proceeds” or asset-linked bonds. Proceeds from these bonds are earmarked for green projects but are backed by the issuer’s entire balance sheet. There have also been green "use of proceeds" revenue bonds, green project bonds and green securitized bonds. Source: CBI - https://www.climatebonds.net/market/explaining-green-bonds |
|
Promote on-bill financing |
"On-bill financing" is a mechanism for financing clean energy and energy efficiency projects in buildings in which investments are re-paid through a line-item in the utility bill. Source: CNEE - https://spotforcleanenergy.org/wp-content/uploads/2016/03/9b01946799e4b5aa2ad36382efb3d1e4.pdf |
|
Provide green mortgages |
Under a "green mortgage," a bank or mortgage lender offers a house buyer preferential terms if they can demonstrate that the property for which they are borrowing meets certain environmental standards. Source: WGBC - http://www.worldgbc.org/news-media/what-are-green-mortgages-how-will-they-revolutionise-home-energy-efficiency |
|
Provide loans/guarantees for energy efficiency/clean energy |
Examples: Queensland Farmers' Federation - https://www.qff.org.au/wp-content/uploads/2016/11/QFF-EnergySavers-Factsheet.pdf |
|
Provide tax incentives for clean energy |
Source: KPMG - https://assets.kpmg/content/dam/kpmg/pdf/2014/09/taxes-incentives-renewable-energy-v1.pdf |
|
Support clean tech clusters/companies |
A "clean tech cluster" is a group of clean tech companies located in close geographic proximity in order to encourage greater collaboration and innovation. Clusters bring together innovators and businesses to take research into production. |
|
Implement carbon tax |
A carbon tax is a form of explicit carbon pricing directly linked to the level of carbon dioxide emissions. Source: World Bank - https://www.worldbank.org/content/dam/Worldbank/document/SDN/background-note_carbon-tax.pdf |
| Fossil fuel divestment | More info: Fossil Free Divestment - https://gofossilfree.org/divestment/what-is-fossil-fuel-divestment/ |
| Fossil fuel subsidies reform | More info: Friends of Fossil Fuel Subsidy Reform - http://fffsr.org/ IISD - https://www.iisd.org/gsi/subsidy-watch-blog/fossil-fuel-subsidies-and-reform-on-the-rise |
| Other, please specify |
Governance
| Climate action | Description / Additional information |
|---|---|
|
Collaborate with cities/local governments in reducing emissions/increasing resilience |
More info: Global Covenant of Mayors - https://www.globalcovenantofmayors.org/ |
|
Collaborate with national governments in reducing emissions/increasing resilience (e.g. development and delivery of NDC's) |
Example : Source -WWF http://awsassets.panda.org/downloads/ambition_paper_wwf_wwf_germanyv5.pdf |
|
Collaborate with other states/regions in reducing emissions/increasing resilience |
More info: Initiative for Climate Action Transparency - http://www.climateactiontransparency.org/icat-guidance/non-state-subnational-action/ |
|
Support and incentivize businesses in reducing emissions/increasing resilience |
More info: Deloitte - https://www2.deloitte.com/uk/en/pages/real-estate/articles/carbon-penalties-and-incentives-report.html |
| Support and incentivize citizens in adapting environmentally friendly practices | More
info: Conserve Energy Future - https://www.conserve-energy-future.com/15-easy-ways-to-become-environmentally-friendly.php |
| Complete a 2050 Pathways analysis (i.e. strategy for meeting mid-century GHG reduction goals) | More info: The Climate Group - https://www.theclimategroup.org/project/2050-pathways |
| Alignment with Sustainable Development Goals | More info: UNA-UK - https://www.sustainablegoals.org.uk/aligning-sdg-and-climate-action/ |
| Other, please specify |
Industry
| Climate action | Description / Additional information |
|---|---|
|
Improve energy efficiency of industrial processes |
|
| Promote industrial symbiosis/industrial ecology programs | More info: University of Surrey (PhD) - https://pdfs.semanticscholar.org/5275/9c96789f754cc80968d4f3af2540d4298457.pdf |
| Promote reduced packaging | More info: Less Waste - http://www.lesswaste.org.uk/reduce/think-packaging/ |
|
Support green manufacturing |
Green manufacturing is the application of green technology to curb the negative impacts of human involvement. Essentially is the introduction of environmental thinking into manufacturing processes, which involves transformation of industrial operations in using green energy, developing and selling green products and employing green processes in business operations. Source: Paul et al. / Procedia Materials Science 6 (2014) 1644 – 1649 |
| Implement green public/private partnerships with industry | More info: MPDI - https://www.mdpi.com/2071-1050/11/4/1087/pdf |
|
Support digitalization of industry |
The inclusion of IoT into manufacturing processes as well as artificial intelligence and sensors, among others, creating efficiency through digitalization. Source: World Economic Forum - http://reports.weforum.org/digital-transformation/wp-content/blogs.dir/94/mp/files/pages/files/wef1601-digitaltransformation-1401.pdf |
| Regulate / incentivize reduction in use of HFC's | More info: EPA - https://www.epa.gov/snap/reducing-hydrofluorocarbon-hfc-use-and-emissions-federal-sector-through-snap |
| Other, please specify |
Land Use
| Climate action | Description / Additional information |
|---|---|
|
Establish GHG reduction plan for LULUCF (e.g. REDD+, etc.) |
More info: UNFCCC - http://unfccc.int/land_use_and_climate_change/lulucf/items/1084.php |
|
Promote conservation efforts for natural areas |
Example: Oregon Department of Fish and Wildlife - http://www.oregonconservationstrategy.org/conservation-toolbox/conservation-in-urban-areas/ |
|
Promote sustainable forest management |
|
| Undertake strategic environmental assessment | More info: EC - http://ec.europa.eu/environment/eia/sea-legalcontext.htm |
|
Promote sustainable coastal ecosystem management |
More info: EC - http://ec.europa.eu/environment/integration/research/newsalert/pdf/coastal_zones_sustainable_management_46si_en.pdf |
|
Establish guidelines for siting renewable power |
Guidelines should optimize siting options (where to deploy renewable power), getting more out of infrastructure that has already been built, sites that optimize the use of the grid, use of brownfield sites. More info: EPA - https://www.epa.gov/sites/production/files/2015-04/documents/handbook_siting_repowering_projects.pdf |
| Other, please specify |
Transport
| Climate action | Description / Additional information |
|---|---|
|
Improve public transport services (e.g. adopt high speed rail, improve bus services, improve rail services) |
Example: CIVITAS - http://civitas.eu/measure/improving-public-transport-infrastructure |
|
Promote digitalization in the transport sector (e.g. real-time information) |
More info: Deloitte - https://www2.deloitte.com/content/dam/Deloitte/uk/Documents/bps/deloitte-uk-transport-digital-age.pdf |
| Promote active transport such as walking and cycling | More info: Active Living Research - https://activelivingresearch.org/sites/activelivingresearch.org/files/ALR_Review_ActiveTransport_January2016.pdf |
|
Switch freight from high carbon to low carbon transport |
Example: UK Department of Transport - https://www.gov.uk/government/uploads/system/uploads/attachment_data/file/552492/rail-freight-strategy.pdf |
|
Increase awareness/engage public on private transport measures |
More info: UN - https://sustainabledevelopment.un.org/content/documents/2375Mobilizing%20Sustainable%20Transport.pdf |
|
Install electric vehicle charging infrastructure (i.e. home, work, highways, etc.) |
Example: US Department of Energy - https://www.afdc.energy.gov/fuels/electricity_infrastructure.html |
| Provide incentives for zero-emission vehicles (e.g. purchase rebate, tax exemption) | More info: Gov.uk - https://www.gov.uk/plug-in-car-van-grants |
|
Promote alternative fuel production (e.g. biofuels, natural gas, hydrogen, etc.) |
Alternative fuels are transportation fuels that are not derived from petroleum, and they include ethanol, electricity, hydrogen, compressed or liquid natural gas, and gasoline and diesel derived from coal, natural gas, or biomass. Source: The National Academies Press (NAP) - https://www.nap.edu/read/18264/chapter/6 |
|
Set/strengthen standards for vehicles (e.g. for fuel economy GHG emissions, low carbon fuels) |
Example: https://ec.europa.eu/clima/policies/transport/vehicles/cars_en |
|
Set manufacturing requirements (e.g. zero-emission vehicle standard) |
"Manufacturing requirements" require automakers to produce a certain percentage of zero emission vehicles (ZEVs) by a given date (e.g. 16% of total vehicle sales by 2025). Source: ICCT - https://www.transportpolicy.net/standard/california-zev/ |
|
Switch to electric/hybrid vehicles in cars/taxis/government fleets |
More info: https://tfl.gov.uk/info-for/taxis-and-private-hire/emissions-standards-for-taxis#on-this-page-1 |
|
Switch to other lower-carbon fuel in cars/taxis/government fleets (e.g. biofuels, natural gas, hydrogen, etc.) |
More info: UN - https://sustainabledevelopment.un.org/content/documents/971430_Watson_Improving%20vehicle%20fuel%20economy%20to%20save%20money,%20reduce%20carbon%20emissions,%20and%20reliance%20on%20oil.pdf |
| ZEV Challenge Participants: progress towards procuring only zero-emission passenger vehicles for appropriate public fleets by 2030, or | More info: The Climate Group - https://www.theclimategroup.org/project/zev-challenge |
| converting all appropriate public fleet vehicles to zero-emission vehicles by 2030 | More
information: Parliament UK - https://publications.parliament.uk/pa/cm201719/cmselect/cmsctech/1454/145408.htm Example: Mayor of London - https://www.london.gov.uk/press-releases/mayoral/mayor-sets-out-londons-electric-vehicle-future |
| Other, please specify |
Waste
| Climate action | Description / Additional information |
|---|---|
|
Adopt source separation policies (e.g. collection for dry recyclables, organic compostable waste, etc.) |
More info: IEA Bioenergy - http://task37.ieabioenergy.com/files/daten-redaktion/download/Technical%20Brochures/source_separation_web.pdf |
|
Establish waste reduction/recycling plan |
Examples: Queensland Government - https://www.premiers.qld.gov.au/publications/categories/plans/waste-reduction-recycling-plan.aspx |
|
Increase awareness/engage public on waste reduction/recycling measures |
Examples: EPA - https://www.epa.gov/recycle/reducing-waste-what-you-can-do |
|
Install advanced thermal treatment/waste to energy |
More info: Atkins - http://www.atkinsglobal.co.uk/en-GB/angles/all-angles/advanced-waste-treatment-technologies |
|
Install anaerobic digestion |
"Anaerobic digestion" is the process by which organic matter such as animal or food waste is broken down to produce biogas and bio-fertilizer. This process happens in the absence of oxygen in a sealed, oxygen-free tank called an anaerobic digester. Source: CCAC - http://www.ccacoalition.org/ru/node/2279 |
|
Install landfill gas management/landfill gas to energy |
"Landfill gas to energy" captures landfill gas to prevent methane from entering the atmosphere and utilizes it as an energy source. Source: CCAC - http://www.ccacoalition.org/en/activity/landfill-gas-capture-and-use |
| Install mechanical biological treatment | More info: environment-ageny.gov.uk - https://assets.publishing.service.gov.uk/government/uploads/system/uploads/attachment_data/file/321606/LFTGN03.pdf |
|
Install municipal recycling points or centers (for residents or businesses) |
|
|
Install waste heat recovery |
More info: EPA - https://www.epa.gov/sites/production/files/2015-07/documents/waste_heat_to_power_systems.pdf |
|
Implement practices and policies to promote circular economy |
The "circular economy" aims to eradicate waste—not just from manufacturing processes, as lean management aspires to do, but systematically, throughout the life cycles and uses of products and their components. Source: McKinsey - https://www.mckinsey.com/business-functions/sustainability-and-resource-productivity/our-insights/moving-toward-a-circular-economy |
Reducing the municipal solid waste generation per capita |
More info: Resources for the Future - https://www.rff.org/publications/journal-articles/the-cost-of-reducing-municipal-solid-waste/ Example: C40 - https://www.c40.org/case_studies/c40-good-practice-guides-buenos-aires-municipal-solid-waste-reduction-project |
| Reducing the amount of municipal solid waste disposed to landfill and incineration and increase the diversion rate away from landfill and incineration | More info: Databuild - https://assets.publishing.service.gov.uk/government/uploads/system/uploads/attachment_data/file/319324/report316.pdf |
| Other, please specify |
Water
| Climate action | Description / Additional information |
|---|---|
| Install water efficiency measures | More info: Resource Efficient Scotland - https://www.resourceefficientscotland.com/sites/default/files/10-Step%20Good%20Practice%20Water%20Guide%20Resource%20Efficient%20Scotland.pdf |
|
Adopt wastewater to energy initiatives (e.g. methane recovery for reuse) |
More info: NREL - https://www.nrel.gov/docs/fy12osti/53341.pdf |
|
Install smart water meters |
"Smart water meters" use digital technology to enable a customer to see real time water consumption and cost in a way that might cause them to reduce their water consumption and become more efficient. Source: LBNL - https://energy.gov/sites/prod/files/2017/01/f34/Exploring%20the%20Energy%20Benefits%20of%20Advanced%20Water%20Metering.pdf |
|
Promote water recycling or reclamation |
Water reclamation is the treatment or processing of wastewater to make it reusable with definable treatment reliability and meeting appropriate water quality criteria; water reuse is the use of treated wastewater (or reclaimed water) for a beneficial purpose. Source: UNFCCC - https://www.ctc-n.org/technologies/water-recycling-and-reclamation |
| Other, please specify |
Healthcare
| Climate action | Description / Additional information |
|---|---|
| Support hospitals and public health systems to reduce GHG emissions (e.g. renewable energy, energy efficiency, reduce waste, etc.) | State and regional governments can support government-owned and private hospitals to reduce GHG emissions through actions including: adopting renewable energy and energy efficiency in hospitals, incorporating zero-emission vehicles (ZEV) into hospital fleets, creating climate smart operating rooms (e.g. low-GHG anaesthetic gases, recycling gas waste, etc.), low-carbon procurement of pharmaceuticals, medical devices, and food, and reducing hospital waste (i.e. food, water, etc.). |
| Support hospitals and public health systems to increase resilience to climate impacts (e.g. emergency response systems, microgrids, etc.) | State and regional governments can support government-owned and private hospitals to increase resilience to climate impacts through actions including: updating emergency response systems, installing micro-grids, and increasing distributed energy sources and energy storage capacity. |
| Take steps to better integrate health policy and climate policy within the government | With all the links that exist between climate change and health care, state and regional governments are beginning to consider potential interdependencies and synergies between the two fields when making policy decisions, including by fostering better collaboration between independent government agencies and finding ways to engage non-government climate and health stakeholders in the policymaking process. |
| Other, please specify |
Climate action on short-lived climate pollutants (SLCPs)
4.8 Do you measure your region-wide SLCPs (i.e. black carbon, CH4, O3, HFCs)? If so, please report the SLCPs measured and whether an environmental assessment of the effects of these SLCPs has been conducted.
Change from 2020
No change
Response Options
Please complete the following table:
| Region-wide SLCPs are measured | Select the SLCPs measured (only appears if 'Yes' is selected in column 1) | Environmental assessment of SLCPs conducted (only appears if 'Yes' is selected in column 1) |
|---|---|---|
Select from:
| Select all that apply:
| Select from:
|
Guidance
These questions assist CDP in understanding to what extent your regional government is aware of these pollutants and what actions have been taken to reduce them. SLCPs can be collectively defined as gases and particles that contribute to global warming and have a relatively short lifetime in the atmosphere of a few days up to approximately 12 years. These pollutants contribute to as much as 40% of current global warming and are also responsible for dangerous air pollution, with detrimental impacts on human health, agriculture and ecosystems. For more information on SLCPs, please visit the Climate and Clean Air Coalition (CCAC).
- Region-wide SLCPs are measured: Select "Yes" if you measure your region-wide SLCPs (i.e. black carbon, CH4, O3, HFCs). If you select "Yes" you will be presented with columns 2 and 3 requesting further information on the measured SLCPs. If you select "No" you will not be presented with columns 2 and 3.
- Select the SLCPs measured: Select which region-wide SLCPs you measure. A description of the listed SLCPs can be found in the explanation of terms below.
- Environmental assessment of SLCPs conducted: Select "Yes" if you have conducted an environmental assessment of the effects of your region-wide SLCPs. An environmental assessment refers to the process by which your regional government has evaluated the potential environmental impacts of SLCPs for your region. Environmental assessments are critical tools that can help identify ways to minimise mitigate or eliminate the impacts of SLCPs before the implementation of a plan, policy or project.
Explanation of terms
- Black carbon: It is emitted from various sources including diesel cars and trucks, residential stoves, forest fires, agricultural open burning and some industrial facilities. After being emitted, black carbon only remains in the atmosphere for a few days. More information about black carbon can be found here: https://www.epa.gov/air-research/black-carbon-research.
- Methane (CH4): Mainly comes from agriculture, including rice cultivation, manure management and livestock, oil and gas industry and municipal landfills. It has an atmospheric life of about 12 years. More information about methane can be found here: https://www.globalmethane.org/about/methane.aspx.
- Tropospheric ozone (O3): It is not directly emitted into the air but is rather formed by sunlight-driven oxidation of other ozone precursors, such as methane. It has a lifetime of a few days to a few weeks. More information about tropospheric ozone can be found here: https://www.eea.europa.eu/publications/TOP08-98/page004.html.
- Hydrofluorocarbons (HFCs): These are man-made greenhouse gases used in air conditioning, refrigeration, solvents, and aerosols. It can remain in the atmosphere for less than 15 years. More information about hydrofluorocarbons can be found here: http://www.ccacoalition.org/en/slcps/hydrofluorocarbons-hfc.
4.9 Do you have a region-wide plan to reduce SLCPs? If so, please provide details of your plan and attach it to this question.
Change from 2020
No change
Response Options
| Region-wide plan to reduce SLCPs | Sectors covered in your region-wide plans to reduce SLCP (only appears if 'Yes' to 'Region-wide plan to reduce SLCPs') | Is your region-wide plan to reduce SLCPs integrated into your broader region-wide mitigation policies and/or climate action strategy? (only appears if 'Yes' to 'Region-wide plan to reduce SLCPs') | Description |
|---|---|---|---|
|
Select from:
|
Select all that apply:
[Agriculture; Energy; Industry; Transport; Residential buildings; Commercial building; Waste; Other] |
Select from:
|
Text field |
Guidance
- Region-wide plan to reduce SLCPs: If you have a region-wide plan to reduce SLCPs select “Yes”; if you do not have a region-wide plan to reduce SLCPs select “No” and then report the reasons why not in the column ‘Description’.
- Sectors covered in your region-wide plans to reduce SLCPs: Please select the relevant sectors for your state/region. If you want to add other types of sectors that are not listed in the provided drop-down options, please select “Other” and specify the type of sector. The sectors of Agriculture, Energy, Industry, Transport, Buildings (commercial and residential) and Waste were identified by the World Health Organization (WHO) and the CCAC through the reducing global health risks through mitigation of short-lived climate pollutants report.
- Is your region-wide plan to reduce SLCPs integrated into your broader region-wide mitigation policies and/or climate action strategy: Please answer by selecting “Yes” or “No”. This rationale behind this question is to consider the mitigation of SLCPs holistically either through its inclusion in broader region-wide policies and/or climate action strategies. Please comment on the plan, detailing any progress towards achieving the plan's objectives and its level of integration within your broader region-wide mitigation policies and/or climate action strategy. Please attach any assessment or plans regarding your region-wide SLCPs.
- Description: Please comment on the plan, detailing any progress towards achieving the plan's objectives and its level of integration within your broader region-wide mitigation policies and/or climate action strategy. Please attach any assessment or plans regarding your region-wide SLCPs.
5. Risks and adaptation
Pathway diagram
This diagram shows the questions contained in this section. To access question-level guidance, use the menu on the left to navigate to the question.
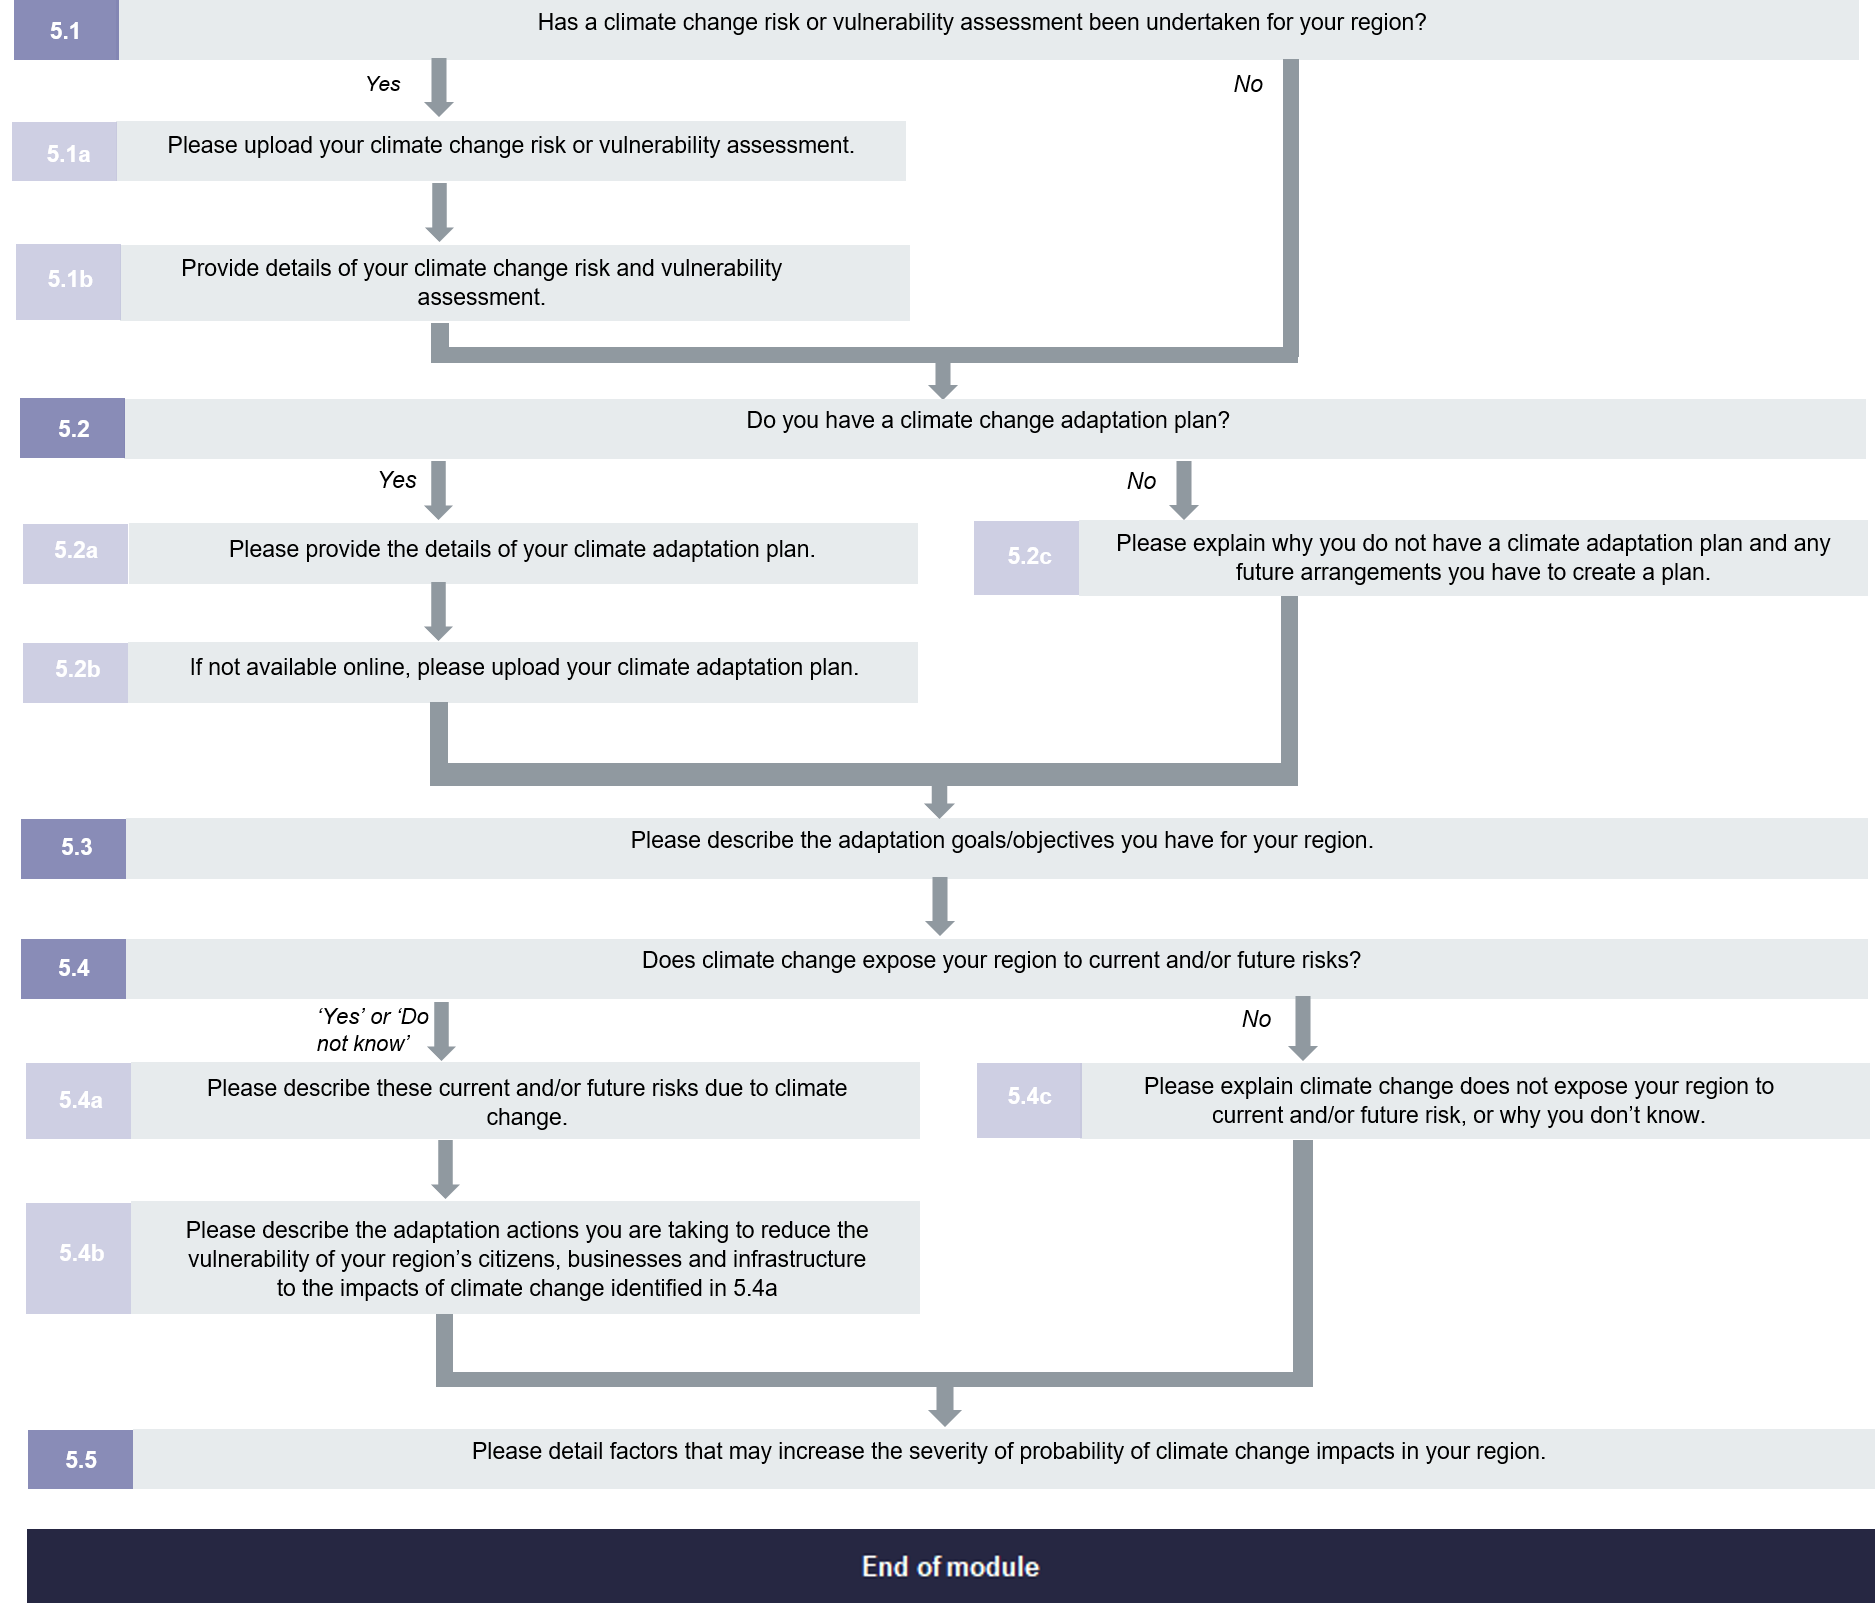
Assessment and planning
5.1 Has a climate change risk or vulnerability assessment been undertaken for your region?
Change from 2020
No change
Response Options
Select from:
- Yes
- In progress
- Intending to undertake in the next 2 years
- Not intending to undertake
Guidance
Indicate whether your region has undertaken a climate change risk or vulnerability assessment by selecting the most relevant option from the drop-down menu. If you select “Yes” or "In progress" you will be directed to questions 5.1a and 5.1b.
The effects of climate change might pose a significant risk to your region’s future development. A climate change risk or vulnerability assessment is a qualitative or quantitative scientific estimation the risks from or vulnerability to climate change. These assessments are most usually done within the context of a decision-making or planning process to address climate change impacts. Before developing an adaptation plan, it is important to understand how climate change is likely to affect your region - this is usually done by conducting a climate change risk or vulnerability assessment.
A vulnerability assessment is the analysis of the expected impacts, risks and the adaptive capacity of your region to the effects of climate change. Assessing the vulnerability of your region encompasses more than simple measurement of the potential harm caused by events resulting from climate change: it also includes an assessment of the region or sector's ability to adapt, sometimes referred to as "adaptive capacity".
To complete a vulnerability assessment, a region is likely to need to undertake the following steps:
- Decide the purpose and scope of your risk of vulnerability assessment
- Hazards faced by your region requires several steps:
- Identifying the hazards to which your region is (or has historically been) exposed
- Assessing the consequence and likelihood of the impact of these hazards on your region based on recent, expert-reviewed estimates where possible
- Selecting climate change scenarios outlining possible future climate in the region
- Understanding how the frequency and intensity of climate hazards will change under these scenarios
- Understanding your region’s exposure and sensitivity to climate hazards, and your capacity to adapt, requires several steps:
- Assessing previously identified current and future hazard exposure usually under two (or more) climate change scenarios
- Identifying the region’s critical assets and the relationships between them
- Identifying likely impacts from current and future hazards on the region’s critical assets
- Identifying strengths and weaknesses of the region’s adaptive capacity
- Assessing the vulnerability of the region, based on the combination of the possible impacts of climate change and the region’s adaptive capacity
A high-quality vulnerability assessment involves engagement with a broad range of stakeholders. It is important to recognize the diverse expertise that different stakeholders provide. It is particularly critical to acknowledge local community and traditional indigenous knowledge and to be aware of different perspectives and values. Broad engagement can result in identification of previously overlooked areas of vulnerability or in a more nuanced understanding of the root cause of vulnerabilities and hence better-targeted adaptation responses.
5.1a Please upload your climate change risk or vulnerability assessment.
Question dependencies
This question only appears if you select “Yes” in response to 5.1.
Change from 2020
No change
Response Options
Please attach your relevant document here.
Guidance
This question allows states and regions to directly upload climate change risk or vulnerability assessments. The reporting platform allows you to upload multiple documents.
5.1b Provide details of your climate change risk and vulnerability assessment.
Question dependencies
This question only appears if you select “Yes” or "In progress" in response to 5.1.
Change from 2020
No change
Response Options
Please complete the following table:
| Primary methodology | Sectors covered by the risk and vulnerability assessment | Comments |
|---|---|---|
|
Select from:
| Select all that apply:
|
Text field |
Guidance
Answering this question will provide important information for other regions which are assessing the physical risks from climate change for the first time and may be interested in the methodology you used. In the first field you can choose from a list of the most commonly used methodologies and types of methodologies on which your assessment is based. Select “Other, please specify” to report something not covered in the existing list of values. Selecting "Other, please specify" will allow you to write in the name of the methodology used. Select “Unknown” if you do not know on which methodology the assessment was based and select “No evaluation done” if a vulnerability assessment has not been carried out.
- Primary methodology: Please select the methodology you use to undertake climate change risk or vulnerability assessment from the options provided.
- Sectors covered by the risk and vulnerability assessment: Select all the relevant sectors that are covered by the risk and vulnerability assessment.
- Comments: Use the second field to provide more details on how the assessment was carried out. If you choose "Proprietary Methodology" or "Other, please specify" to describe your methodology in the first field, please provide details so that others may understand your approach.
The following resources provide further information about physical risks and the methodology of risk assessment:
- The IPCC Fifth Assessment Report (Working Group II: Impacts, Adaptation and Vulnerability)
- The OECD Strategic Environmental Assessment and Adaptation to Climate Change
- UNDP climate risk management methodologies
- ICLEI climate adaptation methodology (ADAPT)
- UK Climate Impacts Partnership Framework (UKCIP)
- World Bank Urban Risk Assessment (URA)
- A report of the Economics of Climate Adaptation (ECA) Working Group: Shaping climate resilient development: A framework for decision making
- An example of a national vulnerability assessment is the Swedish Commission on Climate and Vulnerability report titled Sweden facing climate change – threats and opportunities
- An example of an agency specific vulnerability and risk assessment methodology is the US Department of Transportation’s Federal Highways Administration Methodology.
5.2 Do you have a climate change adaptation plan?
Change from 2020
No change
Response Options
Select one of the following options:
- Yes
- No
Guidance
Please respond to indicate whether your region has produced an adaptation plan by selecting “Yes” or “No” from the drop-down menu. If you select “Yes” you will be directed to question 5.2a and 5.2b. If you select “No” you will be directed to question 5.2c.
Explanation of terms
A climate adaptation plan (also known as climate resilience plan) can be defined as a planned response across the region’s services and departments in order to address and manage future climate change risks. The aim of such a plan is to ensure that climate change risks are addressed in a preventive manner by putting in place a set of concrete measures to tackle those risks.
5.2a Please provide the details of your climate adaptation plan.
Question dependencies
This question only appears if you select “Yes” in response to 5.2.
Change from 2020
No change
Response Options
Please complete the following table:
| Title | Year of publication | Publication hyperlink | Priority areas covered |
|---|---|---|---|
|
Text field |
Drop-down list: 2000 – 2021 |
Text field |
Select all that apply:
|
Guidance
This is a table question with the following fields:
- Publication title: Please state the name of your climate adaptation plan.
- Year of publication title: Please state the year that your climate adaptation plan was published.
- Publication hyperlink: If you would like to provide a web link to your region’s climate adaptation plan,
please
add it in this field.
- Priority areas covered: Identify the priority areas of the RegionsAdapt initiative covered by your adaptation plan. Members of the RegionsAdapt initiative commit to take concrete action on adaptation in at least one of the key priority areas, but not necessarily all of them. For more information about RegionsAdapt, please click here. States and regions can select all thematic areas that apply.
5.2b If not available online, please upload your climate adaptation plan.
Question dependencies
This question only appears if you select “Yes” in response to 5.2.
Change from 2020
No change
Response Options
Please attach your relevant document here.
Guidance
This question gives you the opportunity to upload your region's climate adaptation plan. The reporting platform allows you to upload multiple documents.
5.2c Please explain why you do not have a climate adaptation plan and any future intentions you have to create a plan.
Question dependencies
This question only appears if you select “No” in response to 5.2.
Change from 2020
No change
Response Options
Please complete the following table. You are able to add rows by using the “Add Row” button at the bottom of the table.
| Reason | Please explain |
|---|---|
|
Select all that apply:
|
Text field |
[Add Row]
Guidance
Some regions have not created an adaptation plan for a variety of reasons. Others are still in the process of completing their adaptation plan. This question gives you the opportunity to explain why you have not created an adaptation plan. This question allows states and regions to select the reason for their lack of climate adaptation plan. Multiple reasons can be selected by adding a row in response to this question. This is a table question with the following fields:
- Reason: Please select all the reasons that apply from the options provided. Multiple reasons can be selected by adding a row in response to this question. Please select “Other, please specify” if you want to provide information on a different reason that cannot be categorized from the options provided.
- Please explain: Please use this field to explain the relevance of each selected reason in the context of your regional jurisdiction. If you have selected "Climate adaptation plan is in progress" then please provide information on the development of the plan and the expected year in which the plan will be completed. If applicable, please provide information if adaptation actions are included in other documents, such as territorial management plans, regional development plans, etc.
Example Response
| Reason | Please explain |
|---|---|
|
Adaptation is covered under main region strategy |
We do not have a dedicated a climate adaptation plan as it is part of our region’s master plan. |
|
Lack of resources/funding |
We do not have additional resources to develop a separate climate adaptation plan and that is why it is part of our region’s master plan. |
5.3 Please describe the adaptation goals/objectives you have for your region.
Change from 2020
No change
Response Options
This is an open text question.
Please note that when copying from another document into the disclosure platform, formatting is not retained.
Guidance
Your goals can be of any type. Please use the text field to provide as much explanation on what your main goals are for adaptation and the status of those goals. Your adaptation goals could include information on your region's overall strategy and objectives across the different thematic areas covered by your adaptation plan.
Case Study: Australian Capital Territory’s Climate Adaptation Strategy – Living with a Warming ClimateThe Australian Capital Territory (ACT) Climate Change Adaptation Strategy – Living with a Warming Climate (the Adaptation Strategy) supports the community, its city and the natural environment to become more resilient to the impacts from climate change to 2020. The ACT Government’s objectives are:
Reference: ACT Government (2016). ACT Climate Change Adaptation Strategy Living With A Warming Climate. Available online at: https://www.environment.act.gov.au/__data/assets/pdf_file/0004/912478/ACT-Climate-Change-Adaptation-Strategy.pdf |
Climate risks and adaptation actions
5.4 Does climate change expose your region to current and/or future risks?
Change from 2020
No change
Response Options
Select one of the following options:
- Yes
- No
- Do not know
Guidance
The IPCC defines risk as the potential for consequences where something of value is at stake and where the outcome is uncertain, recognizing the diversity of values. Risk is often represented as probability or likelihood of occurrence of hazardous events or trends multiplied by the impacts if these events or trends occur (IPCC, 2012). For this question, please report whether climate change presents significant physical risks to your region, by selecting “Yes”, “Do not know” or “No”. If you select “Yes” or "Do not know", you will be directed to questions 5.4a and 5.4b. If you select “No”, you will be directed to question 5.4c.
When identifying impacts from climate change, states and regions should think objectively of the ways in which changes in the climate conditions will affect their region’s ability to conduct business as usual. Information about impacts associated with climate change can be found on the website of the Intergovernmental Panel on Climate Change (IPCC), in the report by Working Group II, “Impacts, Adaptation and Vulnerability”.
5.4a Please describe these current and/or future risks due to climate change.
Question dependencies
This question only appears if you select “Yes” or "Do not know" in response to 5.4.
Change from 2020
No change
Response Options
Please complete the following table. You are able to add rows by using the “Add Row” button at the bottom of the table.
| Risk driver | Anticipated timescale | Estimated magnitude of potential impact | Estimated probability of impact | Impact description |
|---|---|---|---|---|
|
Select from:
|
Select from:
|
Select from:
|
Select from:
|
Text field |
[Add Row]
Guidance
This question asks you to detail the physical risks of climate change, which you expect to experience in your region, together with their anticipated timescales. Do not feel obliged to include every risk to the region - list only the most pertinent and important, for example, those that may have the biggest impact, magnitude or risk factor. Responses should be reported in the fields provided using the drop-down menus where appropriate, as detailed below:
- Climate change impacts: Please select the climate change impacts that are relevant for your region from the drop-down options provided. You can select more than one type of impact by adding new rows to the table. Please note that the risks you have selected in this question will be used in question 5.4b.
- Anticipated timescale: The field offers four choices for timescale:
Current - If your region is already experiencing the identified effect from climate change.
Short term - If you anticipate your region will experience the identified effect from climate change by 2025.
Medium term - If you anticipate your region will experience the identified effect from climate change between 2026 and 2050.
Long term - If you anticipate your region will experience the identified effect from climate change after 2051.
- Estimated magnitude of potential impact: CDP asks regions to assess their level of risk by estimating the potential impact from the anticipated effect of climate change, and in the following column the probability of that effect occurring. The categories of risk are general and all that is necessary is an estimate. Four options are available to describe the seriousness of the climate change impact selected:
Extremely serious - If you anticipate that the expected effect of climate change poses the highest level of potential concern to your region. For example, you might choose this option if you expect large storms to have a significant impact on your region within a short time period.
Serious - If you anticipate that the expected effect of climate change poses a significant level of concern to your region. For example, you might choose this option if you expect large storms to have a significant impact on your region within a medium time frame.
Less serious - If you anticipate that the expected effect of climate change will have a lower impact within a longer timescale.
Other - Please specify the level of seriousness for the selected climate change impact.
It is up to the region to determine its level of risk and to make judgments about priorities: for example, whether a high impact risk with a long term timescale constitutes a more serious risk than a low impact risk with an immediate timescale.
- Estimated probability of impact: CDP asks regions to assess their likelihood of risk by estimating the probability of that effect occurring. The categories of probability are general and all that is necessary is an estimate.
- Impact description: The final question field gives you an opportunity to describe individual impacts that could be affected by the physical climate change effects you have identified, including for example, agriculture, buildings, water, waste, transport, energy, communications/telecommunications or human health. It may be useful to state how the expected effects of climate change may affect each of these areas in detail. Some examples of impact descriptions are provided below.
Example Response
Example of climate change effects and potential impacts relevant to regions
- Higher average temperatures and more extreme heat waves:
Increased cooling loads (buildings)
Decreased efficiency of energy generating plants and transmission and distribution lines (energy infrastructure)
Increase in morbidity and mortality from at-risk populations to extreme heat (human health)
- Decrease in average annual rainfall:
Decreased water availability for hydroelectric power generation and for cooling water for thermal energy plants (energy)
Decreased potable water supply and resulting water use restrictions (water)
Increased potential for pipe breakage and failure of underground services due to soil / ground condition changes (water, waste)
- More intense precipitation events:
Increased likelihood of combined sewer overloads (waste)
Increased likelihood of landslide and landslip and resulting damage (buildings)
- Sea level rise:
Increased likelihood of service disruptions on freight and mobility infrastructure networks near coastal areas (marine terminals, airports, roads, rail) (transport)
Decreased efficacy of gravity fed wastewater and sewage systems in low-lying areas (waste)
Salinization of groundwater (water)
5.4b Please describe the adaptation actions you are taking to reduce the vulnerability of your region's citizens, businesses and infrastructure to the risks due to climate change identified in 5.4a.
Question dependencies
This question only appears if you select “Yes” or "Do not know" in response to 5.4.
Change from 2020
No change
Response Options
Please complete the following table. You are able to add rows by using the “Add Row” button at the bottom of the table.
| Risk driver | Adaptation action | Status of action | Action description |
|---|---|---|---|
|
Populated with selections from 5.4a column 1 |
Select from Appendix C
|
Select from:
|
Text field
|
[Add Row]
Guidance
This question only applies if you have answered "Yes" to question 5.4. Please note that you must have filled out question 5.4a before attempting to answer this question. This is a table question with the following fields:
- Climate change impact: Please describe a number of possible effects of climate change, which you have to select to mirror those selected from the drop-down list in question 5.4a.
- Adaptation action: Please detail the adaptation your region is taking in relation to the climate change risk which you identified, the values are listed in Appendix C.
- Status of action: This field is added to allow regions to select the most appropriate option from the drop-down list to describe the stage of implementation of the project or action.
- Action description: Please provide additional information about the adaptation action selected in the context of your region. This can include, for example, information on the avoided costs resulting from the adaptation action.
Example Response
| Risk driver | Adaptation action | Status of action | Action description |
|---|---|---|---|
|
Sea level rise |
Flood defenses – development and operation & storage |
Pre-implementation |
We are testing various sea walls and barriers around the port to prevent the low-lying areas from flooding. The most successful version will be rolled out region-wide. |
|
More frequent heat waves |
Shading in public spaces, markets |
Implementation |
Restaurants are able to expedite the cafe (outdoor seating) licensing process if they plant trees to provide shade in the public spaces around the location. |
5.4c Please explain why climate change does not expose your region to current and/or future risk, or why you do not know.
Question dependencies
This question only appears if you select “No” in response to 5.4.
Change from 2020
No change
Response Options
Please complete the following table:
| Reason | Please explain |
|---|---|
|
Select from:
|
Text field |
Guidance
This question provides options to explain the reason why climate change does not present physical risks for the region. This question is a table with the following fields:
- Reason: Please select the most appropriate reason for your response from the options provided in the drop-down list. Please select “Other, please specify” if you want to provide a different reason from the options provided. Please specify this reason in the text field provided.
- Please explain: Please provide a brief explanation as to the relevance of this reason in the context of your region.
5.5 Please detail factors that may increase the severity of probability of climate change impacts in your region.
Change from 2020
No change
Response Options
This is an open text question.
Please note that when copying from another document into the disclosure platform, formatting is not retained.
Guidance
A compounding factor is something that could intensify the impacts of climate change. These may include underlying conditions or characteristics of the region that may accentuate the severity. While a high level of predictability may be difficult, it is possible that climate change’s effects (e.g. extreme heat) may have increasing consequences due to compounding factors. These may include underlying conditions or characteristics of the region that may accentuate the severity. For example, it is understood that extreme heat raises the risk of wildfires, increasing the demand for water while simultaneously reducing its supply. Compounding factors could include terrain that is susceptible to wildfires or low annual rainfall.
6. Water security
Pathway diagram
This diagram shows the questions contained in this section. To access question-level guidance, use the menu on the left to navigate to the question.
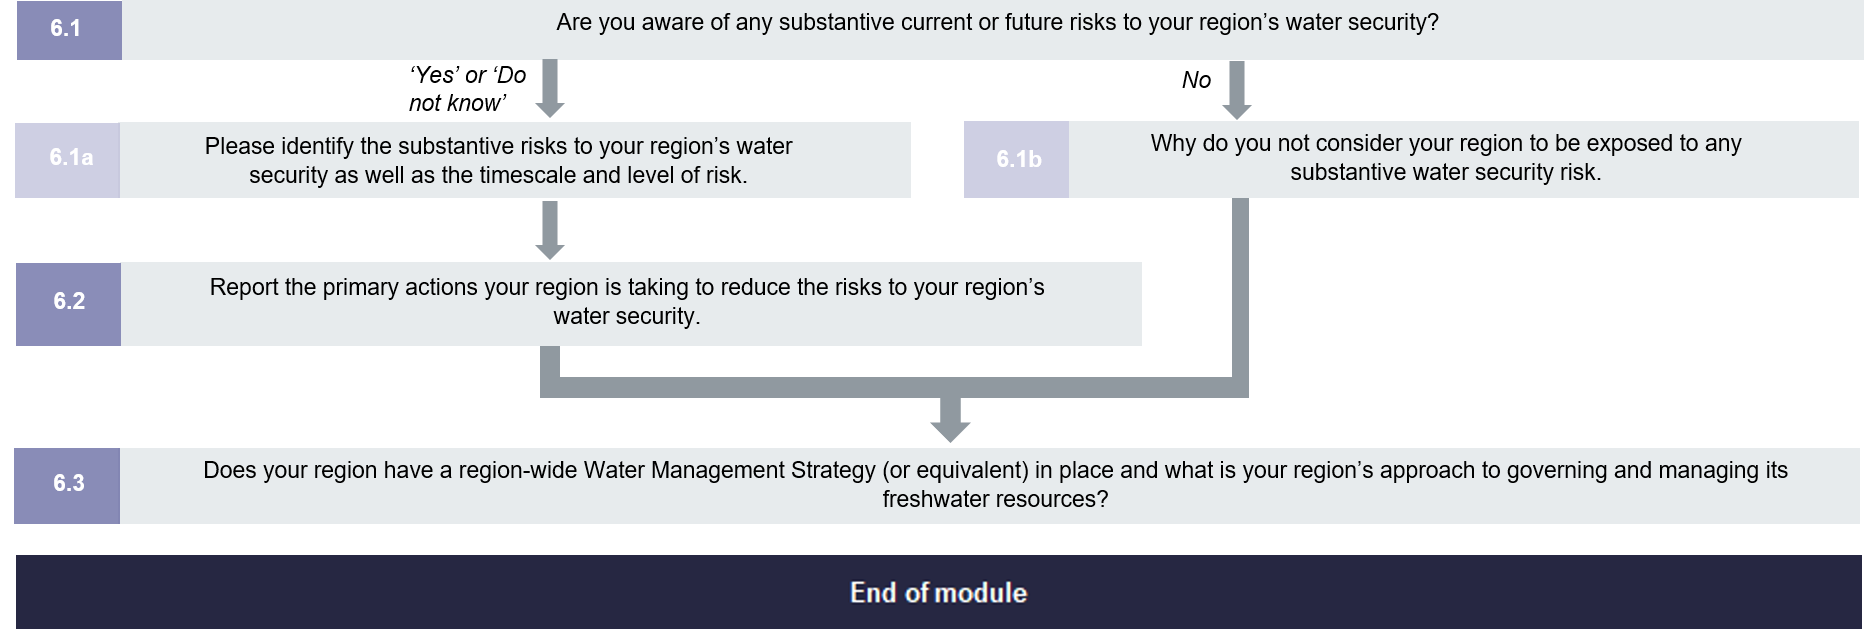
Water security risks
6.1 Are you aware of any substantive current or future risks to your region’s water security?
Change from 2020
No change
Response Options
Select one of the following options:
- Yes
- No
- Do not know
Guidance
This question asks you to consider risks to the region’s water security. These risks may or may not be caused or exacerbated by climate change. Consider risks that stem from physical impacts as well as those that may result from regulatory, economic or social settings. If you select “Yes” or “Do not know” you will be directed to questions 6.1a and 6.2. If you select “No” you will be directed to question 6.1b.
Water is an issue of critical importance for regional governments. Water connects across sectors, places and people, as well as geographic and temporal scales. In most cases, hydrological boundaries and administrative perimeters do not coincide. Water policy is inherently complex and strongly linked to domains that are critical for development, including health, environment, agriculture, energy, spatial planning, regional development and poverty alleviation. To varying degrees, countries have allocated increasingly complex and resource-intensive responsibilities to subnational governments, resulting in interdependencies across levels of government that require co-ordination to mitigate fragmentation and manage water supply risks effectively (OECD, 2015).
6.1a Please identify the substantive risks to your region’s water security as well as the timescale and level of risk.
Question dependencies
This question only appears if you select “Yes” or "Do not know" in response to 6.1.
Change from 2020
No change
Response Options
Please complete the following table. You are able to add rows by using the “Add Row” button at the bottom of the table.
| Water security risk drivers | Anticipated timescale | Estimated magnitude of potential impact | Estimated probability of impact | Risk description |
|---|---|---|---|---|
|
Select from:
|
Select from:
|
Select from:
|
Select from:
|
Text field |
[Add Row]
Guidance
This is a table question allowing states and regions to report on relevant water security risks. Multiple rows can be entered into the group using the ‘Add another’ button to the base of the group of question fields. This table has the following fields:
- Water security risks drivers: The field provides a drop-down list of options from which to select. Please select “Other, please specify” if you have a different water security risk drivers that can be categorized from the options provided.
- Anticipated timescale: Please choose the timescale by which you expect to experience social risks arising from climate change. The field offers four choices for timescale:
Current - if your region is already experiencing the identified effect.
Short term - if you anticipate your region will experience the identified effect by 2025.
Medium term - if you anticipate your region will experience the identified effect between 2026 and 2050.
Long term - if you anticipate your region will experience the identified effect after 2051.
- Estimated magnitude of potential impact: CDP asks regions to assess their level of risk by estimating the potential impact along with, in the following column, the probability of that effect occurring. The categories of risk are general and all that is necessary is an estimate. Four options are available to describe the seriousness of the climate change impact selected:
Extremely serious - If you anticipate that the expected effect of the water security risk poses the highest level of potential concern to your region.
Serious - If you anticipate that the expected effect of the water security risk poses a significant level of concern to your region. For example, you might choose this option if you expect large storms to have a significant impact on your region within a medium time frame.
Less serious - If you anticipate that the expected effect of the water security risk will have a lower impact within a longer timescale.
Other - Please specify the level of risk associated with the selected water security risk.
- It is up to the region to determine its level of risk and to make judgments about priorities: for example, whether a high impact risk with a long-term timescale constitutes a more serious risk than a low impact risk with an immediate timescale.
- Estimated probability of impact: CDP asks regions to assess their likelihood of risk by estimating the probability of that effect occurring. The categories of probability are general and all that is necessary is an estimate.
- Risk description: You may wish to provide more details on the potential impact experienced/anticipated, the level of risk, anticipated timescale and sectors affected. Please provide in this field any additional information about the water security risks drivers you selected. What constitutes a substantive current or future risk will vary between regions, you can explain here why this is a substantive risk in the context of your region
6.1b Why do you not consider your region to be exposed to any substantive water security risk?
Question dependencies
This question only appears if you select "No” in response to 6.1.
Change from 2020
No change
Response Options
Please complete the following table:
| Reason | Please explain |
|---|---|
|
Select from:
|
Text field |
Guidance
This question provides options to explain the reason why your region is not considered to be exposed to water security risks. This question is a table with the following fields
- Reason: Please select the most appropriate reason for your response from the options provided in the drop-down list. Please select “Other, please specify” if you want to provide a different reason from the options provided.
- Please explain: Please provide a brief explanation as to the relevance of this reason in the context of your region.
6.2 Report the primary actions your region is taking to reduce the risks to your region's water security.
Question dependencies
This question only appears if you select “Yes” or "Do not know" in response to 6.1.
Change from 2020
No change
Response Options
Please complete the following table. You are able to add rows by using the “Add Row” button at the bottom of the table.
| Water security risk drivers | Primary adaptation action | Status of action | Action description |
|---|---|---|---|
|
Populated with selections from 6.1a column 1 |
Select from:
| Select from:
|
Text field |
[Add Row]
Guidance
This question is relevant only if you have answered, “Yes” to 6.1. The purpose of this question is to understand the actions you are taking to reduce the risks to your water security which you have identified in question 6.1a.
- Water security risk drivers: The risk drivers selected in question 6.1a will be used in this field.
- Primary adaptation action: This field provides an opportunity to detail the adaptation action you are taking in relation to the water security risk, which you identified. If the adaptation action you are taking is not in the list provided, please select “Other, please specify” and specify the type of action in text field provided.
- Action description: In this field, please provide any additional information about the actions/measures you are taking to mitigate the drivers or reduce the impacts of the water security risk(s) identified. Describe how this action reduces the risks to your region's water security. Outline with government and non-government bodies are involved in the action (at the development implementation and monitoring phases)
6.3 Does your region have a region-wide Water Management Strategy (or equivalent) in place and what is your region's approach to governing and managing its freshwater resources?
Change from 2020
No change
Response options
Please complete the following table. You are able to add rows by using the “Add Row” button at the bottom of the table.
| Water Management Strategy (or equivalent) in place | Publication title and attach document | Description of approach to governing and managing freshwater resources |
|---|---|---|
|
Select from:
|
Text field | Text field |
Guidance
This is a table question with the following field:
- Water Management Strategy (or equivalent) in place: Please respond to indicate whether your region has produced a Water Management Strategy (or equivalent) by selecting "Yes", "In progress", "Intending to undertake in the next 2 years" or "Not intending to undertake" from the drop-down menu.
- Publication title and attach document: Please state the name of your Water Management Strategy (or equivalent) and attach the relevant document here.
- Description of approach to governing and managing freshwater resources: Please provide any further information on the governance structure and mechanisms in your region for monitoring and safeguarding freshwater resources. For example, you may wish to include details of:
- The governing body, the highest level committee or individual position with oversight of freshwater resources as a strategic resource for the region.
- The incorporation of water issues into regional bylaws/legislation.
- How water management and protection is embedded into the role of national/regional regulators or river basin authorities.
- Which government and non-government bodies are involved in decision making.
- The body responsible for the collection of hydrological data or pollution monitoring.
- Where the accountability lies for managing water risks and a secure potable water supply for the region.
- How water issues are integrated into other regional planning matters such as energy, finance, agriculture.
7. Forest
States and Regions from the following countries will be requested to answer the Forest module of the 2021 questionnaire.
Module overview
This part of the 2021 reporting guidance provides additional support and information for states and regions that are requested to answer the forest module. The information states and regional governments will provide in response to the forest module's questions will assist in making comparisons between other governments. It will also help inform lessons learned that could assist other states and regions on their way to tackling deforestation and/or forest degradation or it could help further refine the collection of data.
CDP is one of the Assessment Partners for the New York Declaration on Forests (NYDF), which is a voluntary and non-binding international declaration to take action to halt global deforestation. NYDF aims to cut natural forest loss in half by 2020 and strive to end it by 2030. There are over 200 endorsers (including national governments, subnational governments, multi-national companies, indigenous communities and non-government organizations), which committed to doing their part to achieve the NYDF's ten goals and follow its accompanying action agenda.
The forest module will allow state and regional governments to report data on all relevant drivers of deforestation and/or forest degradation within their jurisdiction. The selection of drivers of deforestation and/or forest degradation in question 7.2 as integral as it allows states and regions to disclose granular information on how their region is managing those deforestation / forest degradation drivers.
The forest module of the States and Regions questionnaire is expected to provide improved data on the relationship between mining and forests, contributing to future assessments related to NYDF's Goal 3 (Significantly reduce deforestation derived from other economic sectors by 2020: https://forestdeclaration.org/goals/#goal-3). CDP will generate new data that will identify key indicators for Goal 3's assessment framework. CDP will also provide insights on the role of states and regions in managing the impacts of deforestation and forest degradation resulting from non-agricultural divers including mining. The data that will be collected from the forest module will contribute to the thematic report as part of the NYDF Progress Assessment on Goal 3. For further information on the NYDF Progress Assessment, please visit:https://forestdeclaration.org/about/about-assessment
Pathway diagram
This diagram shows the questions contained in this section. To access question-level guidance, use the menu on the left to navigate to the question.
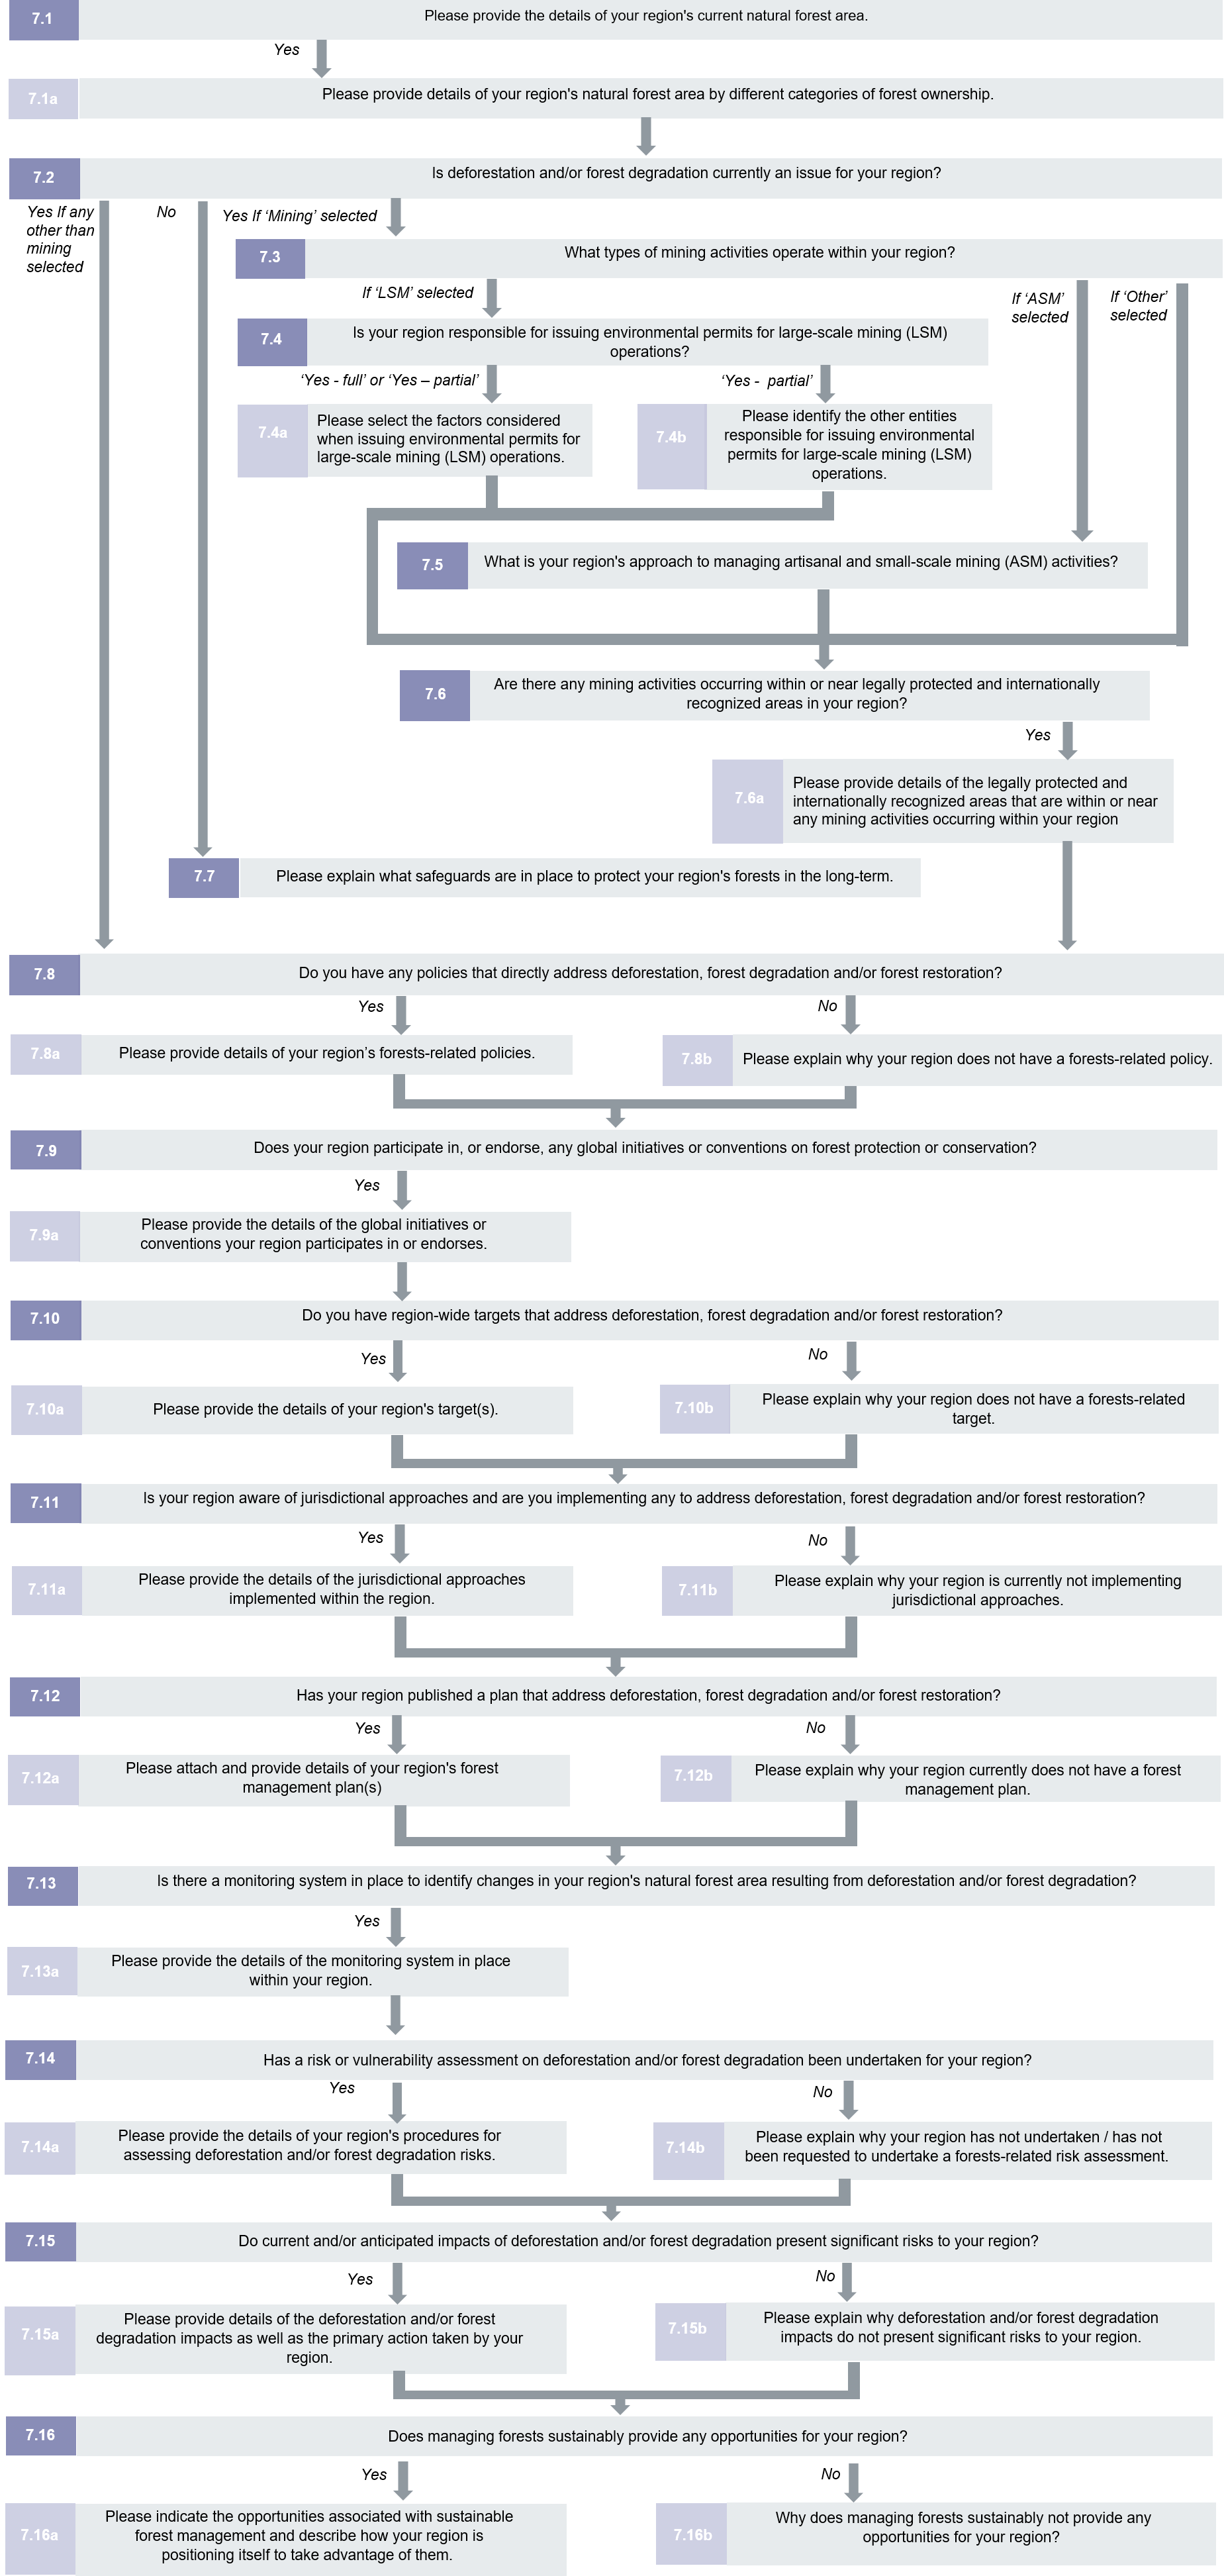
Current state
7.1 Please provide the details of your region's current natural forest area.
Change from 2020
No change
Response Options
| Current natural forest area (in square km) | Reporting year used for your region's natural forest area | Comments on the methodology used to collect data and quantify natural forest area | Can you provide information on the ownership or tenure rights associated with your region's natural forest area? |
|---|---|---|---|
| Numerical field | Numerical field | Text field | Select from:
|
Guidance
This is a table question, which asks for the details of your region’s natural forest area.
The table has the following fields:
- Current natural forest area (in square km): Please provide a numerical value to indicate the coverage of your region’s natural forest area.
- Reporting year used for your region’s natural forest area: Please state the relevant year for the data used for your region’s natural forest area.
- Comments on the methodology used to collect data and quantify natural forest area: This is an open text field with 2400 characters. Please provide any comments you have about your region’s methodology used to quantify your region’s natural forest area in this field.
- Can you provide information on the ownership or tenure rights associated with your region’s natural forest area: This question provides insight into the relationship between people with respect to forests by defining ownership and tenure rights within a jurisdiction. Clear and secure forest tenure is widely believed to be a key enabling condition for sustainable management of forests (Source:WRI, The Governance of Forests Initiative (GFI) Guidance Manual: A Guide to Using the GFI Indicator Framework). Please respond to this question, by selecting from one of the options provided. If “Yes” is selected in this question, a follow-up question will appear to allow states and regions to provide additional details on the region’s forest ownership and tenure rights.
Explanation of terms
- Natural forest area: A forest that is a natural ecosystem, i.e., possesses most of the native species composition, structure, and ecological function as a forest native to the given site. This includes:
- Primary forests that have not been subject to major anthropogenic impacts in recent history;
- Regenerated (second-growth) forests that were subject to major anthropogenic impacts in the past (e.g., by agriculture) but where the main causes of impact have ceased or greatly diminished, and the ecosystem has attained much of the species composition, structure and function of prior or other contemporary natural ecosystems;
- Managed natural forests where much of the ecosystem composition, structure, and ecological function exist in the presence of activities such as: (a) Harvesting of timber or other forest products, including management to promote high-value species, (b) Low intensity, small-scale cultivation within the forest, such as less-intensive forms of swidden agriculture in a forest mosaic; and
- Forests that have been partially degraded by anthropogenic causes (e.g., harvesting, fire, invasive species), but where the land has not been converted to another use and where degradation does not result in the sustained reduction of tree cover below the thresholds that define a forest, or sustained loss of other main elements of ecosystem composition, structure, and ecological function (Source: AFi, 2019).
- Forest tenure: For the purpose of the 2019 States and Regions forest module, ownership or tenure rights refer to the general concept of “forest tenure”. Forest tenure is concerned with who owns forestland and who uses, manages and makes decisions about forest resources. It determines who is allowed to use which resources, in what way, for how long, and under what conditions, as well as who is entitled to transfer those rights and how (Source: CIFOR - Forest tenure).
7.1a Please provide details of your region's natural forest area by different categories of forest ownership.
Question dependencies
This question only appears if you select "Yes” in response to 7.1.
Change from 2020
No change
Response Options
| Forest ownership category | Percentage of region's natural forest area characterized by the forest ownership category | Please explain |
|---|---|---|
| Public land administered by government | Numerical field | Text field |
| Public land designated for community and indigenous groups | Numerical field | Text field |
| Private land owned by communities and indigenous groups | Numerical field | Text field |
| Private land owned by individuals or firms | Numerical field | Text field |
| Other, please specify | Numerical field | Text field |
Guidance
The aim of this question is to collect information on the forest ownership and tenure rights associated with the region’s natural forest area. Clear ownership and management rights are vital for good governance and sustainable management of forests. Information about forest ownership helps us to better understand who controls forest management and use, and who benefits or loses from the variety of products and services provided by forests. When forest tenure is secure, it promotes capital investment by government and the private sector and has a role in the arrangement of incentives that motivate the sustainable use of forest resources (Source: FAO - Global Forest Resources Assessment 2015).
This table question has the following fields:
- Forest ownership category: This field requests data on two main categories; public (land administered by the government and/or land designated for community and indigenous groups) and private (land owned by communities and indigenous groups and/or land owned by individuals or firms). The supporting table below provides additional information on these categories. An additional row is included if the state or region would like to provide information on other categories of forest ownership.
- Percentage of region’s natural forest area characterized by forest ownership category: Please provide a numerical % value according to which your region’s natural forest area is designated under the relevant forest ownership categories.
- Please explain: This is an open text field with 2400 characters. Please provide any additional information you can provide relating to forest ownership and tenure rights within your region in relation to the categories provided. If you wish to provide information on other categories of forest ownership, please use this field to explain and provide additional context.
Forest tenure categories providing examples of public and private designations (Sources: FOA, Forest Tenure in Cambodia, Nepal and Vietnam).
| Category | Examples | Description |
|---|---|---|
| Public | Public land administered by the government | Typically includes all lands in the legal forest
estate that are owned and administered exclusively by the government and that
are not designated for use by communities and indigenous peoples (IPs). Note
that this category includes some protected areas and forest lands awarded as
concessions for logging, agri-industrial or silvicultural plantations, and
mining |
| Public | Public land designated for use by communities and IPs | Refers to forest lands set aside on a semi-permanent but conditional basis. In this category, governments retain ownership and entitlement to unilaterally negate local groups’ rights over entire areas. Local groups lack rights to sell or otherwise alienate land through mortgages or other financial instruments |
| Private | Private land owned by communities and IPs | Refers to forest lands where rights cannot be unilaterally terminated by a government without some form of due process and compensation. Private landowners typically (but not always) have rights to access, sell, or otherwise alienate, manage, withdraw resources and exclude outsiders |
| Private | Private lands owned by individual and firms | Includes those lands where the rights cannot be unilaterally terminated by a government without due process or compensation |
7.2 Is deforestation and/or forest degradation currently an issue for your region?
Change from 2020
No change
Response Options
| Deforestation/forest degradation is an issue for the region | Current drivers of deforestation and/or forest degradation* | Total current annual deforestation rate (%)** | Comments |
|---|---|---|---|
Select one from:
| Select all that apply:
*This column only appears if the response to the previous column is "Yes" |
Numerical field **Note this column will not appear if “No” is selected in column 1". |
Text field |
By selecting "Yes" in response to "Deforestation / forest degradation is an issue for the region", you will be able to disclose the relevant drivers of deforestation and/or forest degradation for your region. You will also be able answer the questions under “Forest policy and implementation” and “Forest risks, impacts and opportunities” sections of the Forest module to provide information on how your region is managing deforestation and/or forest degradation
Guidance
This question collects data on the key drivers or pressures of deforestation and/or forest degradation. The drivers available as options are based on the most common pressures causing deforestation and severe forest degradation in areas where the largest concentrations of forest loss or severe degradation are projected to take place until 2030 (i.e. deforestation fronts) as identified by the WWF’s Living Forests Report: Chapter 5.
This table question has the following fields:
- Deforestation / forest degradation is an issue for the region: Please select “Yes” or “No” depending on your region’s current situation. Please note that the default answer to this question is “Yes”. Please ensure that you review this and change the response if required. If you select “Yes”, you will be given the opportunity to disclose the key drivers of deforestation and/or forest degradation within your jurisdiction. This will also trigger the appearance of questions on the questions under the "Forest policy and implementation" and "Forest risks, impacts and opportunities" sections of the forest module. If you select “No”, only question 7.7 would appear to provide information on safeguards in place within your region to protect forests in the long-term.
- Current drivers of deforestation and/or forest degradation: Please select all the relevant drivers of deforestation/and or forest degradation within your region. You are able select multiple drivers in this question. The options you select will pre-populate in the other questions of the Forest module thereby allowing you to report data specific to the driver of deforestation/and or forest degradation selected.
About the drivers of deforestation and/or forest degradation
- The selection of these drivers will allow states and regions is integral if you wish to disclose information on how your region is managing deforestation / forest degradation. The drivers you select will pre-populate in the other questions (i.e. 7.8a, 7.10a, 7.11a, 7.12a, 7.14a and 7.15a) of the forest module thereby allowing you to report more granular and data specific information to the driver of deforestation/and or forest degradation selected.
- Selecting “Mining” as a driver will trigger the appearance of questions that are specific to mining activities (questions 7.3 to 7.6a). The data on collected on these questions mining in addition to mining-related information on the “Forest policy and implementation” and “Forest risks, impacts and opportunities” sections will directly contribute towards the assessment of Goal 3 of the New York Declaration on Forests.
- Total current annual deforestation rate (%): Please provide a numerical % value of the total deforestation rate within your region resulting from all the drivers selected.
- Comments:This is an open text field with 2400 characters. Please provide any comments you have about the selected drivers of deforestation/and or forest degradation within your region in this field. This could include information regarding the importance of each driver selected in addition to the importance of each of the relevant drivers of deforestation/degradation relative to each other. If “No” is selected as a response to the “Deforestation / forest degradation is an issue for the region” field, please provide some evidence or a reference on this.
Explanation of terms
- Deforestation: Loss of natural forest as a result of the following human activities: i) conversion to agriculture or other non-forest land use; ii) conversion to a plantation forest; or iii) severe and sustained degradation.
- Severe degradation constitutes deforestation even if the land is not subsequently used for non-forest land use
- Loss of natural forest that meets this definition is considered to be deforestation regardless of whether or not it is legally permitted.
- Deforestation signifies "gross deforestation" of a natural forest where "gross" is used in the sense of "total aggregate: without deduction for reforestation or other offsets" (Source: AFi, 2019).
- Forest degradation: Changes within a natural ecosystem that significantly and negatively affect its species composition, structure and/or function and reduce the forest’s capacity to support biodiversity, supply products and/or deliver ecosystem services. (Source: AFi, 2019).
7.3 What types of mining activities operate within your region?
Question dependencies
This question only appears if you select "Mining” in response to 7.2.
Change from 2020
No change
Response Options
Select all that apply:
- Large-scale mining (LSM)
- Artisanal or small-scale mining (ASM)
- Other, please specify
- Do not know
Guidance
This question only appears if “Mining” is selected as a driver of deforestation and/or forest degradation in response to question 7.2. For the purpose of this question, there are two main activities that you can select. These activities refer to the large-scale mining (LSM) and artisanal or small-scale (ASM) operations occurring within the region. LSM refers to the activity of major companies as well as to mid-tier and junior-level companies or to any formal company that complies with international performance standards. ASM is used in a broad sense to refer to all kinds of local and often informal mining activities (Adapted from: World Bank, Mining together: large-scale mining meets artisanal mining – a guide for action). You can select all relevant types of mining activities operating with your region. If “Other, please specify” is selected, please specify the type of mining activity that you are referring to.
7.4 Is your region responsible for issuing environmental permits for large-scale mining (LSM) operations?
Question dependencies
This question only appears if you select "Large-scale mining (LSM)” in response to 7.3.
Change from 2020
No change
Response Options
| Regional government responsibility over issuing environmental permits | Please explain |
|---|---|
Select from:
|
Text field |
Guidance
This question asks states and regions to disclose their overall responsibility towards issuing environmental permits for LSM operations. This is a table question with two fields:
- Regional government responsibility over issuing environmental permits: Please select the option that best describes your region’s responsibility over environmental permits for LSM operations. Please select “Yes – full” if your region is the sole entity in charge for issuing the permits, including defining the requirements, monitoring for compliance. On the other hand, please select “Yes – partial” if other entities or external stakeholders are involved. Selecting this option will trigger the appearance of question 7.4b, which requests information on those other stakeholders.
- Please explain: This is an open text field with 2400 characters. Please explain your region’s role and responsibility in issuing environmental permits for LSM operations.
Explanation of terms
Environmental permitting is a way of regulating specific industrial and commercial activities to protect the environment and human health, as defined by specific legislation or policies. For example, in England and Wales, the general requirements under the Mining Waste Directive for permitting includes (Adapted from: DEFRA 2010, Environmental Permitting Guidance: The Mining Waste Directive):
a) Ensuring that extractive waste is managed without endangering human health or causing pollution (Article 4(1)); and
b) Ensuring that the operator takes all the
necessary measures to prevent or reduce as far as possible any adverse effects
on the environment and human health (Article 4(2)). This includes:
- The management of waste facilities while operational;
- The management of waste facilities following closure; and
- The prevention of major accidents and limiting the consequences on the environment and human health.
7.4a Please select the factors considered when issuing environmental permits for large-scale mining (LSM) operations.
Question dependencies
This question only appears if you select "Yes - full” or "Yes - partial" in response to 7.4
Change from 2020
No change
Response Options
| Factors considered in the process for issuing environmental permits | Scope covered | Please explain |
|---|---|---|
Select from:
|
Select all that apply: See drop-down options below |
Text field |
[Add Row]
Scope covered drop-down options:
Environmental impacts
- Impacts on air quality
- Impacts on biodiversity
- Impacts on forests
- Impacts on water
- Greenhouse gas emissions
- Soil contamination
- Waste management
- Other, please specify
Socio-economic impacts
- Business development opportunities in other sectors
- Conflict and dispute resolution
- Employment opportunities
- Health and safety of the workers
- Health and well-being of the general public
- Indigenous people's legal and customary rights of ownership
- Other, please specify
Mining closure plans
- Establishing post closure monitoring systems
- Identification of post-mining land use and functions
- Clean-up of potentially contaminated areas
- Physical stabilization of terrain and return to useful purpose
- Rebuilding original ecosystems prior to mining disturbance
- Establishing new and stable ecosystems
- Other, please specify
Other, please specify
- Other, please specify
Guidance
This question allows states and regions to disclose different factors covered by their permitting process for LSM operations. This is a table question where you can provide information on the different factors covered by adding extra rows. This question has the following fields:
- Factors considered in the process for issuing environmental permits: Please select the option that best describes the factor(s) considered when issuing environmental permits within your region. If “Other” is selected, please specify the type of factor considered when issuing environmental permits. You can only select one factor at a time, so please add a row if you want to provide information on multiple factors.
- Scope covered: This field provides more specific information on the overall scope of the factor(s) considered when issuing environmental permits within your region. The options are tailored and would only appear depending on the selection of the factors in the previous field. For example, if “Environmental impacts” is selected as a factor that is considered when issuing environmental permits, then only the options relating to this specific factor would appear (e.g. Impacts on air quality, Impacts on biodiversity, Impacts on forests, are options that will appear when “Environmental impacts” is selected). You can select multiple options from the list provided and you can report additional information by selecting “Other, please specify”. Please note that when you select “Other, please specify” as a factor that is considered when issuing environmental permits, the only option available for the “Scope covered” field would only be “Other, please specify” as it will require you to specify and provide additional information relating to the factor you selected.
- Please explain: This is an open text field with 5000 characters. Please provide any explanation on the factors selected and how they influence the environmental permitting process for LSM operations within your region
Case study: British Columbia’s joint application information requirements for Mines Act and Environmental Management Act PermitsThe Mines Act (MA) permitting process, which for major mines is closely integrated with the Environmental Management Act (EMA) permitting process, includes geotechnical design and reclamation and closure plans.Mines Act permitting Applications for MA permits must include detailed designs for all project components and phases of mine life (exploration to closure). Proponents are expected to provide detailed engineering designs, management plans and monitoring programs. Planning needs to be sufficiently detailed in order to ensure the health and safety of mine personnel and the public, and the protection and reclamation of the land and watercourses affected by the mining activities. Environmental Management Act permitting There is emphasis on the environmental impact assessment (EIA) required as part of the application. Other requirements include:
|
7.4b Please identify the other entities responsible for issuing environmental permits for large-scale mining (LSM) operations.
Question dependencies
This question only appears if you select "Yes - partial” in response to 7.4.
Change from 2020
No change
Response Options
| Other entities responsible | Please explain their involvement |
|---|---|
Select all that apply:
|
Text field |
Guidance
This question collects information on other entities or external stakeholders responsible for issuing environment permits for LSM operations within your region. This question only appears if “Yes – partial” is selected for question 7.4.
This is a table question with the following fields:
- Other entities responsible: You can select multiple entities from the options provided in addition to disclosing more information on other entities by selecting “Other, please specify” and specifying the additional stakeholders involved.
- Please explain their involvement: This is an open text field with 2400 characters. Please provide any explanations as to how the entities/stakeholders selected are involved in the environmental permitting process for LSM operations within your region. These entities or external stakeholders might be involved in defining and reviewing the requirements for the permitting process as well as monitoring for compliance (especially if multiple policies and legislations are involved).
7.5 What is your region's approach to managing artisanal and small-scale mining (ASM) activities?
Question dependencies
This question only appears if you select "Artisanal or small-scale mining (ASM)” in response to 7.3.
Change from 2020
No change
Response Options
| Region's management approach to ASM | Please explain |
|---|---|
Select from:
|
Text field |
[Add Row]
Guidance
This question requests information on your region’s approach to address and manage ASM operations. ASM refers to mining by individuals and small groups and is generally informal in nature. Such activities are often informal and involves relatively simple forms of exploration, extraction, processing and transportation (Adapted from: Chatham House 2015, The impact of mining on forests).
This table question has two following fields:
- Region’s management approach to ASM: Please select the option(s) that best describe your region’s approach to managing ASM operations. In this field, you can only select one option at a time. If you wish to report additional information, please add a new row and select another option. If your region’s work on ASM is not included in the options provided, please select “Other, please specify” and specify the approach your region is taking.
- Please explain: This is an open text field with 2400 characters. Please provide any explanations as to how the select management approach is being taken by your region to address and manage ASM operations.
Case study: Intergovernmental Forum’s Mining Policy FrameworkExamples of ways of integrating informal ASM activities into the legal system: Creating clear legal frameworks and regulatory mechanisms to facilitate the organization of ASM, access to property rights and ensuing obligations for ASM; Providing technical support to build the capacity of government or other bodies tasked with regulating and supporting the sector. Examples of ways of integrating informal ASM activities into the formal economic system: Improving savings in the artisanal mining community, establishing more acceptable forms of financing and encouraging responsible investment; Strengthening the appropriateness, viability and transparency of policies and systems for collection, management and reinvestment of ASM revenue. Examples of reducing the social and environmental impacts of ASM: Providing technical training to improve productivity and to safeguard the environment, and developing, disseminating and enforcing regulations with a particular emphasis on safeguarding water sources, reducing deforestation; Promoting the inclusion of ASM in rural development and job creation policies such that, where desired and realistic, alternative livelihoods are promoted. Source: IGF Mining Policy Framework – Mining and Sustainable Development |
7.6 Are there any mining activities occurring within or near legally protected and internationally recognized areas in your region?
Question dependencies
This question only appears if you select "Large-scale mining (LSM)" or "Artisanal or small-scale mining (ASM)" or "Other, please specify" in response to 7.3.
Change from 2020
No change
Response options
Select from:
- Yes
- No
- Do not know
Guidance
This question focuses on whether states and regions are aware of the potential influence of mining operations on legally protected and internationally recognized areas. “Legally protected and internationally recognized areas” refer to protected areas that meets IUCN definition as well as the UNESCO World Heritage Sites, wetlands designated under the Ramsar Convention and Key Biodiversity Areas. If you select “Yes” to this question, a follow-up question (7.6a) will appear, which will request for the additional information regarding those legally protected and internationally recognized areas.
Explanation of terms
- Mining activities occurring from a project area are considered within legally protected/internationally recognized areas if there is total or partial overlap.
- Mining activities occurring from a project area are considered near legally protected/internationally recognized areas if the latter is within a mine’s overall area of influence.
- Mining project area: The total area of land owned, leased or managed by a mining company for a given mining project, including areas that have not been disturbed by mining-related activities.
- Mine’s area of influence: Refers to the area within which a mine may potentially directly and indirectly cause impacts. The area of direct impacts caused by mining-related activities includes the physical mine site footprint, areas adjacent to the project site that are affected by emissions and effluents, power transmission corridors, pipelines, borrow and disposal areas, etc., and the area affected by associated facilities that, although not part of the project that is being assessed, would not have been constructed in the absence of the project. Areas indirectly affected by mining-related activities include the physical footprint of non-project activities in the surrounding area that are caused or stimulated by the project plus the area affected by their emissions and effluents (Source: IRMA, 2018).
7.6a Please provide details of the legally protected and internationally recognized areas that are within or near any mining activities occurring within your region.
Question dependencies
This question only appears if you select "Yes” in response to 7.6.
Change from 2020
No change
Response Options
| Name of area | Type of area | Protected Area category (IUCN classification)* | Please explain |
|---|---|---|---|
| Text field | Select all that apply:
|
Select from:
*Note this column only appears if “Protected Area” is selected in the previous column. |
Text field |
[Add Row]
Guidance
This question only appears if “Yes” is selected to question 7.6. The aim of this question is to disclose information relating to those legally protected and internationally recognized areas with or mining activities in your region.
This question has the following fields:
- Name of area: This a text field to allow you to specify the name or how the area is commonly referred to.
- Type of area: Please select the option that best describes the area’s designation based on the definition of “legally protected and internationally recognized areas” provided. You can only select one type of area per row. If you have multiple legally protected and internationally recognized areas with or near mining activities in your region please add a new row to provide more information.
- Protected Area category (IUCN classification): This column only appears if “Protected Area” is selected in the previous field. Please select the management category that best describes the Protected Area reported. For more information, please see IUCN’s Protected Area Categories. If there is no information available regarding the category for your region’s Protected Area(s), please select “Don’t know” or “Not applicable” where relevant.
- Please explain: This is an open text field with 2400 characters. Please use this field to provide information regarding your region’s legally protected and internationally recognized areas including the methods and tools used by your region to assess their proximity to mining activities as well as any potential implications of mining activities (both LSM and/or ASM if relevant) to the areas reported.
Explanation of terms
- Protected area: A protected area is a clearly defined geographical space, recognized, dedicated and managed, through legal or other effective means, to achieve the long-term conservation of nature with associated ecosystem services and cultural values. (Source: IUCN, 2008). For the purposes of this CDP disclosure, only legally designated areas (i.e. designated by governments) are expected to be disclosed. The IUCN Protected Area Categories are as follows:
Ia) Strict Nature Reserve: Category Ia are strictly protected areas set aside to protect biodiversity and also possibly geological/geomorphical features, where human visitation, use and impacts are strictly controlled and limited to ensure protection of the conservation values. Such protected areas can serve as indispensable reference areas for scientific research and monitoring.
Ib) Wilderness Area: Category Ib protected areas are usually large unmodified or slightly modified areas, retaining their natural character and influence without permanent or significant human habitation, which are protected and managed so as to preserve their natural condition.
strong>II National Park: Category II protected areas are large natural or near natural areas set aside to protect large-scale ecological processes, along with the complement of species and ecosystems characteristic of the area, which also provide a foundation for environmentally and culturally compatible, spiritual, scientific, educational, recreational, and visitor opportunities.
III) Natural Monument or Feature: Category III protected areas are set aside to protect a specific natural monument, which can be a landform, sea mount, submarine cavern, geological feature such as a cave or even a living feature such as an ancient grove. They are generally quite small protected areas and often have high visitor value.
IV) Habitat/Species Management Area: Category IV protected areas aim to protect particular species or habitats and management reflects this priority. Many Category IV protected areas will need regular, active interventions to address the requirements of particular species or to maintain habitats, but this is not a requirement of the category.
V) Protected Landscape/ Seascape: A protected area where the interaction of people and nature over time has produced an area of distinct character with significant, ecological, biological, cultural and scenic value: and where safeguarding the integrity of this interaction is vital to protecting and sustaining the area and its associated nature conservation and other values.
VI) Protected area with sustainable use of natural resources: Category VI protected areas conserve ecosystems and habitats together with associated cultural values and traditional natural resource management systems. They are generally large, with most of the area in a natural condition, where a proportion is under sustainable natural resource management and where low-level non-industrial use of natural resources compatible with nature conservation is seen as one of the main aims of the area.
7.7 Please explain what safeguards are in place to protect your region's forests in the long-term.
Question dependencies
This question only appears if you select "No” in response to 7.2.
Change from 2020
No change
Response Options
| Safeguards in place | Web link with additional information about the safeguard | Explain how the safeguard is implemented |
|---|---|---|
Select one from:
| Text field | Text field |
[Add Row]
Guidance
The aim of this question is to collect information on how your region’s natural forest area is protected currently and any long-term interventions in place to manage deforestation and/or forest degradation. Please note that this is the only question that would appear if “Deforestation and/or forest degradation is not an issue for the region” is selected in question 8.2. Questions under the “Forest policy and implementation” and “Forest risks, impacts and opportunities” sections of the module will not appear.
This question has the following fields:
- Safeguards in place: Please select the option that best describes the safeguard or interventions in place for the long-term protection of your region’s forests from deforestation and/or forest degradation. Please select “Other, please specify”, if there is a specific safeguard in place within your region that is not covered by the options provided. You can only select only one option in this field. If you have multiple safeguards in place within your region, please add a new row to provide more information. This field is designed for the states and regions to specify different interventions in place to manage forests. In the scenario, where there are no forests in your region and you selected “Deforestation and/or forest degradation is not an issue for the region” as a response to question 8.2, please select the “Other, please specify” option and explain.
- Web link with additional information about the safeguard: if available, please provide the website link with additional contextual information on the safeguard your region has in place to protect forests in the long-term.
- Explain how the safeguard is implemented: This is an open text field with 2400 characters. Please use this field to explain how your region is implementing the reported safeguard(s).
Forest policy and implementation
7.8 Do you have any policies that directly address deforestation, forest degradation an/or forest restoration?
Question dependencies
This question only appears if you select "Yes" in response to 7.2.
Change from 2020
No change
Response Options
Select from:
- Yes
- No
- Do not know
Guidance
The aim of this question is to allow states and regions to report on all policies relating to the management of deforestation and/or forest degradation. When reporting on the policies, consider all levels of governance that may influence your region’s work on deforestation and/or forest degradation. These policies could cover those that are specific to the boundaries of the region or those from federal and national-levels. For example, state and regional governments play a vital role in making progress towards national reductions of emissions from deforestation and overall forest degradation as their efforts represent a vital link between pilot projects and full national implementation. If “Yes” is selected to this question, you will be asked to provide information on the policies you have that address deforestation and/or forest degradation. When reporting on the policy description and enforcement field, comment on how the region is contributing towards the implementation of the policies reported.
7.8a Please provide details of your region's forests-related policies.
Question dependencies
This question only appears if you select "Yes” in response to 7.8.
Change from 2020
No change
Response Options
| Policy name | Year enforced | Focus area | Drivers covered by the policy | Policy web link | Policy description and region's role in its enforcement |
|---|---|---|---|---|---|
| Text field | Numerical field | Select all that apply form:
|
Select all that apply: Options pre-populated from drivers selected in question 7.2 |
Text field | Text field |
[Add Row]
Guidance
This question allows states and regions to provide additional information policies relating to the management of deforestation and/or forest degradation. Forest policies deal specifically with forest resources and their management when treating: socio-economic factors related to increasing the performance of the sector; the role of the forest and tree resource in land use and rural development; and nature conservation and environmental protection (Source: FAO – Policy and legal aspects of sustainable forest management).
Forests must be managed in a much more interdependent and complex context which requires a partnership process among all major actors and beneficiaries. For this to happen, it is essential that forest policies recognize the diversity of interests related to forest conservation and utilization as well as the need to involve major interest groups in forest management decisions through consultations in which they can express their expectations and their role in sustainable forest management. The prevailing political system in each country will have to determine how divergent interests are to be harmonized and how the costs and benefits are to be shared among the main actors and beneficiaries. In addition, there is a need to adapt the policy framework regularly in response to real changes so that it continues to provide an effective incentive for the long-term management of forests for sustainable development(Source: FAO – Policy and legal aspects of sustainable forest management).
This is a table question with the following fields:
- Policy name: This a text field to allow you to specify the official name of the policy or how it is commonly referred to.
- Year enforced: The year in which the policy came into effect.
- Focus area: Please select all the relevant issues covered by the policy. You can select multiple options in this field.
- Drivers covered by the policy: Please select all the drivers that are covered by your policy. Please note that the options for this field will be dependent on the options selected in question 7.2.
- Policy web link: If available, please provide a website link for your policy.
- Policy description and region’s role in its enforcement: This is an open text field with 5000 characters. When reporting on this field, please provide a brief description of the policy and explain on how the region is contributing towards the implementation of the policies reported.
Explanation of terms
- Deforestation: Loss of natural forest as a result of the following human activities: i) conversion to agriculture or other non-forest land use; ii) conversion to a plantation forest; or iii) severe and sustained degradation.
- Severe degradation constitutes deforestation even if the land is not subsequently used for non-forest land use.
- Loss of natural forest that meets this definition is considered to be deforestation regardless of whether or not it is legally permitted.
Deforestation signifies "gross deforestation" of a natural forest where "gross" is used in the sense of "total aggregate; without deduction for reforestation or other offsets" (Source: AFi, 2019).
- Forest degradation: Changes within a natural ecosystem that significantly and negatively affect its species composition, structure and/or function and reduce the forest’s capacity to support biodiversity, supply products and/or deliver ecosystem services. (Source: AFi, 2019)
- Conversion: Human-induced change of a natural ecosystem to another land use or profound change in the natural ecosystem’s species composition, structure, and/or function.
- Deforestation is one form of conversion (conversion of natural forests)
- Conversion includes severe degradation or the introduction of management practices that result in a substantial and sustained change in the ecosystem's former species composition, structure, or function.
- Change to natural ecosystems that meets this definition is considered to be conversion regardless of whether or not it is legally permitte (Source: AFi, 2019).
- Restoration: the process of assisting the recovery of an ecosystem that has been degraded, damaged, or destroyed. The purpose of forest restoration is to restore a degraded forest to its original state - that is, to re-establish the presumed structure, productivity and species diversity of the forest originally present at a site (Source: FAO - Forest Restoration and Rehabilitation).
7.8b Please explain why your region does not have a forests-related policy.
Question dependencies
This question only appears if you select "No” or "Do not know" in response to 7.8.
Change from 2020
No change
Response Options
| Reason | Please explain |
|---|---|
Select one from:
|
Text field |
Guidance
This question allows states and regions to explain the primary reason as to why there are no policies on deforestation and/or forest degradation.This question is a table with the following fields:
- Reason: Please select the most appropriate reason for your response from the options provided in the drop-down list. Please select “Other, please specify” if you want to provide a different reason from the options provided. Please specify this reason in the text field provided.
- Please explain: Please provide a brief explanation as to the relevance of this reason in the context of your region.
7.9 Does your region participate in, or endorse, any global initiatives or conventions on forest protection or conservation?
Question dependencies
This question only appears if you select "Yes" in response to 7.2.
Change from 2020
No change
Response Options
Select from:
- Yes
- No, but intending to participate or endorse in the next 2 years
- No, not intending to participate or endorse
- Do not know
Guidance
Endorsing and taking part in recognized global initiatives indicates greater environmental stewardship and transparency. If “Yes” or “No, but intending to participate or endorse in the next 2 years” is selected, states and regions will be allowed to report on those initiatives and their overall involvement. CDP has listed the following initiatives/conventions:
7.9a Please provide the details of the global initiatives or conventions your region participates in or endorses.
Question dependencies
This question only appears if you select "Yes” or "No, but intending to participate or endorse in the next 2 years" in response to 7.9.
Change from 2020
No change
Response Options
| Global initiative/convention | Please describe your region’s involvement |
|---|---|
Please select one from:
|
Text field |
[Add Row]
Guidance
This questions requests states and regions to select the different initiatives and conventions they currently or plan to participate in or endorse and to provide information on how the region’s overall involvement. This question has the following fields:
- Global initiative/convention: Select the relevant initiative/convention(s) relevant to your region. Please note that you can only select one option at a time. If you wish to provide information on multiple initiative/conventions, please add another row to provide further details.
- Please select the “UN-REDD Programme” option if your region supports or is planning to support national REDD+ efforts. To see examples of subnational REDD+, please seeClimate Focus – The Why and How of Subnational REDD+
- Please select the “New York Declaration on Forests” option if your region is currently an endorser or is planning to be an endorser on the New York Declaration on Forests Global Platform.
- Please select the “Rio Branco Declaration” option if your region has pledged to the Declaration and is committed to reduce deforestation by 80% by 2020.
- Please select the “Bonn Challenge” option if your region has made a commitment and contributed towards the Bonn Challenge’s global effort to 150 million hectares of the world’s deforested and degraded land into restoration by 2020, and 350 million hectares by 2030.
- Please select the “UN Convention on Biological Diversity” option if the country your region is in has ratified the convention and your region is contributing to meet the convention’s main goals: conservation of biodiversity; sustainable use of biodiversity; fair and equitable sharing of the benefits arising from the use of genetic resources.
- Please select the “UN Convention to Combat Desertification” option if the country your region is in has ratified the convention and your region is contributing to meet the convention’s main goals of combatting desertification and mitigating the effects of drought through national action programs that incorporate long-term strategies supported by international cooperation and partnership arrangements.
- Please select the “World Heritage Convention” option if the country your region is in has ratified the convention and your region is contributing to meeting the convention’s aims to promote cooperation among nations to protect heritage around the world that is of such outstanding universal value that its conservation is important for current and future generations.
- Please select "Sustainable Development Goal 15" if your region is working towards achieving this goal to protect, restore and promote sustainable use of terrestrial ecosystems, sustainable manage forests, combat desertification, and halt and reverse land degradation and halt biodiversity loss.
- Please select "Nature4Climate" if your region works as part of this initiative and work with the initiative's partners to protect, restore and fund nature-based solutions.
- Please select the “Other, please specify” option if you wish to report another initiative/convention not included in the options provided. Please specify the name of the initiative/convention in the text field provided.
- Please describe your region’s involvement:Please provide additional information as to how your region is currently involved in or is planning to contribute to meeting the objectives of the initiative/convention(s) reported.
7.10 Do you have region-wide targets that address deforestation, forest degradation and/or forest restoration?
Question dependencies
This question only appears if you select "Yes” in response to 7.2.
Change from 2020
No change
Response Options
Select from:
- Yes
- No
- Do not know
Guidance
This question requests states and regions to disclose any targets they have to reduce deforestation and/or forest degradation. Clear performance targets at the subnational level help ensure that actors across sectors within a jurisdiction are striving toward the same goals through strategic policies, programs and initiatives, and that progress is measurable. They can also help jurisdictions leverage direct funding from international or corporate funders (Source: Earth Innovation – The State of Jurisdictional Sustainability). The development of subnational strategies with clear targets is vital for the achievement of national and global goals associated with reducing deforestation (Source: Forest500 – Analysis: forest and trading jurisdictions Measuring progress to zero deforestation).
Explanation of terms
- Region-wide: Refers to the scale in which the target is applied to which in this case the entire geographic area or within the boundaries of the region.
- Target: A specific measurable output set by your region to be achieved within a specific timeframe. Targets are usually small steps towards a wider and long-term goal and should be linked to a policy and/or commitment.
7.10a Please provide the details of you region's target(s).
Question dependencies
This question only appears if you select "Yes” in response to 7.10.
Change from 2020
No change
Response Options
| Target type | Drivers covered by the target | Target start year | Base year | Base year figure |
|---|---|---|---|---|
Select from:
|
Select all that apply: Options pre-populated from drivers reported in question 7.2. |
Numerical field | Numerical field | Numerical field |
| Target (%) | Target year | Percentage achieved so far | Please describe the target |
|---|---|---|---|
| Numerical field | Numerical field | Numerical field | Text field |
[Add Row]
Guidance
This question requests the details of your region-wide targets to reduce deforestation and/or forest degradation. You can provide information on multiple targets by adding extra rows. Please complete the fields that are only relevant for your target. Use the “Please describe that target” field of this question to provide additional information about your target (e.g. if you are unable to provide numerical values relating to your target). The information you provide in this question will assist in making comparisons between states and regions. It will also help inform lessons learned that could assist other states and regions on their way to tackling deforestation and/or forest degradation or it could help further refine the collection of data on region-wide targets relating to this topic. This is a table question with the following fields:
- Target type: Please select the type that best applies to your region’s own target. Please note that you can select one type of target at a time. The majority of the target types outlined for this question align with Sustainable Development Goal 15.2: By 2020, promote the implementation of sustainable management of all types of forests, halt deforestation, restore degraded forests and substantially increase afforestation and reforestation globally.
- Drivers covered by the target: Please select all the drivers that are covered by your target. Please note that the options for this field will be dependent on the options selected in question 7.2.
- Target start year: Please enter in numerical format the year in which your target was established or came into effect. This differs from your base year, which is used as a reference year from which to measure or compare progress made against your target.
- Base year: Please enter a numerical value for this field. Your base year is the reference year from which your measure your target against.
- Base year figure: Please enter a numerical value, which represents a reference point for your target. For example, if your target is to reduce deforestation, then the base year figure could be the total annual deforestation rate. Alternatively, if your target involves setting a specific forest cover then the base year figure could refer to the current natural forest cover within your region. Please provide details of the information and data used for the base year figure in the “Please describe the target” field.
- Target (%): Please enter the numerical value of your percentage reduction target, without commas and without the percentage symbol (%). If your target is not currently expressed as a percentage, please note your target reduction and other relevant detail in the “Please describe the target” field for this question.
- Target year: Please enter in numerical form the year by which you anticipate achieving your goal. Please note that the target year cannot be in the past.
- Percentage of target achieved so far: Please enter a numerical value for the percentage of your target that you have achieved since the “Target year start”, without commas and without the percentage symbol (%).
- Please describe the target: Please provide any other contextualizing information about your reduction target in this field including but not limited to:
- Any commitments or policies made by the region to which the target is linked
- Data used for the base year figure – e.g. total annual deforestation rate, natural forest cover during base year
- Website URL for your target if available
- Plans to meet the target
Explanation of terms
- Deforestation: Loss of natural forest as a result of the following human activities: i) conversion to agriculture or other non-forest land use; ii) conversion to a plantation forest; or iii) severe and sustained degradation.
- Severe degradation constitutes deforestation even if the land is not subsequently used for non-forest land use.
- Loss of natural forest that meets this definition is considered to be deforestation regardless of whether or not it is legally permitted.
Deforestation signifies "gross deforestation" of a natural forest where "gross" is used in the sense of "total aggregate; without deduction for reforestation or other offsets" (Source: AFi, 2019).
- Forest degradation: Changes within a natural ecosystem that significantly and negatively affect its species composition, structure and/or function and reduce the forest’s capacity to support biodiversity, supply products and/or deliver ecosystem services. (Source: AFi, 2019)
- Afforestation: Establishment of forest through planting and/or deliberate seeding on land that, until then, was not classified as forest, what implies a transformation of land use from non-forest to forest. (Source: FAO, 2015).
- Reforestation: Re-establishment of forest through planting and/or deliberate seeding on land classified as forest. (Source: FAO, 2015).
- Restoration: The process of assisting the recovery of an ecosystem that has been degraded, damaged, or destroyed. The purpose of forest restoration is to restore a degraded forest to its original state - that is, to re-establish the presumed structure, productivity and species diversity of the forest originally present at a site (Source: FAO - Forest Restoration and Rehabilitation)
- Forest cover target: A type of target that focuses on setting a proportion of the total geographical area to be forested. For example, India’s National Forest Policy has advocated a 33% forest cover, which informed the management of forests within Indian states (Source: Joshi et al. 2010 – National Forest Policy in India: Critique of Targets and Implementation).
7.10b Please explain why your region does not have a forests-related target.
Question dependencies
This question only appears if you select "No” or "Do not know" in response to 7.10.
Change from 2020
No change
Response Options
| Reason | Please explain |
|---|---|
Select from:
|
Text field |
Guidance
This question allows states and regions to explain the primary reason as to why they currently do not have region-wide targets to address deforestation and/or forest degradation. This question is a table with the following fields:
- Reason: Please select the most appropriate reason for your response from the options provided in the drop-down list. Please select “Other, please specify” if you want to provide a different reason from the options provided. Please specify this reason in the text field provided.
- Please explain: Please provide a brief explanation as to the relevance of this reason in the context of your region.
7.11 Is your region aware of jurisdictional approaches and are you implementing any to address deforestation, forest degradation and/or forest restoration?
Question dependencies
This question only appears if you select "Yes” in response to 7.2.
Change from 2020
No change
Response Options
Please select from:
- Aware of jurisdictional approaches and implementing
- Aware of jurisdictional approaches but currently not implementing
- Not aware of jurisdictional approaches
Guidance
This question asks states and regions about their awareness of the concept of jurisdictional approaches by selecting the option from the ones provided that best applies to them. Jurisdictional approaches follows a similar approach to conventional landscape approaches (a conceptual framework whereby stakeholders in a landscape aim to reconcile competing social, economic and environmental objectives) but takes place at a scale that matches the administrative boundaries of subnational or national governments (Source: Proforest - Introduction to landscape or jurisdictional initiatives in commodity agriculture).
Given the growing understanding of the complexity and systemic nature of the issues underlying continuing forest loss in many geographies, jurisdictional approaches are increasingly compelling. They contain the building blocks to align multiple stakeholders and incentive mechanisms around core, common interests such as responsible commodity production, improved economic growth and livelihood opportunities, and a resilient natural resource base that can continue to provide crucial ecosystem services (Source: WWF – Tackling Deforestation Through A Jurisdictional Approach).
While involvement of all stakeholders who can influence or are affected by deforestation and land use change is important, government commitment is key, including as a convenor, coordinator, legislator and enforcer. There is growing awareness of the value of ‘jurisdictional approaches’ with government leadership at sub-national level. Examples of such initiatives are emerging, where governments and their partners are actively seeking investment and partnerships to advance their goals, and where companies are starting to engage in jurisdictional approaches. Partnership and engagement in jurisdictional approaches can take many forms, supporting the goals and plans of the jurisdictional approach in different ways.
Explanation of term
- Jurisdictional approach: a type of landscape approach that is developed within the administrative boundaries of sub-national or national governments, usually with emphasis on the roles of government in public policy, land-use planning, law enforcement investment, or other functions (Source: AFi, 2019). Jurisdictional initiatives bring together the relevant stakeholders in a region, at the scale of jurisdiction, to agree goals, align activities and share monitoring and verification (Source: Proforest, 2016). For the purpose of the States and Regions 2020 questionnaire, the use of this term also considers jurisdictional approaches to zero-deforestation commodities (JA-ZDCs). JA-ZDCs lie at the intersection of three existing strategies to reduce forest loss and deforestation, along with improving the health and sustainability of rural and frontier economies: landscape approaches, jurisdictional approaches, and voluntary corporate sustainability efforts (Source: WWF, 2016).
7.11a Please provide the details of the jurisdictional approaches implemented within the region.
Question dependencies
This question only appears if you select "Aware of jurisdictional approaches and implementing” in response to 7.11.
Change from 2020
No change
Response Options
| Description of jurisdictional approach implemented | Focus area | Drivers addressed | International jurisdictional or landscape approach/method used | Does this approach follow a multi-stakeholder governance structure? | Does this approach include an assessment process? | Does this approach include a verification process? | Please explain |
|---|---|---|---|---|---|---|---|
| Text field | Select all that apply:
|
Select all that apply: Options pre-populated from drivers reported in question 7.2 | Select from:
|
Select from:
|
Select from:
| Select from:
|
Text field |
[Add Row]
Guidance
This question allows states and regions to provide additional information on the different projects or plans they implement, which follows a jurisdictional approach. It is widely recognized that the implementation of jurisdictional approach is necessary to address sustainability challenges, however, due to the nascent nature of this approach in the context of managing deforestation and/or forest degradation, it is vital to make information on this topic available. The disclosure of projects or plans that follow this approach through this question would aim to identify the current state of practice and understanding on this topic.
This table question has the following fields:
- Description of jurisdictional approach implemented: Please describe projects or plans that your region is implementing to address deforestation and/or forest degradation that follows jurisdictional approaches. This is an open text field with 5000 characters allowing you to provide details as to how the projects/plans you are implementing follows the definitions provided for the concept of jurisdictional approach. When describing the projects/plans following this approach consider the role of your region in its implementation.
- Focus area: Please select all the relevant issues that are addressed by the implemented jurisdictional approach. You can select multiple options in this field.
- Drivers addressed: Please select all the drivers that are addressed by jurisdictional approach. Please note that the options for this field will be dependent on the options selected in question 7.2.
- International jurisdictional or landscape approach/method used: Please select any relevant methodologies used for the jurisdictional approach implemented within your region. For more information on these methodologies, please refer to the links below. Please select "Other, please specify" and specify if your region uses a different methodology.
- Verified Sourcing Areas: https://www.idhsustainabletrade.com/verified-sourc...
- Commodities / Jurisdictions Approach: the Criteria and Expert Assessment Guidance
- LandScale: www.landscale.org
- Does this approach follow a multi-stakeholder governance structure: Please select if the jurisdictional approaches you report involves a wide array of activities led by different actors that may be interdependent and mutually reinforcing. Please use the explanation field to explain the actors involved and their role in the implementation of jurisdictional approaches.
- Does this approach include an assessment process: Please select if the jurisdictional approaches you reported is assessed. Please use the explanation field to explain the nature and process of its assessment.
- Does this approach include a verification process: Please select if the jurisdictional approaches you reported is verified. Please use the explanation field to explain the nature and process of its verification.
- Please explain: This is an open text field with 5000 characters that allows you to provide additional information on the jurisdictional approaches implemented especially its verification process and multi-stakeholder governance structure if relevant.
Explanation of terms
- Jurisdictional approach: a type of landscape approach that is developed within the administrative boundaries of sub-national or national governments, usually with emphasis on the role of government in public policy, land-use planning, law enforcement, investment, or other functions (AFi, 2019). Jurisdictional initiatives bring together the relevant stakeholders in a region, at the scale of jurisdiction, to agree goals, align activities and share monitoring and verification (Source: Proforest, 2016). For the purpose of the States and Regions 2020 questionnaire, the use of this term also considers jurisdictional approaches to zero-deforestation commodities (JA-ZDCs). JA-ZDCs lie at the intersection of three existing strategies to reduce forest loss and deforestation, along with improving the health and sustainability of rural and frontier economies: landscape approaches, jurisdictional approaches, and voluntary corporate sustainability efforts (Source: WWF, 2016).
- Deforestation: Loss of natural forest as a result of the following human activities: i) conversion to agriculture or other non-forest land use; ii) conversion to a plantation forest; or iii) severe and sustained degradation.
- Severe degradation constitutes deforestation even if the land is not subsequently used for non-forest land use.
- Loss of natural forest that meets this definition is considered to be deforestation regardless of whether or not it is legally permitted.
Deforestation signifies "gross deforestation" of a natural forest where "gross" is used in the sense of "total aggregate; without deduction for reforestation or other offsets" (Source: AFi, 2019).
- Forest degradation: Changes within a natural ecosystem that significantly and negatively affect its species composition, structure and/or function and reduce the forest’s capacity to support biodiversity, supply products and/or deliver ecosystem services. (Source: AFi, 2019)
- Conversion: Human-induced change of a natural ecosystem to another land use or profound change in the natural ecosystem’s species composition, structure, and/or function.
- Deforestation is one form of conversion (conversion of natural forests)
- Conversion includes severe degradation or the introduction of management practices that result in a substantial and sustained change in the ecosystem's former species composition, structure, or function.
- Change to natural ecosystems that meets this definition is considered to be conversion regardless of whether or not it is legally permitte (Source: AFi, 2019).
- Restoration: The process of assisting the recovery of an ecosystem that has been degraded, damaged, or destroyed. The purpose of forest restoration is to restore a degraded forest to its original state - that is, to re-establish the presumed structure, productivity and species diversity of the forest originally present at a site (Source: FAO - Forest Restoration and Rehabilitation).
- Assessment: This involves having the means to track, evaluate and monitor progress relating to ecosystems, human well-being, governance and production associated with jurisdictional approaches. This could be done through a set of indicators and performance metrics. For example, jurisdictional approaches that use the LandScale method incorporates as assessment framework to provide a holistic foundation for assessing sustainability that can be tailored to different landscape contexts (see LandScale, 2019for more information).
- Verification: Assessment and validation of compliance, performance, and/or actions relative to a stated commitment, standard, or target. Verification processes typically utilize monitoring data but may also include other sources of information and analysis (Source:AFi, 2019).
- Multi-stakeholder governance: A governance structure that seeks to bring stakeholders together to participate in the dialogue, decision making, and implementation of solutions to common problems or goals.
Case study: Examples of jurisdictional approachesMato Grosso’s Produce, Conserve and Include strategy At the Paris COP21 conference, Governor Pedro Taques announced the state’s new Produce, Conserve and Include (PCI) strategy under which the government and all relevant stakeholders across the state would set and implement joint targets for production of soy and beef, conservation of forest cover, and inclusion of all segments of society. In the following months, a multi-stakeholder process articulated timebound goals for each of the strategy’s three prongs. Through this evolution, the PCI’s vision emerged: increased commodity production through intensification of production on already-cleared land; protection of remaining forests and restoration of forests cleared above the amount allowed by law; participation by family farms, indigenous peoples, and other traditional communities in the state’s development, leading to increased living standards. Acre: Using REDD+ as a tool for consolidating a green economy Acre’s jurisdictional initiative is overseen and managed by multi-stakeholder councils comprised of governmental and non-governmental organizations. An important innovation in this regard is the Commission for Validation and Monitoring, which is made up of four civil society organizations and four governmental organizations. Another avenue for non-governmental involvement was an extensive and highly acclaimed public consultation process used to develop the SISA law. Forest conservation will result from a comprehensive legislative and policy framework that creates substantial incentives to direct development activities in a forest-friendly manner. The state government is promoting income-generating activities that are not premised on clearing forested areas such as: fish farming, Brazil nut processing, manufacturing, wood flooring and furniture production using sustainably managed timber, and reforestation with rubber, acai, and other native species Source: WWF – Tackling Deforestation Through A Jurisdictional Approach |
7.11b Please explain why your region is currently not implementing jurisdictional approaches.
Question dependencies
This question only appears if you select "Aware of jurisdictional approaches but currently not implementing” in response to 7.11.
Change from 2020
No change
Response options
| Reason | Please explain |
|---|---|
Select from:
| Text field |
[Add Row]
Guidance
This question allows states and regions to explain the reasons as to why they are not implementing jurisdictional approaches. This question is a table with the following fields:
- Reason: Please select the option from the drop-down that describes the reasoning to your response. Please select “Other, please specify” if you want to provide a different reason from the options provided. Please specify this reason in the text field provided. Please note that you can provide information on other reasons as to why your region is currently not implementing jurisdictional approaches by adding a new row.
- Please explain: Please provide a brief explanation for this reason and its relevance in the context of your region.
7.12 Has your region published a plan that address deforestation, forest degradation and/or forest restoration?
Question dependencies
This question only appears if you select "Yes” in response to 7.2.
Change from 2020
No change
Response Options
Select from:
- Yes
- No
- Intending to publish in the next 2 years
- Do not know
Guidance
This question allows states and regions to explain if they have considered or are planning to act on deforestation and/or forest degradation by selecting one from the options provided. The role of forest management planning is to determine and express the objectives of forest management in a specified area of forest and to set out the steps to be taken to achieve those objectives.
Explanation of term
Forest management plan: A document that translates forest policies into a coordinated program for a forest management unit and for regulating production, environmental and social activities for a set period of time through the use of prescriptions specifying targets, action and control arrangements (Source: FAO - Guidelines for forest management planning).
Case study: About Forest Management PlanningPlanning is an active process requiring careful thought about what could or should happen in the future and involves the coordination of all relevant activities for the purpose of achieving specified goals and objectives. Planning is an integral component of forest management. It is used for determining and expressing the goals and objectives that government and other actors have, and for deciding the targets and steps that should be taken in order to achieve those objectives.Planning need not be a complicated process, but it requires clear objectives, which a government or other group aims to achieve. It requires imagination and a willingness to consider all points of view having relevance to a given situation. The planning process should lead to the formation of a balanced outlook from which proposals for effective management can be written. An element of flexibility is desirable and necessary in order to cope with unforeseen events, which could affect the achievement of the objectives. A range of information is used in planning to evaluate the benefits and drawbacks of alternative courses of action, which enables preferred options to be determined, coordinated with other activities, and expressed in writing. Information should be of good quality. Information of questionable quality should either be discarded or, if used, it should be noted that it is of poor quality and one of the activities of the plan should be acquiring better quality information. Source: FAO – Guidelines for forest management planning Forest management planning is important for many reasons. For example, it can:
|
7.12a Please attach and provide details of your region's forest management plan(s).
Question dependencies
This question only appears if you select "Yes” in response to 7.12.
Change from 2020
No change
Response Options
| Publication title and attachment | Year of publication | Focus area | Drivers covered by the plan | Stage of implementation | Please explain the process for implementing the plan |
|---|---|---|---|---|---|
| Text field | Numerical field | Select all that apply:
|
Select all that apply: Options pre-populated from drivers reported in question 7.2 |
Select from:
|
Text field |
[Add Row]
Guidance
This question allows states and regions to provide the details of their plans to address deforestation and/or forest degradation. The question also allows states and regions to upload their plans. This is a table question with the following fields:
- Publication title and attachment: This a text field to allow you to specify the official name of the policy or how it is commonly referred to. In addition, you can attach the plan by clicking the upload icon.
- Year of publication: Please state the year that your forest management plan was published.
- Focus area: Please select all the relevant issues that are covered by the plan. You can select multiple options in this field.
- Drivers covered by the plan: Please select all the drivers that are covered by your policy. Please note that the options for this field will be dependent on the options selected in question 7.2.
- Stage of implementation: Indicate the extent to which your region has implemented its forest management plan by selecting the most applicable response from the following list of values:
- Plan developed but not implemented – plan to implement actions has been developed and implementation tools have been identified.
- Plan being implemented – if your region has begun to implement actions from the forest management plan (execution).
- Implementation complete – if the actions identified in the plan have been fully implemented.
- Plan under development – your region has identified a vision and goals; and begun to organize resources to develop a plan.
- Plan update in progress – if your region has begun to update the forest management plan based on the progress and success of actions that have been executed.
- Other – if your plan is under a different stage of implementation that is not categorized by the options provided.
- Please explain the process for implementing the plan: This is an open text field with 2400 characters. Please provide additional information about your plan(s) to address deforestation and/or forest degradation, including its implementation process (current or planned). Additional information on what a forest management should specify includes (Source: FAO - Global Forest Resources Assessment 2015):
- The forest protection operations to be carried out.
- The forest development operations to be carried out, including silviculture.
- Other matters which are necessary or appropriate in order to implement management objectives effectively. This could include forest inventory, mapping, technical and social surveys, and public consultation. A management plan to be applied to State or private forest land should be approved by the Ministry responsible for forestry or other specified authority.
Explanation of terms
- Forest management plan: A document that translates forest policies into a coordinated program for a forest management unit and for regulating production, environmental and social activities for a set period of time through the use of prescriptions specifying targets, action and control arrangements (Source: FAO - Guidelines for forest management planning.
- Deforestation: Loss of natural forest as a result of the following human activities: i) conversion to agriculture or other non-forest land use; ii) conversion to a plantation forest; or iii) severe and sustained degradation.
- Severe degradation constitutes deforestation even if the land is not subsequently used for non-forest land use.
- Loss of natural forest that meets this definition is considered to be deforestation regardless of whether or not it is legally permitted.
Deforestation signifies "gross deforestation" of a natural forest where "gross" is used in the sense of "total aggregate; without deduction for reforestation or other offsets" (Source: AFi, 2019).
- Forest degradation: Changes within a natural ecosystem that significantly and negatively affect its species composition, structure and/or function and reduce the forest’s capacity to support biodiversity, supply products and/or deliver ecosystem services. (Source: AFi, 2019)
- Conversion: Human-induced change of a natural ecosystem to another land use or profound change in the natural ecosystem’s species composition, structure, and/or function.
- Deforestation is one form of conversion (conversion of natural forests)
- Conversion includes severe degradation or the introduction of management practices that result in a substantial and sustained change in the ecosystem's former species composition, structure, or function.
- Change to natural ecosystems that meets this definition is considered to be conversion regardless of whether or not it is legally permitte (Source: AFi, 2019).
- Restoration: the process of assisting the recovery of an ecosystem that has been degraded, damaged, or destroyed. The purpose of forest restoration is to restore a degraded forest to its original state - that is, to re-establish the presumed structure, productivity and species diversity of the forest originally present at a site (Source: FAO - Forest Restoration and Rehabilitation).
7.12b Please explain why your region currently does not have a forest management plan.
Question dependencies
This question only appears if you select "No” or "Intending to publish in the next 2 years" in response to 7.12.
Change from 2020
No change
Response Options
| Reason | Please explain |
|---|---|
Select one from:
|
Text field |
Guidance
This question allows states and regions to explain the primary reason as to why there are no plans to address deforestation and/or forest degradation. This question is a table with the following fields:
- Reason: Please select the most appropriate reason for your response from the options provided in the drop-down list. Please select “Other, please specify” if you want to provide a different reason from the options provided. Please specify this reason in the text field provided.
- Please explain: Please provide a brief explanation for this reason and its relevance in the context of your region.
7.13 Is there a monitoring system in place to identify changes in your region's natural forest area resulting from deforestation and/or forest degradation?
Question dependencies
This question only appears if you select "Yes” in response to 7.2.
Change from 2020
No change
Response Options
Select one from:
- Yes
- No
- Do not know
Guidance
This question allows states and regions to provide information on monitoring systems in place within their jurisdictions. The need to be able to accurately monitor forest cover and quality is crucial to understanding the costs of deforestation and/or forest degradation. Forest monitoring could include measurements of certain parameters of forests (physical, chemical, and biological) to determine baselines to detect and observe changes over time. Without monitoring and the robust statistics, understanding the loss of biodiversity and reduction of carbon sequestration capacity that results from deforestation becomes much more difficult (Adapted from: Global Forest Atlas – Forest Monitoring).
Explanation of term
- Monitoring: an on-going function that used the systematic collection of data on specific indicators to assess and document the extent to which actions, progress, performance, and compliance are being carried out or achieved (Source: AFi, 2019)
7.13a Please provide the details of the monitoring system in place within your region.
Question dependencies
This question only appears if you select "Yes” in response to 7.13.
Change from 2020
No change
Response Options
| Description of data collected | Geographic scope covered by the monitoring | Frequency of data collection | Do the results of forest monitoring inform your region's overall strategy to managing forests? | Please explain |
|---|---|---|---|---|
| Text field | Select from:
|
Select from:
|
Select from:
|
Text field |
[Add Row]
Guidance
This question allows states and regions to provide additional information on their monitoring process and systems in place for identifying changes in their natural forest area as a result of deforestation and/or forest degradation. This is a table question with the following fields:
- Description of data collected: This is an open text field with 2400 characters allowing you provide details of the data you collect as part of the forest monitoring. For example, forest monitoring could include measurements of certain parameters of forests (physical, chemical, and biological) to determine baselines to detect and observe changes over time (Source: Global Forest Atlas – Forest Monitoring). Forest monitoring includes all efforts to track forest conditions over time, including changes in forest cover and other social, environmental, and economic dimensions of forests.
- Geographic scope covered by the monitoring: Please select from the options provided which best describes the scope of the monitoring occurring within your region. Please note that you can only select one option at a time and if you need to provide additional information on different types of monitoring which has different geographical scope, please do so by adding a new row.
- Frequency of data collection: Please specify how frequently you undertake monitoring and data collection to identify changes in your region’s natural forest area.
- Do the results of forest monitoring inform your region’s overall strategy to managing forests: Please respond by selecting the best option that describes the role of monitoring and how it informs your region’s overall strategy to forest management. Information and monitoring systems for the forest sector are instrumental for effective policies and planning, prioritizing interventions, valuation of forest resources, efficient investments, and engendering accountability. Relevant forest information that is systematically and periodically collected can enable effective implementation of policies, inform decision making, and guide management (Source: World Bank – Monitoring and Information Systems for Forest Management). If monitoring does not inform your region’s management strategy, please use the following explanation field to provide information on this.
- Please explain: Please use this open text field to provide additional information about your region’s monitoring systems and explain the extent to which the results of your monitoring inform your region’s forest management strategy.
Explanation of terms
- Natural forest area: A forest that is a natural ecosystem, i.e., possesses most of the native species composition, structure, and ecological function as a forest native to the given site. This includes:
- Monitoring: an on-going function that used the systematic collection of data on specific indicators to assess and document the extent to which actions, progress, performance, and compliance are being carried out or achieved (Source, AFi, 2019).
- Forest concession: the right to use land or other property to produce forest risk commodities, granted by a government, company, landholder or a controlling body. A forest concession is "a contract between a forest owner and another party permitting the harvesting (forest utilization contracts) and/or managing (forest management services contracts) of specified resources from a given forest area” (Source: FAO - Making forest concessions work to sustain forests, economies and livelihoods in tropical timber producing countries).
- High Carbon Stock forests: this is the High Carbon Stock Approach (HCSA) classification of forested areas that should be protected based on high carbon stock, importance to local communities or high biodiversity value. The HCSA distinguishes high carbon stock forests from degraded lands that may be developed.
- High Conservation Value (HCV): biological, ecological, social or cultural values which are considered outstandingly significant or critically important, at the national, regional or global level, as defined by the High Conservation Values (HCV) Resource Network.
Case study: Forest monitoring in the AmazonForest monitoring in the Amazon basin is vital to map forest cover and identify areas of deforestation. Moreover, forest biomass measurement is a necessary step to identify total forest carbon stocks and establish baselines for carbon finance mechanisms such as REDD+. Forest inventory has traditionally been conducted by field plot measurements. H.H. Chapman and others at the Yale School of Forestry were some of the first foresters to develop a forest mensuration methodology in the United States. Today, allometric equations are then used to extrapolate total biomass and carbon content over a large scale. However, these biomass estimates vary between sites, and field plot measurements are costly and time consuming to replicate over a large area. Satellite data can be used to estimate forest cover across a large area at resolutions of 30 square meters for Landsat and 250 square meters for MODIS. A recent mapping project between the University of Maryland and Google created a detailed global map of forest cover change. Using Landsat images, the research confirmed a slowing down in Amazon forest cover loss in Brazil but increased deforestation in the dry forest area of the Cerrado and Chaco forest, in southern Brazil, Bolivia and Paraguay. Other studies using MODIS images also show the annual change in forest cover in South America. They found continued forest loss in the arc of deforestation extending from Para, Brazil, south to Mato Grosso, and west into Acre, while finding forest recovery in steep areas of the Andes, the Atlantic Forest of Brazil, and the dry Caatinga of northeast coastal Brazil. Source: Global Forest Atlas – Forest Inventory and Monitoring in the Amazon |
Forest risks, impacts and opportunities
7.14 Has a risk or vulnerability assessment on deforestation and/or forest degradation been undertaken for your region?
Question dependencies
This question only appears if you select "Yes” in response to 7.2.
Change from 2020
No change
Response Options
Select one:
- Yes, risks are assessed
- Yes, risks are partially assessed
- No, risks are not assessed
- Do not know
Guidance
It is important to provide details of your procedures for deforestation and/or forest degradation risk or vulnerability assessment so that CDP data users can consider the thoroughness of your region’s understanding of its forests-related risk exposure. If you have completed a risk assessment for your entire region, select “Yes”. If you have an environmental risk assessment that considers any inherent deforestation and/or forest degradation risks among other environmental issues, please select "Yes". Only select "No" if you have not conducted any form of risk assessment that included issues on deforestation and/or forest degradation.
Explanation of term
“Risk”, as used in the Global Forest Watch’s Jurisdictional Risk Assessment, captures only deforestation that is achieved in a manner that is not permitted (e.g., by use of fire), or which takes place where certain laws and policies prohibit deforestation or conversion. Assessing the degree to which deforestation occurs in these areas helps to illuminate where background conditions may contribute to deforestation risk (Source: WWF – Using Public Data Platforms To Asses Deforestation Risks Within Jurisdictions)
7.14a Please provide the details of your region's procedures for assessing deforestation and/or forest degradation risks.
Question dependencies
This question only appears if you select "Yes, risks are assessed” or "Yes, risks are partially assessed" in response to 7.14.
Change from 2020
No change
Response Options
| Risk assessment procedure | Forests-related issue assessed | Drivers assessed | Frequency of assessment | Tools and methods used to identify and assess risks |
|---|---|---|---|---|
Select from:
|
Select all that apply:
|
Select all that apply: Options pre-populated from drivers reported in question 7.2 |
Select from:
|
Select all that apply:
|
| Issues considered | Stakeholders considered | Risk assessment web link | Please explain |
|---|---|---|---|
Select all that apply:
| Select all that apply:
| Text field | Text field |
[Add Row]
Guidance
It is important to describe your risk assessment coverage and content so that data users can understand the thoroughness of your risk assessment processes and whether your adopted risk assessment procedures are appropriate for the context and risks. Reporting the frequency of your risk assessments helps demonstrate whether these aspects of your assessments are appropriate for the context and risks reported.
This is a table question with the following fields:
- Risk assessment procedure: Select the option that best describes how your region assesses risks associated with deforestation and/or forest degradation. If multiple approaches apply, select the main or primary approach taken by your region and add a new row to provide information on other procedures. If none of the available options are suitable, select “Other, please specify” and a text box will appear for you to add a label that describes your approach.
- Forests-related issue assessed: Please select all the relevant issues that are assessed. You can select multiple options in this field.
- Drivers assessed: Please select all the drivers that are assessed. Please note that the options for this field will be dependent on the options selected in question 7.2.
- Frequency of assessment: Please select the option that best describes how frequently your risk or vulnerability assessment is carried out within your region.
- Tools and methods used to identify and assess risks: Select the options that best represent the tools and methods used by your region to identify and assess risks associated with deforestation and/or forest degradation. If none of the available options are suitable, select “Other, please specify” and a text box will appear for you to add a label that describes the tools/methods used.
- Issues considered: This field provides an indication of the comprehensiveness of the risk assessment, as it collects information on the additional contextual issues that inform your region’s understanding of its risks related to deforestation and/or forest degradation. Please select all the relevant issues considered from the options provided. If none of the available options are suitable, select “Other, please specify” and a text box will appear for you to add a label that describes other issues considered. Please use the explanation field to explain why those issues are considered in your risk assessment.
- Stakeholders considered: This field provides an indication of the comprehensiveness of the risk assessment, as it collects information on the key stakeholders that inform your region’s understanding of its risks related to deforestation and/or forest degradation. Please select all the relevant stakeholders considered from the options provided. If none of the available options are suitable, select “Other, please specify” and a text box will appear for you to add a label that describes other stakeholders considered. Please use the explanation field to explain why those stakeholders are considered in your risk assessment.
- Risk assessment web link: If it is available online, please provide a web link to your region’s risk assessment.
- Please explain: This is an open text field with 2400 characters, which allows you to provide additional information regarding the risk assessment procedures in place within the region to identify and assess risks relating to deforestation and/or deforestation. Please use this field to explain why the selected contextual issues and stakeholders are considered in your region’s risk assessment.
Explanation of terms
- "Risk", as used in the Global Forest Watch's Jurisdictional Risk Assessment, captures only deforestation that is achieved in a manner that is not permitted (e.g., by use of fire), or which takes place where certain laws and policies prohibit deforestation or conversion. Assessing the degree to which deforestation occurs in these areas helps to illuminate where background conditions may contribute to deforestation risk (Source: WWF- Using Public Data Platforms To Asses Deforestation Risks Within Jurisdiction)
- Forests-related issues: for the purpose of the 2020 States and Regions questionnaire, this refers to deforestation and forest degradation as well as conversion and degradation of other natural ecosystems.
- Deforestation: Loss of natural forest as a result of the following human activities: i) conversion to agriculture or other non-forest land use; ii) conversion to a plantation forest; or iii) severe and sustained degradation.
- Severe degradation constitutes deforestation even if the land is not subsequently used for non-forest land use.
- Loss of natural forest that meets this definition is considered to be deforestation regardless of whether or not it is legally permitted.
Deforestation signifies "gross deforestation" of a natural forest where "gross" is used in the sense of "total aggregate; without deduction for reforestation or other offsets" (Source: AFi, 2019).
- Forest degradation: Changes within a natural ecosystem that significantly and negatively affect its species composition, structure and/or function and reduce the forest’s capacity to support biodiversity, supply products and/or deliver ecosystem services. (Source: AFi, 2019)
- Conversion: Human-induced change of a natural ecosystem to another land use or profound change in the natural ecosystem’s species composition, structure, and/or function.
- Deforestation is one form of conversion (conversion of natural forests)
- Conversion includes severe degradation or the introduction of management practices that result in a substantial and sustained change in the ecosystem's former species composition, structure, or function.
- Change to natural ecosystems that meets this definition is considered to be conversion regardless of whether or not it is legally permitte (Source: AFi, 2019).
7.14b Please explain why your region has not undertaken / has not been requested to undertake a forests-related risk assessment.
Question dependencies
This question only appears if you select "No, risks are not assessed” or "Do not know" in response to 7.14.
Change from 2020
No change
Response Options
| Reason | Please explain |
|---|---|
Select from:
|
Text field |
Guidance
This question allows you to explain the primary reason as to why the region has not undertaken/has not been requested to undertake a risk assessment relating to deforestation and/or forest degradation. This question is a table with the following fields:
- Reason: Please select the option from the drop-down that describes the reasoning to your response. Please select “Other, please specify” if you want to provide a different reason from the options provided. Please specify this reason in the text field provided.
- Please explain: Please provide a brief explanation for this reason and its relevance in the context of your region.
7.15 Do current and/or anticipated impacts of deforestation and/or forest degradation present significant risks to your region?
Question dependencies
This question only appears if you select "Yes” in response to 7.2.
Change from 2020
No change
Response Options
Select from:
- Yes
- No
- Do not know
Guidance
Deforestation and forest degradation are major concerns for forest users and managers because it threatens their livelihoods. Deforestation not only leads to a reduction of available forest, it may also have adverse effects on the productivity, biodiversity and health of nearby remaining forests. For this question, please report whether the impact of deforestation and/or forest degradation presents significant risks to your region, by selecting “Yes”, “Do not know” or “No”. If you select “Yes” or "Do not know", you will be directed to questions 7.15a. If you select “No”, you will be directed to question 7.15b.
Deforestation and forest degradation can have severe socio-economic consequences: for example, it can threaten the livelihoods, cultures and survival of people who depend on forests, including indigenous peoples; weaken local and national economies; trigger social conflicts over natural resources; and cause population displacements. When identifying impacts of deforestation and/or forest degradation, states and regions should think objectively of the ways in which these issues will affect their region’s ability to conduct business as usual as well as the risks associated to their citizens.
7.15a Please provide details of the deforestation and/or forest degradation impacts as well as the primary action taken by your region.
Question dependencies
This question only appears if you select "Yes” or "Do not know" in response to 7.15.
Change from 2020
No change
Response Options
| Impacts | Forests-related issue causing the impact | Driver causing the impact | Anticipated timescale | Impact seriousness |
|---|---|---|---|---|
Select from:
|
Select all that apply:
|
Select all that apply: Options pre-populated from drivers reported in question 7.2 |
Select from:
|
Select from:
|
| Impact description | Primary action taken | Status of action | Action description |
|---|---|---|---|
| Text field | Select from: See drop-down options below | Select from:
| Text field |
[Add Row]
Primary action drop-down options:
- Adoption of afforestation strategies
- Adoption of reforestation strategies
- Encouraging integrated land-use planning and management
- Enforcing forest policies and regulations
- Upholding customary right and the security of land tenure and use
- Forest landscape restoration
- Implementing jurisdictional or integrated landscape approaches
- Increase awareness/engage all stakeholders on sustainable forest management
- Institutional strengthening and capacity building on forest management
- Introduction of biodiversity offsets or compensatory conservation
- Promoting certification and sustainable procurement policies
- Promoting and sharing information on best practices
- Reinforcing and expanding networks of protected areas and/or indigenous reserves
- Restoring soil fertility
- Setting up disincentives (e.g. taxes or fines for forest clearing)
- Setting up incentives (e.g. payments for ecosystem services)
- Strengthening demand-side policies
- No action currently undertaken
- Other, please specify
Guidance
This question allows states and regions to report on the current or anticipated impacts of deforestation and/or forest degradation as well as the primary actions they are taking to address these impacts. The FAO’s Sustainable Forest Management (SFM) Toolbox has a module on reducing deforestation has provided additional information and guidelines on how to address deforestation by:
- Identifying and analysing drivers: Location-specific, comprehensive assessments of the drivers of deforestation are the essential first steps in addressing deforestation. Note that the identification and analysis of drivers should be done with the full and informed participation of all stakeholders, such as the people involved in the various land uses and those benefiting from, or incurring costs due to, deforestation. Care should be taken to ensure that marginalized stakeholders, such as women and youth, minority groups, and indigenous peoples and other forest-dependent people, are able to participate meaningfully. The general requirements for such analyses are as follows:
-Identify deforestation areas (location and extent) using the most recent data obtained from existing monitoring systems or remote sensing, complemented by historical data, local knowledge, relevant reports and statistics, and an assessment of potential future threats in order to anticipate and minimize risk.
- Analyze the specific drivers based on data obtained from existing monitoring systems, local knowledge, and other available sources of information.
- Evaluate the impact of drivers at the local, national and, where possible, global scales, looking beyond the forest sector and considering the relationship of such drivers to all land-use activities.
- Analyze the underlying drivers, particularly those at the international level. This may need to be done using economic and social indicators, statistical analyses and modelling. It should include the mapping of the main actors associated with specific deforestation drivers and with forest restoration drivers.
- Collect qualitative information from stakeholders in order to understand the dynamics of the drivers. Of particular interest are the views of stakeholders living or working in areas where deforestation or forest degradation occur, and those living or working at sites that are showing signs of forest recovery. Such information can be gathered through, for example, key informant interviews, focus group discussions, participatory rural appraisals, and livelihood analysis, including household surveys.
- Main considerations: The following issues need to be considered when designing actions to address deforestation drivers:
-Taking a holistic approach that considers all scales: The drivers of deforestation are dynamic and interlinked and should therefore be addressed holistically. Because they occur at many scales (from local to global), strategies must integrate actions at various scales. Addressing regional or global drivers of deforestation is especially challenging and requires collaboration among countries.
- Different types of interventions: At all scales, three kinds of interventions may be considered: 1) incentives; 2) disincentives; and 3) creating an enabling environment. The table provides examples in each of these categories of measures that might be taken at various scales.
- Actions to reduce deforestation should be formulated and implemented with the engagement of all stakeholders in order to achieve legitimacy and buy-in. Because the most powerful drivers of deforestation are outside the forest sector, a cross-sectoral approach is crucial. An assessment of sectoral policies (e.g. forest, agriculture, mining, infrastructure and energy sectors), integrated land-use planning (e.g. a landscape approach), and the commitment to action by actors across sectors, are all essential for aligning sectoral interests in efforts to combat deforestation. Strategies should take into account the impacts of proposed actions on food security, local livelihoods, and climate-change mitigation and adaptation.
- Prioritization, implementation and monitoring: The identified actions should be ranked based on predefined criteria (e.g. objectives, estimated costs and potential for funding, existing implementation capacities, and alignment with national development priorities and plans). This will help in determining which drivers should be addressed first, the most suitable actions to take, and which drivers should not be addressed, or should be addressed later, and the rationale for the choices made. An implementation plan for the selected interventions should be developed, establishing mechanisms for stakeholder consultations and coordination. The plan should include an efficient monitoring system to enable the assessment of interventions, stakeholder engagement and perceptions, and socioeconomic and environmental impacts, in light of which the plan can be adapted as required.
This is a table question with the following fields:
- Impacts: Please select one of the impacts relating to deforestation and/or forest degradation that are relevant for your region from the drop-down options provided. You can select more than one type of impact by adding new rows when responding to this question.
- Forests-related issue causing the impact: Please select all the relevant issues that are causing the impact selected. You can select multiple options in this field.
- Driver causing the impact: Please select all the drivers that are causing the impact selected. Please note that the options for this field will be dependent on the options selected in question 8.2.
- Anticipated timescale: Please select the option that best applies to the impact reported. This field offers the following options for the timescale:
- Current – If your region is already experiencing the identified effect of deforestation and/or forest degradation.
- Short term – If you anticipate your region will experience the effect of deforestation and/or forest degradation by 2025.
- Medium term – If you anticipate your region will experience the identified effect of deforestation and/or forest degradation between 2026 and 2050.
- Long term – If you anticipate your region will experience the identified effect of deforestation and/or forest degradation after 2051.
- Unknown – If the information as to when your region will experience the identified effect of deforestation and/or forest degradation is not available.
- Impact seriousness: CDP asks states and regions to assess their level of risk by estimating the potential impact from the anticipated effect of deforestation and/or forest degradation along with the likelihood of that effect occurring. The seriousness of an impact will vary from region to region. When describing changes/activities and impacts on ecosystem structure and function, reference should be made to the following parameters, which include: positive or negative; magnitude; extent; duration; reversibility; and timing and frequency (Source: CIEEM – Impact Assessment). For example, “Extremely serious” impacts could be those that are widespread, long lasting and result in substantial and possibly irreversible change to the environmental value, which requires avoidance through appropriate and very specific responses or environmental controls. On the other hand, “Serious” impacts could be those that extend beyond the area of disturbance to the surrounding area but have a shorter duration.
- Impact description: This is an open text field with 2400 characters, which allows you to provide information as to how the impact selected is affecting the region and its citizens. For example, Biodiversity has high economic value. Some of the more obvious sources of value include: bio-prospecting, carbon sequestration, watersheds and tourism. Therefore, biodiversity loss resulting from deforestation could have considerable costs in both measurable economic loss and difficult-to-measure non-marketed terms (Source: OECD – Biodiversity).
- Primary action taken: Please select one option from the drop-down list that best describes the action you are taking to address the impact reported. If multiple actions apply, select the impact and the corresponding action by adding a new row to provide further information. If none of the available options are suitable, select “Other, please specify” and a text box will appear for you to add a label that describes your approach.
- Status of action: Please select the most appropriate option from the drop-down menu to describe the stage of implementation of the action selected.
- Action description: This is an open text field with 2400 characters, which allows you to provide further relevant comments about the action. Description of the actions should include details about: project name, scope, costs, timescale, collaborators and the projected outcome of the action.
Explanation of terms
- Forests-related issues: for the purpose of the 2020 States and Regions questionnaire, this refers to deforestation and forest degradation as well as conversion and degradation of other natural ecosystems.
- Deforestation: Loss of natural forest as a result of the following human activities: i) conversion to agriculture or other non-forest land use; ii) conversion to a plantation forest; or iii) severe and sustained degradation.
- Severe degradation constitutes deforestation even if the land is not subsequently used for non-forest land use.
- Loss of natural forest that meets this definition is considered to be deforestation regardless of whether or not it is legally permitted.
Deforestation signifies "gross deforestation" of a natural forest where "gross" is used in the sense of "total aggregate; without deduction for reforestation or other offsets" (Source: AFi, 2019).
- Forest degradation: Changes within a natural ecosystem that significantly and negatively affect its species composition, structure and/or function and reduce the forest’s capacity to support biodiversity, supply products and/or deliver ecosystem services. (Source: AFi, 2019)
- Conversion: Human-induced change of a natural ecosystem to another land use or profound change in the natural ecosystem’s species composition, structure, and/or function.
- Deforestation is one form of conversion (conversion of natural forests)
- Conversion includes severe degradation or the introduction of management practices that result in a substantial and sustained change in the ecosystem's former species composition, structure, or function.
- Change to natural ecosystems that meets this definition is considered to be conversion regardless of whether or not it is legally permitte (Source: AFi, 2019).
7.15b Please explain why deforestation and/or forest degradation impacts do not present significant risks to your region.
Question dependencies
This question only appears if you select "No” in response to 7.15.
Change from 2020
No change
Response Options
| Reason | Please explain |
|---|---|
Select from:
|
Text field |
Guidance
This question allows you to explain the primary reason as to why deforestation and/or forest degradation impacts do not present significant risks to your region. This question is a table with the following fields:
- Reason: Please select the option from the drop-down that describes the reasoning to your response. Please select “Other, please specify” if you want to provide a different reason from the options provided. Please specify this reason in the text field provided.
- Please explain: Please provide a brief explanation for this reason and its relevance in the context of your region.
7.16 Does managing forests sustainably provide any opportunities for your region?
Question dependencies
This question only appears if you select "Yes” in response to 7.2.
Change from 2020
No change
Response Options
Select from:
- Yes
- No
- Do not know
Guidance
Implementing sustainable forest management practices may reveal or lead to a variety of opportunities for the region. This question is designed to collect information on how states and regions are approaching and capitalizing opportunities from managing forests sustainably. If you select “Yes” in response to this question, you will be asked to provide information on those opportunities and explain how your region is positioning itself to maximize them.
Explanation of term
- Sustainable forest management: The process of managing a forest for achieving the continuous production of desired forest products and services without reducing its inherent values, future productivity and avoiding undesirable social-environmental effects (Source: adapted from ITTO).
Case study: Examples of benefits associated with forestsFood security and nutrition For example, a vital way in which forests contribute to food security and nutrition is in the provision of wood fuel as a household energy source. A sustainable energy supply is essential for proper and safe food and water use and therefore for family health. Likewise, the most recognized contribution of forests to food security and nutrition is the direct provision of forest foods, which can support a nutritious and diverse diet. Plants and animals found in forests provide important nutrient-rich dietary supplements, add variety to the bland diets common in rural, food-insecure households, and improve the taste and palatability of staple foods. Source: FAO – Forests, Food security and Nutrition Health and well-being Studies in countries such as Australia, Japan, the Netherlands, Norway, Sweden, the United Kingdom and the United States indicate the significant benefits of trees, woodlands and green spaces to people’s overall health and well-being. There are many ways in which to categorize such benefits, but primarily the categories are physical, psychological and social. Benefits can be gained from being active in nature (e.g. walking or cycling in forests), and by viewing nature, for example while in transit between or within urban areas. In many developing countries, forests are central to cultures and ways of life — agricultural and forestry practices may be impossible to separate from beliefs and values. In Borneo, for example, rice cultivation in swidden systems is a central activity of Kenyah Dayak women. Without the forest (or access to it), this subsistence system, and the accompanying culture and way of life, would be endangered. Source: FAO – Health Benefits from Forests |
7.16a Please indicate the opportunities associated with sustainable forest management and describe how your region is positioning itself to take advantage of them.
Question dependencies
This question only appears if you select "Yes” or "Do not know" in response to 7.16.
Change from 2020
No change
Response Options
| Opportunity | Describe how the region is maximizing this opportunity |
|---|---|
Select from:
|
Text field |
[Add Row]
Guidance
This is a table question, which invites you to detail the opportunities that may arise from managing forests sustainably and asks you to describe how your region is seizing them. This question allows you to report on multiple economic opportunities by adding an additional row. The table has the following fields:
- Opportunity: Please select the relevant opportunity for your region. If you want to add other types of opportunities that are not listed in the provided drop-down options, please select “Other, please specify” and specify the type of opportunity. Note that you can select one opportunity at a time. If you want to report multiple opportunities associated with sustainable forest management, then please add a new row. When selecting the opportunities, please consider that they can relate to those that are:
- Currently being experienced or are expected to arise in the future;
- Being managed or newly identified;
- Well understood or with high levels of uncertainty about the likelihood of the opportunity materializing and the extent to which it will impact the region.
- Describe how the region is maximizing this opportunity: For each of the opportunities identified, please use this field to highlight what your region is doing to seize the relevant opportunity.
Explanation of term
Sustainable forest management: The process of managing a forest for achieving the continuous production of desired forest products and services without reducing its inherent values, future productivity and avoiding undesirable social-environmental effects (Source: modified from ITTO).
7.16b Why does managing forests sustainably not provide any opportunities for your region?
Question dependencies
This question only appears if you select "No” in response to 7.16.
Change from 2020
No change
Response Options
| Reason | Please explain |
|---|---|
Select one from:
|
Text field |
Guidance
This question allows states and regions to explain the primary reason as to why managing forests sustainably does not provide any opportunities for them. This question is a table with the following fields:
- Reason: Please select the option from the drop-down that describes the reasoning to your response. Please select “Other, please specify” if you want to provide a different reason from the options provided. Please specify this reason in the text field provided.
- Please explain: Please provide a brief explanation for this reason and its relevance in the context of your region.
Terms & Conditions for responding states and regions:
CDP States and Regions 2021 Questionnaire
1. DEFINITIONS
CDP means CDP Worldwide, a charitable company registered with the Charity Commission of England and Wales (registered charity no. 1122330 and a company number 05013650). References to “we”, “our” and “us” in these terms are references to CDP.
Deadline means 29 July 2021 (unless otherwise stated by CDP).
Personal Data means data which relates to an individual who can be identified from the data, such as your state or region’s leader name and title.
Questionnaire means the CDP States and Regions 2021 Questionnaire.
Responding State or Region means the state or region responding to the Questionnaire. References to “you” and “your” in these terms are references to the Responding State or Region.
2. PARTIES
The parties to these terms shall be CDP and the Responding State or Region.
3. THESE TERMS
These are the terms that apply when you submit a response to the Questionnaire. If you do not agree to these terms, please contact us at [email protected] to discuss them with us.
4. RESPONDING TO THE QUESTIONNAIRE
General. Responding to the Questionnaire is free but responses must be prepared and submitted at the expense of the Responding State or Region.
Use of responses. Responding States or Regions agree that their response to the Questionnaire will be used by CDP in furtherance of its charitable mission and that the response may be:
(a) made available as soon as it is received by CDP to its partners, appointed report writers and any other parties that CDP deem appropriate;
(b) made publicly available at www.cdp.net, and through our Open Data Portal (https://data.cdp.net/) and stored and preserved on CDP’s servers indefinitely thereafter;
(c) compiled in CDP databases and made available in original, modified or adapted form for use by commercial (for a fee or otherwise) and non-commercial organizations;
(d) amalgamated with information about the Responding State or Region from other public sources;
(e) used as a best practice example in CDP literature and research;
(f) used individually or as part of aggregate results in CDP’s reports and in any other research conducted or commissioned by CDP; and
(g) used in any other way that accords with CDP’s charitable mission.
Deadline for responding. You must submit your response to us using our online response system by the Deadline for it to be eligible for inclusion in CDP reports and announcements.
Amending your response. You may amend a response you have submitted at any time before 10 December 2020, but please note that any changes you make to your response after the Deadline may not be reflected in any report or announcement.
5. RIGHTS IN THE RESPONSES
Ownership. All intellectual property rights in your response will be owned by you or your licensors.
License. You grant to us, or shall procure for us, a perpetual, irrevocable, non-exclusive, assignable, sub-licensable, royalty-free and global license to use your response and any copyright and data base rights in your response for the uses set out in these terms.
6. IMPORTANT REPRESENTATIONS
You confirm that:
(a) the person submitting the response to us is authorized by you to submit the response;
(b) you have obtained all necessary consents and permissions to submit the response to us; and
(c) the response that you submit:
(i) does not infringe the rights of any third party (including privacy, publicity or intellectual property rights);
(ii) does not defame any third party; and
(iii) does not include any Personal Data except for the name and title of the leader of the Responding State or Region (in question 1.1).
7. LIABILITY
We do not exclude or limit in any way our liability to you where it would be unlawful to do so. This includes liability for death or personal injury caused by our negligence or the negligence of our employees, agents or subcontractors; for fraud or fraudulent misrepresentation.
We are not liable for business losses. Subject to these terms, CDP has no liability to you in any circumstances for any loss of revenue, loss of profit, loss of business, business interruption, loss of business opportunity, loss of goodwill, loss of reputation, loss of, damage to or corruption of data or software or any indirect or consequential loss or damage.
Exclusion of liability. Subject to these terms, CDP has no liability to you in any circumstances arising from the content or submission of your response to us, our use of your response and/or the use of your response by any third parties.
Limitation of liability. Subject to these terms, CDP’s total liability to you in all circumstances shall be limited to £625.
8. GENERAL
We may transfer our rights to someone else. We may transfer our rights and obligations under these terms to another organization.
Nobody else has any rights under these terms. These terms are between you and us. No other person shall have any rights to enforce any of its terms.
Entire agreement. These terms constitute the entire agreement between you and us.
Variation. CDP reserves the right to change these terms at any time. Such changes shall be effective immediately or at such other time as CDP elects. In the event of any materially adverse changes, you may request to withdraw your response within 30 days of us notifying you of the change.
If a court finds part of these terms illegal, the rest will continue in force . Each of the paragraphs of these terms operates separately. If any court or relevant authority decides that any of them are unlawful, the remaining paragraphs will remain in full force and effect.
Governing law and jurisdiction. These terms are governed by English law and you and us both agree to the exclusive jurisdiction of the English courts to resolve any dispute or claim arising out of or in connection with these terms or their subject matter or formation.
Language. If these terms are translated into any language other than English, the English language version will prevail.
Appendices
Appendix A – Currency
AED United Arab Emirates dirham
AFN Afghani
ALL Lek
AMD Armenian Dram
ANG Netherlands Antillian Guilder
AOA Kwanza
ARS Argentine Peso
AUD Australian Dollar
AWG Aruban Guilder
AZN Azerbaijanian Manat
BAM Convertible Marks
BBD Barbados Dollar
BDT Bangladeshi Taka
BGN Bulgarian Lev
BHD Bahraini Dinar
BIF Burundian Franc
BMD Bermudian Dollar (customarily known as Bermuda Dollar)
BND Brunei Dollar
BOB Boliviano
BOV Bolivian Mvdol (Funds code)
BRL Brazilian Real
BSD Bahamian Dollar
BTN Ngultrum
BWP Pula
BYR Belarussian Ruble
BZD Belize Dollar
CAD Canadian Dollar
CDF Franc Congolais
CHE WIR Euro (complementary currency)
CHF Swiss Franc
CHW WIR Franc (complementary currency)
CLF Unidades de formento (Funds code)
CLP Chilean Peso
CNY Yuan Renminbi
COP Colombian Peso
COU Unidad de Valor Real
CRC Costa Rican Colon
CUP Cuban Peso
CVE Cape Verde Escudo
CYP Cyprus Pound
CZK Czech Koruna
DJF Djibouti Franc
DKK Danish Krone
DOP Dominican Peso
DZD Algerian Dinar
EEK Kroon
EGP Egyptian Pound
ERN Nakfa
ETB Ethiopian Birr
EUR Euro
FJD Fiji Dollar
FKP Falkland Islands Pound
GBP Pound Sterling
GEL Lari
GHS Cedi
GIP Gibraltar pound
GMD Dalasi
GNF Guinea Franc
GTQ Quetzal
GYD Guyana Dollar
HKD Hong Kong Dollar
HNL Lempira
HRK Croatian Kuna
HTG Haiti Gourde
HUF Forint
IDR Rupiah
ILS New Israeli Shekel
INR Indian Rupee
IQD Iraqi Dinar
IRR Iranian Rial
ISK Iceland Krona
JMD Jamaican Dollar
JOD Jordanian Dinar
JPY Japanese yen
KES Kenyan Shilling
KGS Som
KHR Riel
KMF Comoro Franc
KPW North Korean Won
KRW South Korean Won
KWD Kuwaiti Dinar
KYD Cayman Islands Dollar
KZT Tenge
LAK Kip
LBP Lebanese Pound
LKR Sri Lanka Rupee
LRD Liberian Dollar
LSL Loti
LYD Libyan Dinar
MAD Moroccan Dirham
MDL Moldovan Leu
MGA Malagasy Ariary
MKD Denar
MMK Kyat
MNT Tugrik
MOP Pataca
MRO Ouguiya
MUR Mauritius Rupee
MVR Rufiyaa
MWK Kwacha
MXN Mexican Peso
MYR Malaysian Ringgit
MZN Metical
NAD Namibian Dollar
NGN Naira
NIO Cordoba Oro
NOK Norwegian Krone
NPR Nepalese Rupee
NZD New Zealand Dollar
OMR Rial Omani
PAB Balboa
PEN Nuevo Sol
PGK Kina
PHP Philippine Peso
PKR Pakistan Rupee
PLN Zloty
PYG Guarani
QAR Qatari Rial
RON Romanian New Leu
RSD Serbian Dinar
RUB Russian Ruble
RWF Rwanda Franc
SAR Saudi Riyal
SBD Solomon Islands Dollar
SCR Seychelles Rupee
SDG Sudanese Pound
SEK Swedish Krona
SGD Singapore Dollar
SHP Saint Helena Pound
SKK Slovak Koruna
SLL Leone
SOS Somali Shilling
SRD Surinam Dollar
STD Dobra
SYP Syrian Pound
SZL Lilangeni
THB Baht
TJS Somoni
TMM Manat
TND Tunisian Dinar
TOP Pa'anga
TRY New Turkish Lira
TTD Trinidad and Tobago Dollar
TWD New Taiwan Dollar
TZS Tanzanian Shilling
UAH Hryvnia
UGX Uganda Shilling
USD US Dollar
UYU Peso Uruguayo
UZS Uzbekistan Som
VEB Venezuelan bolívar
VND Vietnamese đồng
VUV Vatu
WST Samoan Tala
XAF CFA Franc BEAC
ZAR South African Rand
Appendix B – Climate actions
1. Agriculture sector (6 possible actions)
- Improve capacity of farmers and rural organizations (e.g. educating farmers on innovative and cost-effective measures, providing financial support, developing farm level carbon footprint)
- Improve grassland and cropland management (e.g. improve nutrient management, implement rotational or prescribed grazing methods)
- Reduce methane emissions from manure(e.g. install dairy digesters)
- Reduce methane emissions from livestock digestive systems (e.g. feed management to improve productivity)
- Improve soil health/soil carbon sequestration capacity
- Promote other sustainable farming practices
- Other, please specify
2. Buildings & Lighting sector (18 possible actions)
- Improve heating and cooling efficiency (e.g. audits, insulation, HVAC maintenance, white roofs, etc.)
- Increase awareness/engage public on energy efficiency/clean energy programs
- Install biomass heating
- Install clean cook stoves
- Install energy efficient lighting systems (e.g. LED)
- Install geothermal heating
- Install more efficient luminaires in outdoor lighting (e.g. LED)
- Install smart energy meters/sub-meters
- Install solar heating/hot water
- Promote and strengthen building energy performance rating/certification/benchmarking
- Promote energy efficient appliances
- Set/strengthen appliance efficiency standards
- Set/strengthen HVAC efficiency standards
- Set/strengthen lighting efficiency standards
- Switch from heating oil to natural gas
- Commit to reaching net-zero operating emissions in public buildings
- Establish a plan/roadmap for all new buildings to produce net-zero GHG emissions
- Net Zero Carbon Buildings Commitment participants: reducing operating emissions of government-owned building portfolio
- Other, please specify
3. Energy sector (22 possible actions)
- Enable net metering
- Expand/improve transmission to integrate renewables
- Install natural gas power
- Install biomass power
- Install carbon capture and storage (CCS)
- Install combined heat and power (CHP) or trigen
- Install energy storage system
- Install hydropower
- Install microgrids
- Install nuclear power
- Install smart grids
- Install solar power (e.g. PV, CSP)
- Install geothermal power
- Install wind power (e.g. onshore, offshore)
- Install ocean/tidal/wave power
- Measure energy productivity (e.g. GDP per unit of energy)
- Promote demand-side management programs
- Reform utility revenue policies and rate structures
- Phase out coal-fired/inefficient power stations
- Set energy efficiency resource standards (EERS)
- Set a target of 100% zero-carbon power (i.e. based on a large-scale switch to renewable energy)
- Control methane leaks from oil & gas operations
- Other, please specify
4. Finance & Economy sector (15 possible actions)
- Adopt feed in tariff for renewables
- Adopt reverse auction for renewables
- Enable PACE (long term property tax based loans) financing
- Establish GHG emissions trading program
- Increase awareness/engage public on financing mechanisms and incentives for energy efficiency/clean energy
- Invest in clean tech R&D
- Issue green bonds
- Promote on-bill financing
- Provide green mortgages
- Provide loans/guarantees for energy efficiency/clean energy
- Provide tax incentives for clean energy
- Support clean tech clusters/companies
- Implement carbon tax
- Fossil fuel divestment
- Fossil fuel subsidies reform
- Other, please specify
5. Governance sector (7 possible actions)
- Collaborate with cities/local governments in reducing emissions/increasing resilience
- Collaborate with national governments in reducing emissions/increasing resilience (e.g. development and delivery of NDC’s)
- Collaborate with other states/regions in reducing emissions/increasing resilience
- Support and incentivize businesses in reducing emissions/increasing resilience
- Support and incentivize citizens in adapting environmentally friendly practices
- Complete a 2050 Pathways analysis (i.e. strategy for meeting mid-century GHG reduction goals)
- Alignment with Sustainable Development Goals
- Other, please specify
6. Industry sector (7 possible actions)
- Improve energy efficiency of industrial processes
- Promote industrial symbiosis/industrial ecology programs
- Promote reduced packaging
- Support green manufacturing
- Implement green public/private partnerships with industry
- Support digitalization of industry
- Regulate / incentivize reduction in use of HFC’s
- Other, please specify
7. Land use sector (6 possible actions)
- Establish GHG reduction plan for LULUCF (e.g. REDD+, etc.)
- Promote conservation efforts for natural areas
- Promote sustainable forest management
- Undertake strategic environmental assessment
- Promote sustainable coastal ecosystem management
- Establish guidelines for siting renewable power
- Other, please specify
8. Transport sector (14 possible actions)
- Improve public transport services (e.g. adopt, high speed rail, improve bus services, improve rail services)
- Promote digitalization in the transport sector (e.g. real-time information)
- Promote active transport such as walking and cycling
- Switch freight from high carbon to low carbon transport
- Increase awareness/engage public on private transport measures
- Install electric vehicle charging infrastructure (i.e. home, work, highways, etc.)
- Provide incentives for zero-emission vehicles (e.g. purchase rebate, tax exemptions)
- Promote alternative fuel production (e.g. biofuels, natural gas, hydrogen, etc.)
- Set/strengthen standards for vehicles (e.g. for fuel economy GHG emissions, low carbon fuels)
- Set manufacturing requirements (e.g. zero-emission vehicle standard)
- Switch to electric/hybrid vehicles in cars/taxis/government fleets
- Switch to other lower-carbon fuel in cars/taxis/government fleets (e.g. biofuels, natural gas, hydrogen, etc.)
- ZEV Challenge Participants: progress towards procuring only zero-emission passenger vehicles for appropriate public fleets by 2030, or
- converting all appropriate public fleet vehicles to zero-emission vehicles by 2030
- Other, please specify
9. Waste sector (12 possible actions)
- Adopt source separation policies (e.g. collection for dry recyclables, organic compostable waste, etc.)
- Establish waste reduction/recycling plan
- Increase awareness/engage public on waste reduction/recycling measures
- Install advanced thermal treatment/waste to energy
- Install anaerobic digestion
- Install landfill gas management/landfill gas to energy
- Install mechanical biological treatment
- Install municipal recycling points or centers (for residents or businesses)
- Install waste heat recovery
- Implement practices and policies to promote circular economy
- Reducing the municipal solid waste generation per capita
- Reducing the amount of municipal solid waste disposed to landfill and incineration and increase the diversion rate away from landfill and incineration
- Other, please specify
10. Water sector (4 possible actions)
- Install water efficiency measures
- Adopt wastewater to energy initiatives (e.g. methane recovery for reuse)
- Install smart water meters
- Promote water recycling or reclamation
- Other, please specify
11. Healthcare sector (3 possible actions)
- Support hospitals and public health systems to reduce GHG emissions (e.g. renewable energy, energy efficiency, reduce waste, etc.)
- Support hospitals and public health systems to increase resilience to climate impacts (e.g. emergency response systems, microgrids, etc.)
- Take steps to better integrate health policy and climate policy within the government
- Other, please specify
Appendix C – Actions to reduce vulnerability
Flood mapping
Heat mapping and thermal imaging
Landslide risk mapping
Sea level rise modelling
Biodiversity monitoring
Real time risk monitoring
Crisis management including warning and evacuation systems
Crisis planning and practice exercises
Public preparedness (including practice exercises/drills)
Community engagement/education
Projects and policies targeted at those most vulnerable
Testing/vaccination programmes for vector-borne disease
Disease prevention measures
Air quality initiatives
Incorporating climate change into long-term planning documents
Restrict development in at risk areas
Resilience and resistance measures for buildings
Hazard resistant infrastructure design and construction
Diversifying power/energy supply
Economic diversification measures
Flood defences – development and operation & storage
Storm water capture systems
Additional reservoirs and wells for water storage
Soil retention strategies
Implementing nature-based solutions for water
Tree planting and/or creation of green space
Green roofs/walls
White roofs
Shading in public spaces, markets
Cooling systems for critical infrastructure
Retrofit of existing buildings
Cooling centers, pools, water parks/plazas
Cool pavement
Water extraction protection
Promoting low flow technologies
Water butts/rainwater capture
Xeriscapes – low water landscaping design
Maintenance/repair – leaking infrastructure
Optimizing delivery fuel mix of water supply
Improve water supply distribution method
Promoting and incentivizing water efficiency
Water use restrictions and standards
Water efficient equipment and appliances
Water smart metering
Water use audits
Awareness campaign/education to reduce water use
Diversification of water supply
Other
© 2020 CDP Worldwide