Copyright © 2023 CDP Worldwide. All rights reserved.
CDP Climate Change Questionnaire Preview and Reporting Guidance 2023 - Version Control
| Version number
|
Release / Revision date
|
Revision summary
|
| 1.0
|
Released: January 11, 2023
|
Publication of the 2023 questionnaire preview and reporting guidance.
|
| 1.1
|
Revised: February
10, 2023
|
- C6.1 and C-CE7.4/C-CH7.4/C-CO7.4/C-EU7.4/C-MM7.4/C-OG7.4/C-ST7.4/C-TO7.4/C-TS7.4: Guidance on the use of biogas certificates for scope 1 reporting has been updated.
- C8.2e: Question dependency updated so that C8.2e is not presented to companies who indicate in C8.2 that they do not consume any purchased or acquired electricity, heat, steam or cooling.
|
| 1.2
|
Revised: February 14, 2023
|
- C3.5: Companies in the financial services sector will not be presented with the option “At the company and activity level” in column 2 as these companies are not required to report alignment against the EU Taxonomy for Sustainable Activities until January 2024.
- C3.5, C3.5a, C3.5b and C3.5c: Guidance has been updated to clarify the data being requested, and to provide links to further external resources including new EU Commission FAQs on the EU Taxonomy.
- Connections to other frameworks: for financial services institutions, connections to the Net Zero Asset Managers (NZAM) initiative have been removed for C3.3, and added for C-FS2.2b, C-FS2.2e, C3.1, C3.5, C3.5a, C4.1, C4.3c, C11.2, C12.4, C-FS14.1, C-FS14.1c, and C-FS14.3a.
- FW-FS4.3: In column 2, agricultural commodities sugar, tobacco and rice will now only be presented to companies who indicate in C-FS0.7 that they finance or insure industry sectors with a critical impact on water security.
|
| 1.3
|
Revised: March 23, 2023
|
- C2.2: Guidance updated to request that companies include an explanation of the frequency of assessment and time horizons reported when describing their process for identifying, assessing and responding to climate-related risks and opportunities.
- C-CO4.2d and C-OG4.2d: Guidance updated to request that companies reporting a separate methane reduction target in C4.1a/b provide details of the target in C-CO4.2d/C-OG4.2d.
- C-CO4.8 and C-OG4.8: Guidance updated to request that where flaring is not relevant to a company’s operations, they include examples and timelines in their explanation to illustrate why it is not relevant.
|
| 1.4
|
Revised: April 17, 2023
|
- C3.5a and C3.5b: Example responses added for questions on taxonomy alignment.
|
| 1.5
|
Revised: June 9, 2023
|
- C3.2a: Guidance updated to specify that only companies with financial services as their primary sector should use the “NGFS scenarios framework" dropdown.
- C-FS14.3a: Drop-down added for companies to indicate if they do not have commercial/corporate/SME clients to report on in this question.
|
| 1.6
|
Revised: July 12, 2023
|
- C-OG9.5a/C-CO9.5a: Clarification of the requested content for column 2. This column requests CAPEX in the reporting year for the expansion activity as a percentage of an organization’s total CAPEX in the reporting year, not as a percentage of total CAPEX for power generation alone.
|
| 1.7
|
Revised: July 25, 2023
|
- C3.5b: The requested content has been updated for columns 26, 28 and 30 as it is not possible to upload attachments for these columns. Supporting documents may be uploaded in question C-FI if needed.
- C3.5c: The requested content has been updated as it is not possible to upload attachments for this question. Companies may upload attachments in C10.2a that relate to the verification/assurance of information provided in C3.5a and/or C3.5b. Other supporting documents may be uploaded in question C-FI if needed.
|
| 1.8 |
Revised: August 4, 2023 |
- C4.1a, C4.1b, C-FS4.1d, C4.2a,C4.2b: Updates to Chinese translations of column headings to fix errors and improve clarity.
|
Note that you have selected to view the Climate Change - Full version.
You have selected to view sector-specific content for the following sectors:
CDP disclosure cycle 2023
Accessing questionnaire previews, reporting guidance, and scoring methodologies
CDP’s corporate questionnaire previews, reporting guidance, and scoring methodologies for climate change, forests and water security can be accessed from the guidance for companies page of CDP's website.
Submitting a response to the questionnaire(s)
Responses to questionnaires must be submitted via CDP's Online Response System (ORS), which is part of CDP's online disclosure platform. Please refer to Using CDP's Online Disclosure Platform for more details. Please note that while the questions themselves are the same in the questionnaire preview as they are in the ORS, the display format of some questions may differ, particularly for drop-down options and tables.
Sector-specific questions
Companies in high-impact sectors, in addition to the general questions, will be presented with questions specific to that sector. The rationale for developing a refined questionnaire for each of these sectors is outlined in the relevant sector introduction.
The sector-specific questions allocated to companies are defined by CDP's Activity Classification System (CDP-ACS). This system categorizes companies by focusing on the activities from which they derive revenue and associating these with the impacts to their business from climate change, water security and deforestation.
Please note that since each questionnaire includes sector-specific questions throughout, as not all questions will be applicable to your organization, some question numbers may skip.
Full and Minimum versions of the questionnaire
All organizations completing the climate change, forests and water security questionnaires are eligible to complete the full questionnaire.
In some cases, organizations may be eligible to complete a minimum version which contains fewer questions, and no sector-specific questions or data points.
Organizations are eligible to complete the minimum version of a questionnaire if they have an annual revenue of less than EUR/US$250 million*, and are disclosing in response to a request from a customer (i.e. CDP supply chain members), the CDP banks program members, the RE100 initiative, or the NZAM initiative.
Organizations will not be eligible to complete the minimum version questionnaire if they are disclosing in response to an investor request.
For information on scoring eligibility and implications, please see our Scoring Introduction.
* CDP reserves the right to remove the option of completing a minimum version questionnaire for previous responders to a questionnaire with an annual revenue of less than EUR/US$250 million, on the basis of the organization’s potential or existing environmental impact.
Timeline:
For the latest information on the timeline, please refer to our website.
Jan 2023
|
- Preview of 2023 questionnaires and reporting guidance released on CDP website (English versions).
|
| March 2023
|
- Preview of 2023 questionnaires and reporting guidance released on CDP website (translated versions).
|
| April 2023
|
- Online Response System (ORS) opens.
|
| July 2023
|
- Companies must submit their responses to investors and/or customers using the ORS to be eligible for scoring and inclusion in reports (where applicable).
|
For any disclosure-related enquiries, please contact the CDP Help Centre or your regional CDP contact.
CDP climate change questionnaire
This questionnaire is the property of CDP Worldwide, reproduction of all or part (including within software platforms) without permission of CDP Worldwide is prohibited. Please contact [email protected] for more information on this.
Introduction to CDP's climate change program and questionnaire
Improving corporate awareness through measurement and disclosure is essential to the effective management of climate change risk. CDP’s climate change questionnaire collects climate-related data from the world’s largest companies on behalf of over 680 institutional investor signatories with a combined US$130 trillion in assets and 280+ major purchasers with over US$6.4 trillion in procurement spend. Since its launch in 2002, the questionnaire has helped thousands of companies to measure their impacts, set ambitious targets and demonstrate progress for key stakeholders.
The questionnaire has been evolving over time in line with the latest climate science and global policy development. The 2015 Paris Agreement was a tipping point in the global approach to climate change. By agreeing to limit global temperature rises to well below 2°C and pursue efforts to limit warming to under 1.5°C, governments have committed to a transition to a net-zero carbon economy. This transition will create winners and losers within and across business sectors, as the manifestation of climate-related opportunities and risks accelerates in both size and scope. Business as usual will not be a good indicator of how companies will perform.
Regulators have begun to respond to the climate risks, notably with the recommendations by the Task Force on Climate-related Financial Disclosures (TCFD). Established by the Financial Stability Board, the TCFD has moved the climate disclosure agenda forward by emphasizing the link between climate-related risk and financial stability. The Task Force has recommended that both companies and investors disclose climate change information. This includes whether they are conducting scenario analysis in line with a 1.5°C pathway and then setting out how climate-related issues impact their strategy and financial planning. This amplifies the longstanding call from CDP’s investor signatories for companies to disclose comprehensive, comparable environmental data in their mainstream reports, driving climate-related risk management further into the boardroom. CDP’s climate change questionnaire has been aligned with the TCFD recommendations since 2018 and prompts companies to disclose data on how climate-related issues are addressed in their governance, strategy, risk management, and metrics and targets.
In its first two decades, CDP’s climate change questionnaire focused on raising ambition around climate and providing data to improve governance and decision-making. But time is fast running out to prevent catastrophic climate change, and an irreversible loss of nature and habitats. There is now an urgent need to ensure that stated intentions are accompanied by concrete plans, with transition metrics, and evidence of progress against agreed goals. Accountability is needed to raise the bar to align with halving emissions, shifting towards nature positivity by 2030 and achieving net-zero emissions and full nature recovery by 2050. In line with CDP’s 2021-2025 strategy, the climate change questionnaire and scoring will be evolving to further encourage and support companies to set targets and create tangible climate transition plans, as well as to measure their performance against them.
Carbon emissions are only one part of the challenge. The climate and nature crises need to be addressed simultaneously, including by conserving, protecting, and restoring ecosystems, adopting more sustainable agriculture and forestry practices, and ensuring a circular economy. In line with the 2021-2025 strategy, CDP begins broadening the environmental issues covered in its questionnaires, starting with the inclusion of questions on companies’ approach to maintaining and addressing biodiversity. As a first step in 2022, broad questions around governance, commitments, monitoring and reporting on biodiversity issues were included in a new module in the climate change questionnaire. These questions are material to all sectors and geographies and responses will inform future biodiversity metrics, ensuring the relevance and usefulness of biodiversity corporate reporting to both financial institutions and policy makers. The new biodiversity questions were developed in alignment with the IUCN’s Corporate Reporting on Biodiversity Guidelines.
Climate change questionnaire structure
There are 15 modules in the general climate change questionnaire, including the Introduction and Signoff modules, plus a module presented only to organizations that are responding to a customer request from one or more CDP Supply Chain Members. The journey through CDP’s general climate change questionnaire includes the following:
- Governance
- Risks and opportunities
- Business strategy
- Targets and performance
- Emissions methodology
- Emissions data
- Energy
- Additional metrics
- Verification
- Carbon pricing
- Engagement
- Biodiversity
Sector approach
The structure of the CDP climate change questionnaire was redesigned in 2018 in response to market needs and trends in corporate climate change reporting. Revisions included the inclusion of the TCFD recommendations, an increased emphasis on forward-looking metrics, improved alignment with other reporting frameworks, and the integration of sector-specific questions.
For climate change, CDP has incorporated sector-specific questions for 16 high-impact sectors.
All question numbers in the general climate change questionnaire begin with the letter C. Introduced in 2022, question numbers in the new forests and water module for financial services organizations only, begin with the letters FW. Questions that are unique to companies in a particular sector are labelled using a two-letter abbreviation within the question number. These abbreviations are noted below.
2023 climate change sectors:
- Agriculture: Agriculture commodities (AC); Food, beverage & tobacco (FB); Paper & forestry (PF)
- Energy: Coal (CO); Electric utilities (EU); Oil & gas (OG)
- Financial: Financial services (FS)
- Materials: Cement (CE); Capital goods (CG); Chemicals (CH); Construction (CN); Metals & mining (MM); Real estate (RE); Steel (ST)
- Transport: Transport services (TS); Transport OEMs (TO)
Climate change questionnaire changes in 2023
In 2023, CDP has revised questions and introduced new questions on
topics which reflect the strategic priorities for CDP and its
stakeholders. However, 79% of the 2022 questions remain
unchanged. A detailed document on climate change question changes from 2022 to 2023 can be found on the
Guidance page of the website.
Key changes include:
Core and supply chain questions
- One removed question for all companies
- Seven new questions for all companies
- Twenty-five modified questions for all companies, including one modified supply chain question
RE100 companies
- Three modified questions on renewable energy sourcing
Financial services sector
- One sector-specific question removed for the financial services sector
- Four new questions for the financial services sector
- Fourteen modified questions for financial services sector organizations across the questionnaire
Other sector-specific changes
- One removed sector-specific question for the Agricultural commodities; Food, beverage and tobacco; and Paper and forestry sectors
- One new sector-specific question for the Oil & gas and Coal sectors
- Fourteen modified sector-specific questions for Agricultural commodities; Food, beverage and tobacco; Paper and forestry; Oil & gas; Cement; Electric utilities; Capital goods; Chemicals; Construction; Metals & mining; Real estate; Steel; Transport services; and Transport OEMs sectors
Revisions and changes are indicated for every question as: “no change”, “minor change”, “modified question”, “new question”, “modified guidance”, “additional guidance” or "revised question dependency". “Minor change” indicates wording edits and revisions to drop-down options or a simple clarification, while a “modified question” indicates that the data requested has been revised.
Preparing your CDP response
Please find below information on the support materials and options available to companies, and important notes for completing your disclosure. Please review these notes carefully as you prepare your response, even if you have responded to the questionnaire in previous years.
CDP disclosure support materials
CDP provides a variety of support materials to help organizations disclosing to our questionnaires. Before completing the corporate questionnaires, we strongly recommend you read this Reporting Guidance, the Scoring introduction, and relevant Scoring Methodology. Please also refer to the CDP Technical Notes and other guidance materials accessible from the guidance tool after signing in to the website, and see the Frequently Asked Questions on the website.
Reporting guidance
The reporting guidance in this document includes the following:
- Module-level guidance: for select modules, this guidance provides an overview of key changes, sector-specific content for the module, and important disclosure notes. This section also presents question pathway diagrams showing the flow of questions through each module.
- Question-level guidance: at the question level, guidance is separated into the following components to provide clarity around questions, terminology and requirements:
- Rationale: provides reasoning behind the inclusion of each question;
- Connections to other frameworks: notes for each relevant question in the climate change questionnaire, connections to the Sustainable Development Goals (SDGs), S&P Global Corporate Sustainability Assessment (S&P CSA), the Task Force on Climate-related Financial Disclosures (TCFD), RE100, and for financial services institutions only, the Net Zero Asset Managers (NZAM) initiative and CEO Water Mandate;
- Requested content: offers context around each question and requested criteria;
- Explanation of terms: provides detailed definitions for specific terminology;
- Example responses: for select questions, this provides an example of a response that would include all information requested; and
- Additional information: for select questions, this provides optional contextual information and sources related to the subject of the disclosure request.
- Glossary: viewable at the end of the reporting guidance, the glossary contains a subset of 'Explanation of terms'.
- Appendix: Agricultural/Forestry management practices.
If you have any questions that are not answered in the reporting guidance, the additional guidance noted below, or our Frequently Asked Questions, please contact your local CDP contact or visit the CDP Help Centre.
Webinars and workshops
CDP hosts live webinars and workshops designed to aid you with environmental reporting.
Please visit the workshops and webinars and climate change pages of CDP's website for more details.
CDP Reporter Services
CDP Reporter Services program offers tailored support, enhanced data access and thought leadership on managing and reporting environmental risk to your business. Access the tools you need to move from disclosure to leadership on integrating climate, forests management, and water security into your wider business strategy. For year-round, personalized disclosure support from a dedicated CDP account manager, a gap analysis of your previous response, final review before submission and analytics tools to benchmark yourself against peers and understand best practice contact [email protected]. Visit the Reporter Services page of CDP's website for more information.
CDP's Accredited Solutions Providers
CDP partners with leading environmental service providers that can support companies throughout all stages of the measurement, reporting and management of their climate and sustainability data and impacts. All CDP solutions providers have met specific accreditation criteria. See provider areas of expertise below, and visit the accredited solutions provider directory to search for the provider best able to support you:
- Carbon reduction solutions providers offer technology and services that can help your organization reduce carbon emissions and improve energy efficiency.
- Climate change consultancy solutions providers have a wide range of technical expertise to support companies with establishing and implementing climate change and sustainability strategies.
- Science-based target (SBT) solutions providers have expertise in helping companies to set and implement targets in line with what the latest climate science says is necessary.
- Education & training solutions providers improve employee awareness and understanding of how climate change affects their organization through carbon management training programs.
- Renewable energy solutions providers provide expertise in procuring, tracking, and generating renewable power.
- Software solutions providers simplify the collection, monitoring, and reporting of sustainability, CSR, and environmental data through integrated sustainability software applications.
- Verification solutions providers help organizations disclose accurate data and improve internal processes by providing third-party verification and assurance of emissions data, a practice recommended by CDP.
As well as visiting our accredited solutions provider webpage, you can also contact [email protected] to find out more.
Important notes for completing your disclosure
Acronyms
Avoid using bespoke internal acronyms unless required for your organization’s response, in which case please provide their meaning to enable correct analysis and scoring.
Blank responses
Leaving a response blank is interpreted as non-disclosure. For numeric fields, values of zero (0) imply a measurement has been made, and the value is zero (0). For numeric fields where no measurement has been made, please leave the field blank and provide an explanation in an open text field for that same question (e.g. 'Comment' (optional) or 'Please explain' (scored)). If there is no open text field for the question, you may provide an explanation in the Further information field in the ORS at the end of your disclosure. Leaving a response blank and entering a value of zero (0) have different scoring implications. Please see the scoring methodology for more details.
Character limits
The character limits noted in the reporting guidance and in the ORS include spaces.
'Comment' columns
Some questions include a column labelled as 'Comment'. Note that providing information in these columns is optional.
Company-specific information
Some questions request company-specific information, rationales, case studies and/or examples. This level of detail gives data users confidence that the issue at hand has been thoroughly considered in the context of the responding organization's own business and not simply assessed in general terms.
- Be sure to include company-specific detail, such as references to activities, programs, products, services, methodologies, or operating locations unique to your company’s business or operations. A company-specific explanation should include details that make the answer true for the responding company and are distinct from other companies in the same industry and/or geography.
- Clear rationales are those which provide logical reasoning for methodologies, descriptions, decision, and actions.
- Case studies are defined as a detailed description of the implementation of a process, strategy or decision to a specific situation and/or task. When formulating case studies, responders may find it helpful to consider a “Situation-Task-Action-Result” (STAR) approach :1) Situation: what was the context or background? 2) Task: what needed to be done or what was the problem to be solved? 3) Action: what was the course of action taken? 4) Result: what was the final outcome of the course of action?
- An example does not need to follow the STAR approach. It can be shorter than a case study but should include some company-specific detail.
For more details, refer to the Scoring Introduction on the CDP website.
Consistency
CDP encourages a comprehensive and consistent response. Please ensure there is no conflicting information in your responses, both within a question and across the questionnaire.
Copy forward
The 'copy forward' functionality will be available in the ORS for companies that disclosed to CDP in previous reporting years. This functionality auto-populates your most recent answers into your questionnaire where applicable.
Note that this functionality may have been disabled for modified data points. The reporting guidance will indicate which questions have been modified. The Questionnaire Changes document on the guidance section of the CDP website lists all revisions from the previous year.
Please review the auto-populated answers carefully. It is your responsibility to ensure your answers are updated for the accuracy and completeness of your response.
Data accuracy
CDP recognizes that there may be uncertainty linked to data – this can arise from data gaps, assumptions, metering/measurement constraints including equipment accuracy etc. CDP allows estimated data to be submitted. However, an emphasis is placed on reporting transparently and this means that a company should always provide an explanation when its reported data is not accurate and detail the uncertainty (use the 'Please explain' or 'Comment' columns provided in the question).
Drop-down options ('Other, please specify')
Please select from the options provided whenever possible, and only select 'Other, please specify' when none of the listed options is appropriate. This greatly assists data analysis. If selecting 'Other, please specify', you must add a label that describes the option you are providing data for.
'Further information' field
At the end of the questionnaire, there is an opportunity to provide additional information or context that you feel is relevant to your organization’s response. This field is optional and not scored.
Mergers and acquisitions (M&As)
All disclosure should be defined by the organizational boundary applicable at the time of the stated reporting period. (Note that for CDP disclosure, organizations are encouraged to align their reporting period and organizational boundaries with their financial reporting).
Regarding forward-looking disclosure, organizations should include information that was correct at the time of the stated reporting period (for example, for data points referring to the future or "the next two years"). Organizations undergoing (or that have undergone) M&As need to consider the timing of the M&As and reporting period as follows:
- Organizations that were acquired after the end of the current reporting period: these should respond with what was planned (strategy, targets, etc.) before being acquired (i.e., during the reporting period). For transparency, where possible they may state where they consider that the forward-looking information may be subject to change due to the very recent acquisition.
- Organizations that were acquired during the reporting period: these should provide information that was applicable and correct to the best of their knowledge at the end of the reporting period. At the time of submitting their response to CDP, this information may not be the most up to date due to changes underway following the acquisition. For transparency, the company may state this in their disclosure where possible.
Personal data
It is important that you do not include the name of any individual or any other personal data in your response. For questions that ask for the positions of staff, out of respect for personal data privacy we are asking only for the position and not for the individual’s name or any other information relating to them.
Providing feedback to CDP
You can provide feedback to CDP on the content of our questionnaires and supporting documents through our online general feedback form.
We are unable to respond individually to all feedback, but please be assured that all form submissions are reviewed and contribute towards our continuous improvement.
However, if you represent a responding organization and would like to request a response, please get in touch with your local CDP contact.
Sector introduction: Agricultural commodities (AC)
Activities in the agricultural commodities sector include producing, processing and distributing raw materials (crops and/or livestock) that will be used as ingredients in the manufacturing and packaging of consumer goods by the food, beverage and tobacco sector. This includes the small-scale production of non-timber forest products (e.g. rubber, nuts, seeds, etc.). The agricultural commodities sector is fundamentally dependent on natural resources, and thus directly affected by climate change. Climate-related risks associated with the sector include physical risks such as changing weather patterns, and regulatory risks relating to farm management practices (e.g. the use of fertilizers and pesticides, land use, livestock management etc.). Emissions are associated with the entire agricultural commodities value chain, therefore a whole value chain approach is advised; including consideration of emissions resulting from the consumption of products.
CDP’s agricultural commodities questions focus on the following topics:
- Land management practices with climate change mitigation/adaptation benefits;
- Biogenic carbon pertaining to direct operations;
- Commodity-specific emissions intensity data related to the activities performed by your organisation; and
- Scope 1 and Scope 3 emissions breakdowns by relevant business activity.
This CDP sector aligns with the TCFD’s Agriculture, Food, and Forest Products group, along with the food, beverage and tobacco (FB), and paper & forestry sectors (PF).
C0 Introduction
Module Overview
This module requests information about your organization’s disclosure to CDP and will help data users to interpret your responses in the context of your business operations, timeframe and reporting boundary.
The information provided here should apply consistently to your responses throughout the questionnaire and be complete and accurate as it may determine response options presented in subsequent modules.
For this reason, you should respond to every question in this module before accessing the rest of the questionnaire.
Key changes
- Modified questions:
- C0.2 – columns added to allow companies to restate a different number of years of data for each scope.
Click here for a list of all changes made this year.
Sector-specific content
Additional questions on organizational activities for the following high-impact sectors:
- Agricultural commodities
- Capital goods
- Cement
- Chemicals
- Coal
- Construction
- Electric utilities
- Financial services
- Food, beverage and tobacco
- Metals & mining
- Oil & gas
- Paper & forestry
- Real estate
- Steel
- Transport original equipment manufacturers (OEMs)
- Transport services
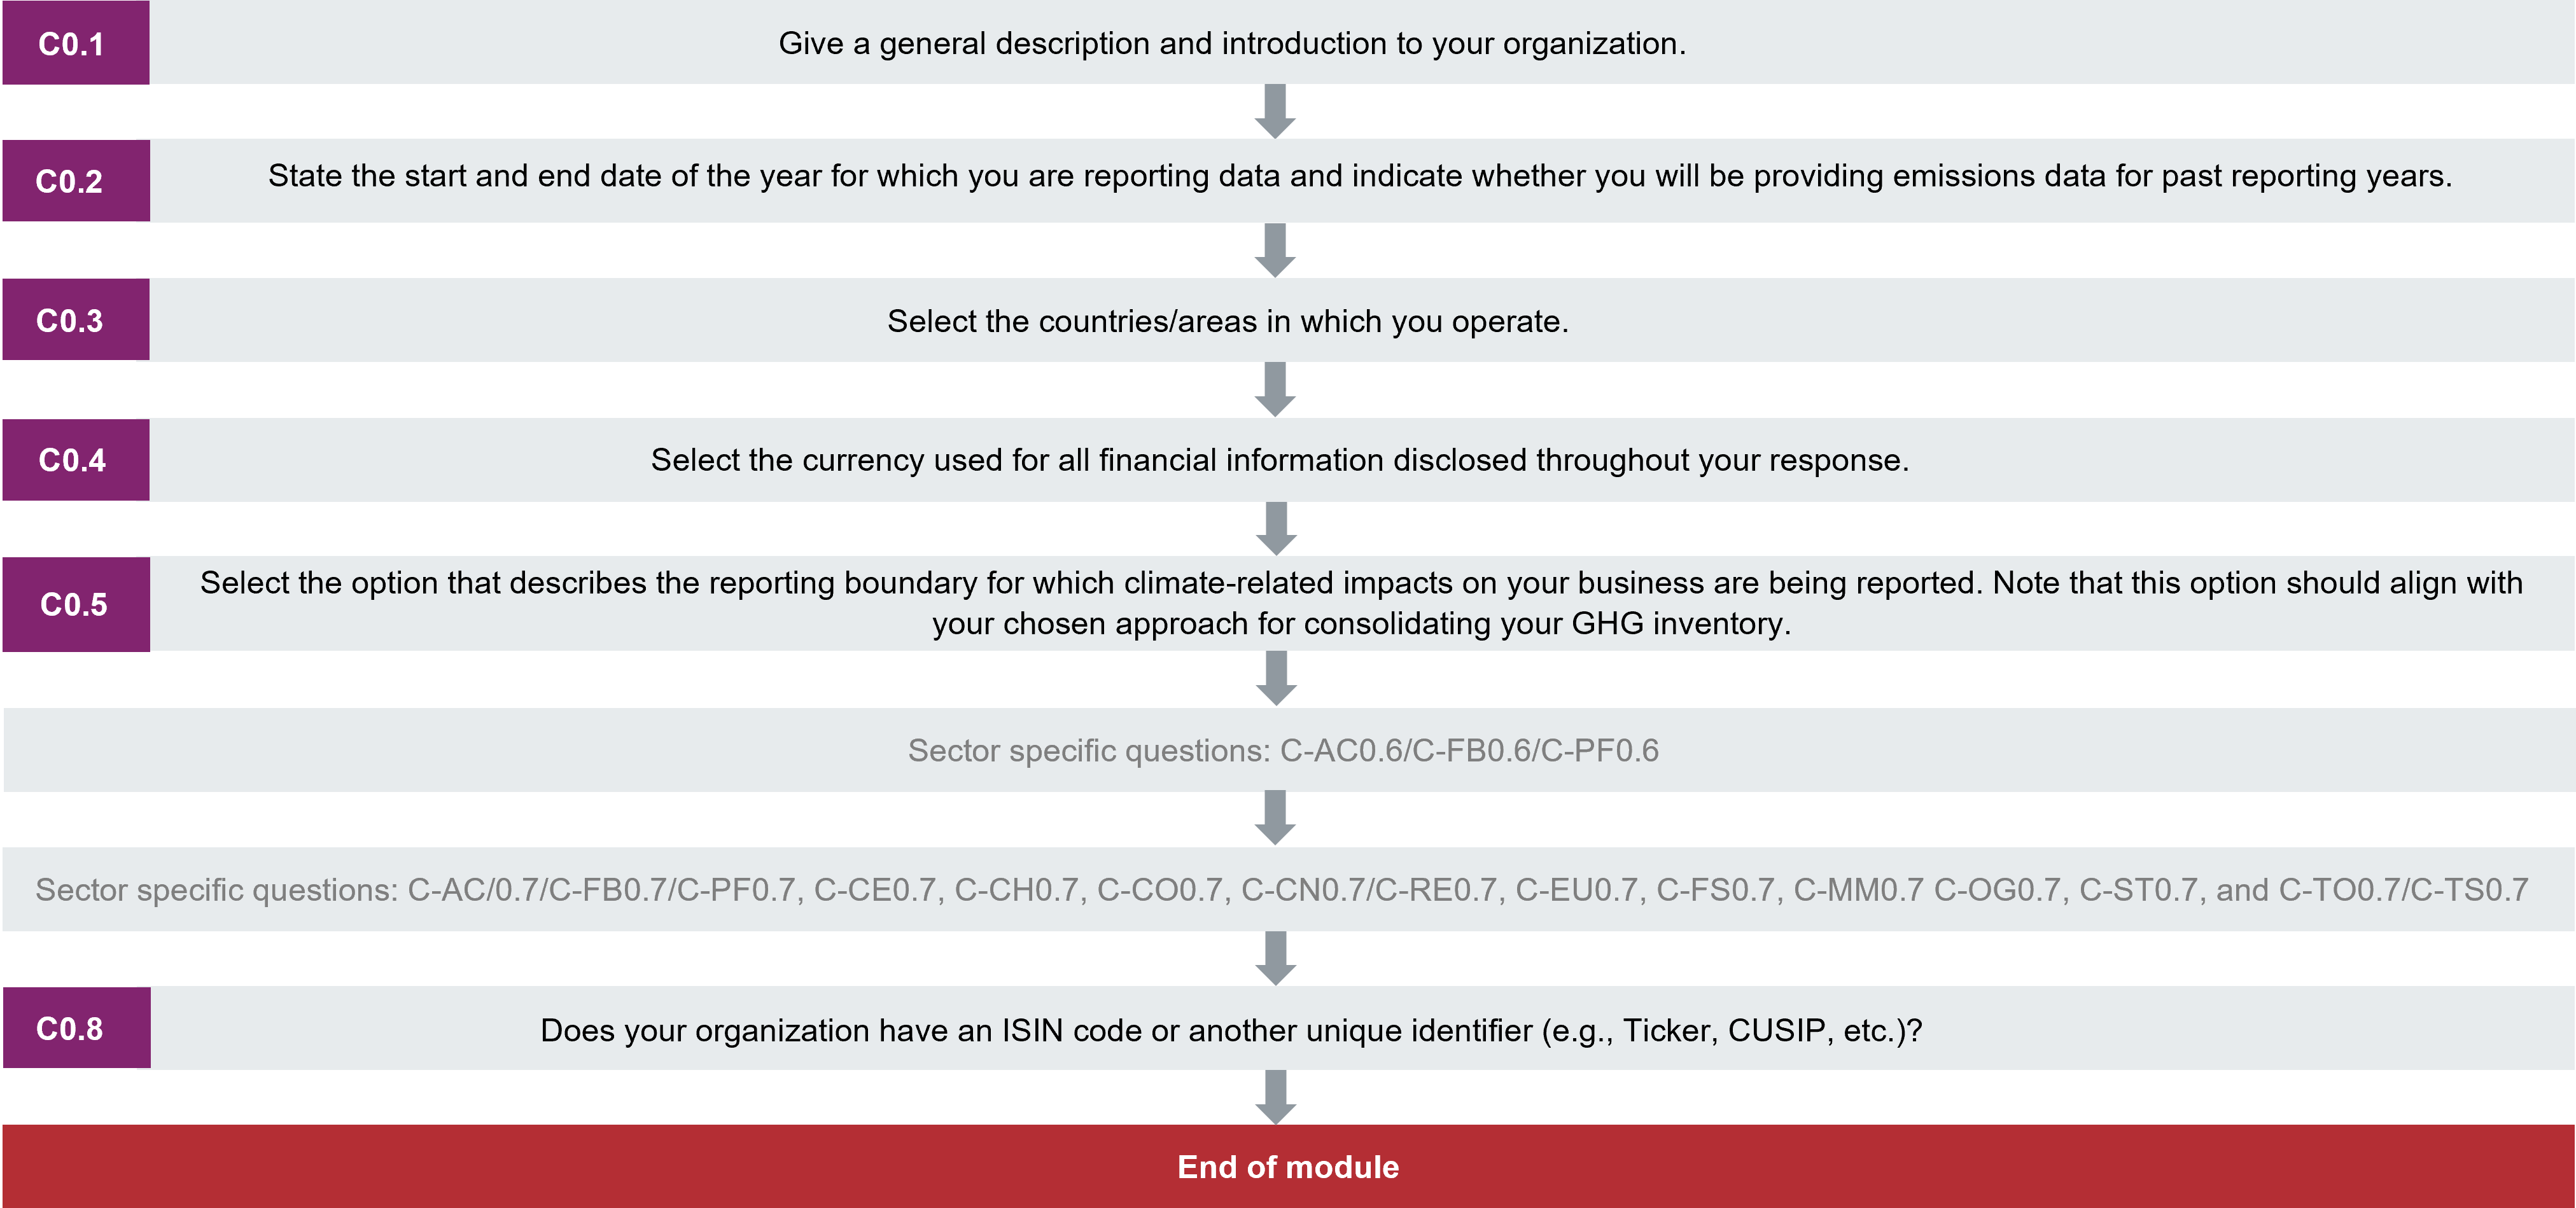
Pathway diagram - questions
This diagram shows the general questions contained in module C0. To access question-level guidance, use the menu on the left to navigate to the question.
Introduction
(C0.1) Give a general description and introduction to your organization.
Change from last year
No change
Rationale
This will help data users interpret your responses.
Response options
This is an open text question with a limit of 5,000 characters.
Please note that when copying from another document into the ORS, formatting is not retained.
Requested content
General
- Provide information about your operations to help data users understand your greenhouse gas (GHG) emissions inventory and corporate climate change strategy. Include information on your business divisions and your emissions-generating activities (e.g. extraction and/or processing/refining of natural resources, electricity generation, transportation, manufacturing etc.).
-
This information helps data users understand your company’s emissions profile and differences in emissions figures between peer companies.
- You may also provide any other information which is relevant to your disclosure.
Explanation of terms
- Organization: Throughout this questionnaire, “your organization” refers collectively to all the companies, businesses, other entities or groups that fall within the definition of your reporting boundary (provided in C0.5). This term is used interchangeably with “your company”, but CDP recognizes that some disclosing organizations may not consider themselves to be, or be formally classified, as “companies”.
(C0.2) State the start and end date of the year for which you are reporting data and indicate whether you will be providing emissions data for past reporting years.
Change from last year
Modified question
Rationale
This will help data users interpret your responses.
Ambition: Companies disclose historic data that enables progress over time to be tracked.
Connection to other frameworks
RE100
Response options
Please complete the following table. *Column/row appearance is dependent on selections in this or other questions.
| Start date
|
End date
|
Indicate if you are providing emissions data for past reporting years
|
Select the number of past reporting years you will be providing Scope 1 emissions data for*
|
Select the number of past reporting years you will be providing Scope 2 emissions data for*
|
Select the number of past reporting years you will be providing Scope 3 emissions data for*
|
|
From: [DD/MM/YYYY]
|
To: [DD/MM/YYYY]
|
Select from:
|
Select from:
- 1 year
- 2 years
- 3 years
- 4 years
- 5 years
- Not providing past emissions data for Scope 1
|
Select from:
- 1 year
- 2 years
- 3 years
- 4 years
- 5 years
- Not providing past emissions data for Scope 2
|
Select from:
- 1 year
- 2 years
- 3 years
- 4 years
- 5 years
- Not providing past emissions data for Scope 3
|
Requested content
General
- Apply this reporting year to your answers for the entire questionnaire unless the ability is provided to specify other reporting periods.
- Please ensure that the reporting period represents only one full year that has already passed. Reporting periods should not be in the future. This information is important for others to understand the time dimension of your disclosure.
- If you are using the Export/Import functionality, please check that the imported date is correct.
- The current reporting year is the most recent 12-month period for which data is reported.
- This reporting period applies to all answers except where other reporting periods can be disclosed. CDP does not require companies to align their reporting year with their fiscal year. However, when organizations report emissions intensity using a financial metric, both emissions and financial information provided should align with the reporting year reported here.
- Note that the investment community generally prefers a company's disclosure period to match the fiscal year for their financial jurisdiction. This facilitates the assessment of environmental performance data in alignment with financial performance data.
- CDP recommends that companies provide a year for which they have complete data if possible. However, if you do not have data for the entirety of your reporting year, you have the following options:
- Extrapolate your data to cover the entire reporting year.
- Outline in C6.4 the sources of Scope 1 and 2 emissions within your selected reporting boundary and not included in your disclosure.
- Select "No" in column 3 (Indicate if you are providing data for past reporting years) unless you are a first time responder providing emissions from past years or a previous responder to CDP who is restating your emissions data. For more information on this see the note for first-time responders and the note for restating data below.
- If multiple years of data are provided, only data pertaining to the most recent reporting year will be scored.
Note for first-time responders:
- If you have not provided emissions data before, supply gross global emissions data for the five years prior to the current reporting year in the emissions accounting questions (C6.1 and C6.3) for Scopes 1 and 2, and in C6.5a for Scope 3.
- To report emissions data for years prior to the current reporting year, select "Yes" in column 3 ("Indicate if you are providing emissions data for past reporting years"). Then select how many years of emissions data you will be providing for each Scope in columns 4-6. You should aim to provide the same number of past years of emissions data for all Scopes.
- This will enable you to enter the corresponding number of past years of data when you reach questions C6.1, C6.3, and C6.5a.
Note for restating data:
- You may also choose to restate your emissions data previously supplied to CDP, for example to ensure that your historical data reflects your current organizational boundary.
- Reporting recalculated figures for these years is optional. However, if you wish to do this it can provide transparency to stakeholders using your data.
- If you choose to restate data previously supplied to CDP, report the dates of those reporting periods here by selecting "Yes" in column 3 ("Indicate if you are providing emissions data for past reporting years"). Then select how many years of emissions data you will be providing for each Scope in columns 4-6.
- This will enable you to enter the corresponding number of past years of data when you reach questions C6.1, C6.3, and C6.5a.
- For more information on restatements see CDP's technical note on restatements here.
Note for financial services companies:
- The number of past years data for Scope 3 will also determine the number of past years data for portfolio emission data in question C-FS14.1c.
(C0.3) Select the countries/areas in which you operate.
Change from last year
No change
Rationale
This will help data users interpret your responses.
Connection to other frameworks
RE100
Response options
Please complete the following table:
| Country/area
|
|
Select all that apply:
[Country/area drop-down list]
|
Requested content
General
- Select all countries/areas in which you operate from the drop-down menu provided.
(C0.4) Select the currency used for all financial information disclosed throughout your response.
Change from last year
No change
Rationale
CDP encourages companies to report financial figures associated with their impacts, risks, and opportunities. Establishing a single currency will facilitate the collection of comparable financial information. This will benefit investors and other data users when assessing the costs and benefits reported by your organization.
Response options
Please complete the following table:
| Currency
|
|
Select from:
[Currency drop-down list]
|
Requested content
General
- Select the currency to be applied to all financial information reported in this disclosure.
- For example, if you select USD($), provide metric tons CO2e per USD($) as the financial intensity metric in question C6.10.
(C0.5) Select the option that describes the reporting
boundary for which climate-related impacts on your business are being reported. Note that this option should align with your chosen approach for consolidating your GHG inventory.
Change from last year
No change
Rationale
This will help data users interpret your responses.
Connection to other frameworks
RE100
Response options
Select one of the following options:
- Financial control
- Operational control
- Equity share
- Other, please specify
Requested content
General
- Use a consolidated approach when determining reporting boundaries. CDP recommends that you consult your legal or accounting advisors when doing so.
- The “consolidated approach” identifies which entities are included within the reporting boundary. Unless stated otherwise, the information you provide in response to the CDP climate change questionnaire should be presented as one “consolidated” result covering all of the companies, entities, businesses, etc., within your reporting boundary.
- To support the use, tracking, and comparability of reported GHG information, respondents are encouraged to adopt the consolidation approaches based on the GHG Protocol Corporate Standard, outlined in more detail in Chapter 3 of the Standard.
- If you have previously disclosed emissions data to CDP and your consolidation approach has changed in the current reporting year, select your new approach here and provide details of the change in C5.1b.
Further clarification of options
- The options in the drop-down for this question are based on the GHG Protocol Corporate Standard, and are described in more detail below (text adapted from the GHG Protocol Corporate Standard:
- Financial control: An organization has financial control over an operation if it has the ability to direct the financial and operating policies of the operation with a view to gaining economic benefits from its activities. Generally, an organization has financial control over an operation for GHG accounting purposes if the operation is treated as a group company or subsidiary for the purposes of financial consolidation.
- Companies using the CDSB framework should select this option.
- Operational control: An organization has operational control over an operation if it or one of its subsidiaries has the full authority to introduce and implement its operating policies at the operation.
- Most SMEs select this option.
- Equity share: Under the equity share approach, a company accounts for GHG emissions from operations according to its share of equity in the operation. The equity share reflects the economic interest, which is the extent of rights a company has to the risks and rewards flowing from an operation. Typically, the share of economic risks and rewards in an operation is aligned with the company’s percentage ownership of that operation, and equity share will normally be the same as the ownership percentage. Where this is not the case, the economic substance of the relationship the company has with the operation always overrides the legal ownership form to ensure the equity share reflects the percentage of economic interest. The principle of economic substance taking precedence over legal form is consistent with international financial reporting standards.
Explanation of terms
- Company: Throughout this questionnaire, “your company” refers collectively to all the companies, businesses, organizations, other entities or groups that fall within your definition of the reporting boundary. This term is used interchangeably with “your organization”, but CDP recognizes that some disclosing organizations may not consider themselves to be, or be formally classified, as “companies”.
- Consolidation approach: The identification of companies, businesses, organizations etc. for inclusion within the reporting boundary of the responding organization. The way in which you report information for the companies that are included within the reporting boundary is known as the “consolidation approach” because, unless stated otherwise, the information you provide in response to the questionnaire should be presented as one “consolidated” result covering all of the companies, entities, businesses etc within your reporting boundary. The GHG Protocol states that two distinct approaches may be used to consolidate GHG emissions; the equity share and the control approaches. Control can be defined in either financial (financial control) or operational (operational control) terms. This term is used interchangeably with “your organization”, but CDP recognizes that some disclosing organizations may not consider themselves to be, or be formally classified, as “companies”.
- GHG inventory: a quantified list of an organization’s greenhouse gas emissions and sources.
- Organization: Throughout this questionnaire, “your organization” refers collectively to all the companies, businesses, other entities or groups that fall within the definition of your reporting boundary (provided in C0.5). This term is used interchangeably with “your company”, but CDP recognizes that some disclosing organizations may not consider themselves to be, or be formally classified, as “companies”.
- Reporting boundary: This determines which organizational entities, such as groups, businesses and companies, are included in or excluded from your disclosure. These may be included according to your financial control, operational control, equity share or another measure. Please consistently apply this organizational boundary when responding to questions unless you are specifically asked for data about another category of activities.
Business activities emissions relevancy
(C-AC0.6/C-FB0.6/C-PF0.6) Are emissions from agricultural/forestry, processing/manufacturing, distribution activities or emissions from the consumption of
your products – whether in your direct operations or in other parts of your value chain – relevant to your current
CDP climate change disclosure?
Question dependencies
Your response to this question determines which questions will be shown throughout this questionnaire and which response options will be listed within these questions.
Change from last year
No change
Rationale
This question determines which agricultural business activities your organization performs and/or engages in that are relevant for this disclosure. This will provide context on your agricultural activities to investors and other data users as well as help your organization set reporting boundaries.
Response options
Please complete the following table:
| Business activity
|
Relevance
|
|
Agriculture/Forestry
|
Select from:
- Own land only
- Elsewhere in the value chain only
- Both own land and elsewhere in the value chain
- No
|
|
Processing/Manufacturing
|
Select from:
- Direct operations only
- Elsewhere in the value chain only
- Both direct operations and elsewhere in the value chain
- No
|
|
Distribution
|
Select from:
- Direct operations only
- Elsewhere in the value chain only
- Both direct operations and elsewhere in the value chain
- No
|
|
Consumption
|
Select from:
|
Requested content
General
- According to the GHG Protocol Corporate Accounting and Reporting Standards, the activity is relevant if it yields pertinent information to decision-making (for both internal and external users) regarding climate related issues.
- Note you should consider aspects associated with the listed business activities that are relevant to the agricultural sectors. For example, processing/manufacturing may refer to the processing of soft commodities or the manufacture of food, beverage, tobacco and/or wood-based goods.
Business activity (column 1)
- Provide an answer to each of the following activities listed regarding your business activities and considering your whole value chain.
- Consider the following regarding each activity:
- The sources of Agricultural/Forestry emissions predominantly comprise:
- Carbon dioxide from the decay or burning of biological or soil organic matter, fuel combustion and electricity generation in farm operations;
- Methane from the decomposition of organic materials in oxygen-deprived conditions, notably from the digestion of livestock, from stored manures, and from rice growing;
- Nitrous oxide from transformation of nitrogen in soils and manures (including fertilizer application and indirect emissions from fertilizer production in your supply chain).
- All these sources of emissions can be classified as either mechanical or non-mechanical emissions (See the GHG Protocol Agricultural Guidance for further details)
- Emissions from the processing of raw materials and wood, or the manufacture of food, beverage and tobacco products are associated with all processes adopted, and all methods and techniques used, to transform raw agricultural inputs/timber products into final products ready for human consumption, including:
- Pre-processing (relevant if companies use processed inputs, e.g. sugar)
- Primary grading/ screening to ensure uniformity
- Storage during different processing stages
- Cleaning to remove and separate off-specification material, organic and non-organic debris, metals, and pesticide residues among other contaminants
- Cutting, trimming, rolling and peeling to re-shape and remove inedible parts
- Cooking, canning, evaporating, drying and freezing
- Pulping and filtration
- Packaging of the final product to provide containment, protection, communication, and convenience
- Packaging for transport in, e.g. crates or pallets
- Waste generated during processing activities
- Distribution encompasses the entire network required to move products through the value chain from the farm/production unit to the retail location. You should consider all the stages of distribution in your disclosure, i.e.:
- Transportation of raw agricultural/forest products to processing facilities;
- Transportation of material inputs to processing facilities, for example, packaging materials, chemicals, wood and any other ingredients;
- Product distribution from processing facilities to the retailer/customer;
- Transportation of waste to disposal sites or to points of re-use;
- In each of the cases listed for transportation above, you should also account for emissions from: empty return journeys; the storage of goods during distribution, (as this can often require specific controls for humidity, temperature, atmospheric conditions and hygiene requirements); and the waste generated during transportation
- The consumption stage includes the use of goods in addition to waste disposal and end of life treatment of products sold by the reporting organization. You should consider:
- Emissions from the cooling, freezing and heating of sold products;
- Waste disposal and end of life treatment of products, i.e., emissions associated with land filling, incineration, composting, recycling and wastewater treatment.
- Note that the calculation of emissions associated with consumption and end life treatment may require reporting companies to make assumptions regarding how consumers use products; product lifetimes; and end of life treatment methods chosen by consumers.
Relevance (column 2)
- If an activity performed by/associated with your organization is relevant, specify which parts of your value chain this activity applies. For example, if all agricultural activities take place within your organizational boundary i.e. your organization grows all of its agricultural products on self-owned/managed farms, select “Own land only” for row Agriculture/Forestry. If you purchase all your agricultural inputs from agricultural suppliers, select “Elsewhere in value chain only.” If your organization grows some of its agricultural inputs and buys some from agricultural suppliers, select “Both own land and elsewhere in value chain.”
- Note that if you would like to add or delete a certain activity later in the questionnaire, return to this question and edit your response accordingly. If you decide to delete an activity by selecting "No" in this column, your previous responses to linked questions will be erased. For example, if you indicate that "Processing/Manufacturing" is not relevant anymore, the row associated with this activity will be erased in C-AC6.8a/C-FB6.8a/C-PF6.8a.
Explanation of terms
- Agriculture/Forestry: Agriculture is the cultivation and breeding of animals, plants, and fungi for food, fiber, biofuels, drugs or other purposes. While forestry is the creation and management of forests, including wood harvesting. These activities have a direct impact on land and thus are closely associated with deforestation and greenhouse gas emissions from land use.
- Consumption: Consumption includes the use of goods, waste disposal and end of life treatment of products sold by the reporting organization.
- Distribution (agriculture/forestry): Distribution encompasses the entire network required to move products through the value chain from the farm/forest to the retail location. The total travel distance and the mode of transport will impact the amount of emissions produced: air transport has by far the highest GHG emissions, followed by road, then ocean freight and rail (Source: Institute for Agriculture and Trade Policy, 2009).
- Processing/Manufacturing (agriculture/forestry): Includes all processes adopted, and all methods and techniques used, to transform raw agricultural or wood products inputs into final goods ready for human consumption. Direct and indirect emissions from processing result from the operation of machinery and equipment, as well as from heating, cooling, and refrigeration.
- Value chain: The entire sequence of activities or partners that provide value to or receive value from an organization's products and services, either within, upstream or downstream of direct operations. For further details on reporting boundaries please consult the GHG Protocol Corporate Value Chain (Scope 3) Accounting and Reporting Standard.
(C-AC0.6a/C-FB0.6a/C-PF0.6a) Why are agricultural/forestry activities not relevant to your current
CDP climate change disclosure?
Question dependencies
This question only appears if you select "No" in response to the "Agriculture/Forestry" row in C-AC0.6/C-FB0.6/C-PF0.6.
Change from last year
No change
Rationale
This question provides further context to data users about why you have indicated that agricultural/forestry activities are not relevant to this disclosure and whether you have fully assessed the potential climate-related risks and impacts to your business related to these activities.
Response options
Please complete the following table:
| Primary reason
|
Please explain
|
|
Select from:
- Outside the value chain of my organization
- Analysis in progress
- Evaluated but judged to be unimportant
- Not evaluated due to insufficient data on operations
- Not evaluated due to lack of internal resources
- No instruction from management
- Other, please specify
|
Text field [maximum 4,000 characters]
|
Requested content
Primary reason (column 1)
- Select the option that best describes the primary reason why you indicated that emissions from agricultural/forestry activities are not relevant.
- If none of the reasons apply to your organization, select "Other, please specify" and indicate the primary reason agricultural/forestry activities are not relevant for your organization. If you need more than 40 characters, please use column 2 "Please explain".
Please explain (column 2)
- If you selected "Outside the value chain of my organization" or "Evaluated but judged to be unimportant", describe your evaluation methods, indicating the procedures and tools used for evaluating the relevance of this activity. Specify parts of your business included in the analysis and the criteria used to decide that the activity was not relevant.
- If you selected the dropdown "Analysis in progress" in column 1, provide a date for when it will be finalized in this column.
- If you selected "Not evaluated due to lack of internal resources", specify the main challenges you experience to performing such analysis.
- If you selected "Not evaluated due to insufficient data on operations" or "Not evaluated due to lack of internal resources", indicate if you have any plans to evaluate the relevancy of this activity to your climate change disclosure in the next two years and if so, describe the methods and coverage for this upcoming analysis.
(C-AC0.6b/C-FB0.6b/C-PF0.6b) Why are emissions from agricultural/forestry activities undertaken on your own land not relevant to your current CDP climate change disclosure?
Question dependencies
This question only appears if you select "Elsewhere in the value chain only" in response to the "Agriculture/Forestry" row in C-AC0.6/C-FB0.6/C-PF0.6.
Change from last year
No change
Rationale
This information provides further context to data users as to why you have indicated agricultural/forestry activities pertaining to your own land are not relevant and whether you have fully assessed the potential climate-related risks and impacts to your business related to these activities.
Response options
Please complete the following table:
| Primary reason
|
Please explain
|
|
Select from:
- Do not own/manage land
- Analysis in progress
- Evaluated but judged to be unimportant
- Not evaluated due to insufficient data on operations
- Not evaluated due to lack of internal resources
- No instruction from management
- Other, please specify
|
Text field [maximum 4,000 characters]
|
Requested content
Primary reason (column 1)
- Select the option that best describes the primary reason for why you indicated that emissions from agricultural/forestry activities performed on owned/managed land are not relevant to this disclosure.
- If none of the reasons apply to your organization, select "Other, please specify" and indicate the primary reason agricultural/forestry activities performed on owned/managed land are not relevant for your organization. If you need more than 40 characters, please use column 2 "Please explain".
Please explain (column 2)
- If you selected "Do not own/manage land", "Analysis in progress" or "Evaluated but judged to be unimportant", describe your evaluation methods, indicating the procedures and tools used for evaluating the relevance of this activity. Specify parts of your business included in the analysis and the criteria used to decide that the activity was not relevant.
- If you selected the dropdown "Analysis in progress" in column 1, provide a date for when it will be finalized in this column.
- If you selected "Not evaluated due to lack of internal resources", specify the main challenges you experience to performing such analysis.
- If you selected "Not evaluated due to insufficient data on operations" or "Not evaluated due to lack of internal resources", indicate if you have any plans to evaluate the relevancy of this activity to your climate change disclosure in the next two years and if so, describe the methods and coverage for this upcoming analysis.
(C-AC0.6c/C-FB0.6c/C-PF0.6c) Why are processing/manufacturing activities not relevant to your current CDP climate change
disclosure?
Question dependencies
The question only appears if you select "No" in response to the "Processing/Manufacturing" row in C-AC0.6/C-FB0.6/C-PF0.6.
Change from last year
No change
Rationale
This question provides further context to data users as to why you have indicated that processing/manufacturing activities are not relevant and whether you have fully assessed the potential climate-related risks and impacts to your business related to these activities.
Response options
Please complete the following table:
| Primary reason
|
Please explain
|
|
Select from:
- Outside the value chain of my organization
- Analysis in progress
- Evaluated but judged to be unimportant
- Not evaluated due to insufficient data on operations
- Not evaluated due to lack of internal resources
- No instruction from management
- Other, please specify
|
Text field [maximum 4,000 characters]
|
Requested content
Primary reason (column 1)
- Select the option that best describes the primary reason why you indicated that emissions from processing/manufacturing activities are not relevant to this disclosure.
- If none of the reasons apply to your organization, select "Other, please specify" and indicate the primary reason processing/manufacturing activities performed are not relevant for your organization. If you need more than 40 characters, please use column 2 "Please explain".
Please explain (column 2)
- If you selected "Outside the value chain of my organization", "Analysis in progress" or "Evaluated but judged to be unimportant", describe your evaluation methods, indicating the procedures and tools used for evaluating the relevance of this activity. Specify parts of your business included in the analysis and the criteria used to decide that the activity was not relevant.
- If you selected the dropdown "Analysis in progress" in column 1, provide a date for when it will be finalized in this column.
- If you selected "Not evaluated due to lack of internal resources", specify the main challenges you experience to performing such analysis.
- If you selected "Not evaluated due to insufficient data on operations" or "Not evaluated due to lack of internal resources" indicate if you have any plans to evaluate the relevancy of this activity to your climate change disclosure in the next two years and if so, describe the methods and coverage for this upcoming analysis.
(C-AC0.6d/C-FB0.6d/C-PF0.6d) Why are emissions from processing/manufacturing activities
within your direct operations not relevant to your current CDP climate change
disclosure?
Question dependencies
This question only appears if you select "Elsewhere in the value chain only" in response to the "Processing/Manufacturing" row in C-AC0.6/C-FB0.6/C-PF0.6.
Change from last year
No change
Rationale
This information provides further context to data users about why you have indicated that processing/manufacturing activities, pertaining to your direct operations, are not relevant to this disclosure and whether you have fully assessed the potential climate-related risks and impacts to your business related to these activities.
Response options
Please complete the following table:
| Primary reason
|
Please explain
|
|
Select from:
- Outside the direct operations of my organization
- Analysis in progress
- Evaluated but judged to be unimportant
- Not evaluated due to insufficient data on operations
- Not evaluated due to lack of internal resources
- No instruction from management
- Other, please specify
|
Text field [maximum 4,000 characters]
|
Requested content
Primary reason (column 1)
- Select the option that best describes the primary reason for why you indicated that emissions from processing/manufacturing activities pertaining to your direct operations are not relevant to this disclosure.
- If none of the reasons are suitable, select “Other, please specify” and indicate the primary reason processing/manufacturing activities pertaining to your direct operations are not relevant for your organization. If you need more than 40 characters, please use column 2 “Please explain”.
Please explain (column 2)
- If you selected "Outside the direct operations of my organization", "Analysis in progress" or "Evaluated but judged to be unimportant", describe your evaluation methods, indicating the procedures and tools used for evaluating the relevance of this activity. Specify parts of your business included in the analysis and the criteria used to decide that the activity was not relevant.
- If you selected the dropdown "Analysis in progress" in column 1, provide a date for when it will be finalized in this column.
- If you selected "Not evaluated due to lack of internal resources", specify the main challenges you experience to performing such analysis.
- If you selected "Not evaluated due to insufficient data on operations" or "Not evaluated due to lack of internal resources" indicate if you have any plans to evaluate the relevancy of this activity to your climate change disclosure in the next two years and if so, describe the methods and coverage for this upcoming analysis.
(C-AC0.6e/C-FB0.6e/C-PF0.6e) Why are distribution activities not relevant
to your current CDP climate change disclosure?
Question dependencies
This question only appears if you select "No" in response to the "Distribution" row in C-AC0.6/C-FB0.6/C-PF0.6.
Change from last year
No change
Rationale
This information provides further context to data users about why you have indicated that distribution activities are not relevant to this disclosure and whether you have fully assessed the potential climate-related risks and impacts to your business related to these activities.
Response options
Please complete the following table:
| Primary reason
|
Please explain
|
|
Select from:
- Outside the value chain of my organization
- Analysis in progress
- Evaluated but judged to be unimportant
- Not evaluated due to insufficient data on operations
- Not evaluated due to lack of internal resources
- No instruction from management
- Other, please specify
|
Text field [maximum 4,000 characters]
|
Requested content
Primary reason (column 1)
- Select the option that best describes the primary reason for why you indicated that emissions from distribution activities are not relevant to this disclosure.
- If none of the reasons are suitable, select "Other, please specify" and indicate the primary reason distribution activities are not relevant for your organization. If you need more than 40 characters, please use column 2 "Please explain".
Please explain (column 2)
- If you selected "Outside the value chain of my organization", "Analysis in progress" or "Evaluated but judged to be unimportant", describe your evaluation methods, indicating the procedures and tools used for evaluating the relevance of this activity. Specify parts of your business included in the analysis and the criteria used to decide that the activity was not relevant.
- If you selected the dropdown "Analysis in progress" in column 1, provide a date for when it will be finalized in this column.
- If you selected "Not evaluated due to lack of internal resources", specify the main challenges you experience to performing such analysis.
- If you selected "Not evaluated due to insufficient data on operations" or "Not evaluated due to lack of internal resources", indicate if you have any plans to evaluate the relevancy of this activity to your climate change disclosure in the next two years and if so, describe the methods and coverage for this upcoming analysis.
(C-AC0.6f/C-FB0.6f/C-PF0.6f) Why are emissions from distribution activities within your direct
operations not relevant to your current CDP climate change disclosure?
Question dependencies
This question only appears if you select "Elsewhere in the value chain only" in response to the "Distribution" row in C-AC0.6/C-FB0.6/C-PF0.6.
Change from last year
No change
Rationale
This information provides further context to data users about why you have indicated that distribution activities, pertaining to your direct operations, are not relevant to this disclosure and whether you have fully assessed the potential climate-related risks and impacts to your business related to these activities.
Response options
Please complete the following table:
| Primary reason
|
Please explain
|
|
Select from:
- Outside the direct operations of my organization
- Analysis in progress
- Evaluated but judged to be unimportant
- Not evaluated due to insufficient data on operations
- Not evaluated due to lack of internal resources
- No instruction from management
- Other, please specify
|
Text field [maximum 4,000 characters]
|
Requested content
Primary reason (column 1)
- Select the option that best describes the primary reason for why you indicated that emissions from distribution activities pertaining to your direct operations are not relevant to this disclosure.
- If none of the reasons are suitable, select "Other, please specify" and indicate the primary reason distribution activities pertaining to your direct operations are not relevant for your organization. If you need more than 40 characters, please use column 2 "Please explain".
Please explain (column 2)
- If you selected "Outside the direct operations of my organization", "Analysis in progress" or "Evaluated but judged to be unimportant", describe your evaluation methods, indicating the procedures and tools used for evaluating the relevance of this activity. Specify parts of your business included in the analysis and the criteria used to decide that the activity was not relevant.
- If you selected the dropdown "Analysis in progress" in column 1, provide a date for when it will be finalized in this column.
- If you selected "Not evaluated due to lack of internal resources", specify the main challenges you experience to performing such analysis.
- If you selected "Not evaluated due to insufficient data on operations" or "Not evaluated due to lack of internal resources", indicate if you have any plans to evaluate the relevancy of this activity to your climate change disclosure in the next two years and if so, describe the methods and coverage for this upcoming analysis.
(C-AC0.6g/C-FB0.6g/C-PF0.6g) Why are emissions from the consumption of your products not relevant
to your current CDP climate change disclosure?
Question dependencies
This question only appears if you select "No" in response to the "Consumption" row in C-AC0.6/C-FB0.6/C-PF0.6.
Change from last year
No change
Rationale
This information provides further context to data users about why you have indicated that the consumption and end of life treatment of your products are not relevant to this disclosure and whether you have fully assessed the potential climate-related risks and impacts to your business related to these activities.
Response options
Please complete the following table:
| Primary reason
|
Please explain
|
|
Select from:
- Analysis in progress
- Evaluated but judged to be unimportant
- Not evaluated due to insufficient data on operations
- Not evaluated due to lack of internal resources
- No instruction from management
- Other, please specify
|
Text field [maximum 4,000 characters]
|
Requested content
Primary reason (column 1)
- Select the option that best describes the primary reason for why you indicated that emissions from the consumption of your products are not relevant to this disclosure.
- If none of the reasons are suitable, select "Other, please specify" and indicate the primary reason emissions from the consumption of your products are not relevant for your organization. If you need more than 40 characters, please use column 2 "Please explain".
Please explain (column 2)
- If you selected "Analysis in progress" or "Evaluated but judged to be unimportant", describe your evaluation methods, indicating the procedures and tools used for evaluating the relevance of this activity. Specify parts of your business included in the analysis and the criteria used to decide that the activity was not relevant.
- If you selected the dropdown "Analysis in progress" in column 1, provide a date for when it will be finalized in this column.
- If you selected "Not evaluated due to lack of internal resources", specify the main challenges you experience to performing such analysis.
- If you selected "Not evaluated due to insufficient data on operations" or "Not evaluated due to lack of internal resources", indicate if you have any plans to evaluate the relevancy of this activity to your climate change disclosure in the next two years and if so, describe the methods and coverage for this upcoming analysis.
Agricultural commodity dependency
(C-AC0.7/C-FB0.7/C-PF0.7) Which agricultural commodity(ies)
that your organization produces and/or sources are the most significant to your
business by revenue? Select up to five.
Change from last year
No change
Rationale
This question gathers information that enables CDP data users to understand how reliant your business is on agricultural commodities that:
- are highly dependent on natural capital and its associated ecosystem services that are under risk due to climate change; and/or
- are closely associated with high CO2e emissions, either from their production/exploitation or from processing/manufacturing/distribution activities.
This information signals your organization’s exposure to climate-related risks.
Revenue has been chosen as the unique metric to express business dependency, as it is already calculated by many organizations and provides a clear message to investors about an organization's financial dependency. CDP acknowledges that this metric may have caveats, including the impact of yearly fluctuations in currency, which could represent a challenge to responders. However, establishing a standard metric helps data users evaluate and compare various organizations within the sector.
Response options
Please complete the following table. You are able to add rows using the "Add Row" button at the bottom of the table.
| Agricultural commodity
|
% of revenue dependent on this agricultural commodity
|
Produced or sourced
|
Please explain
|
|
Select from:
- Cattle products
- Cotton
- Fish and seafood from aquaculture
- Palm Oil
- Rice
- Soy
- Sugar
- Timber
- Tobacco
- Wheat
- Rubber
- Other, please specify
|
Select from:
- Less than 10%
- 10-20%
- 20-40%
- 40-60%
- 60-80%
- More than 80%
- Don’t know
|
Select from:
|
Text field [maximum 4,000 characters]
|
[Add Row]
Requested content
General
- Organizations are expected to report information for a maximum of five commodities.
- CDP recognizes that some organizations may not be able to report their top five commodities in terms of revenue dependency. If that is the case, respondents should still select their commodities and explain why revenue information is not available.
Agricultural commodities (column 1)
- Select the top five commodities according to their percentage of revenue associated.
- If none of the options apply to your organization, select "Other, please specify" and specify your commodity. Note that you should specify only one additional commodity.
% of revenue dependent on these agricultural commodities (column 2)
- If you do not know or do not calculate the percentage of revenue dependent upon these commodities, please select "Don’t know" and explain why in column 4 "Please explain".
Please explain (column 4)
- Provide details on how the "% of revenue" in column 2 that was dependent on the commodity was calculated. Specify if there are any exclusions and the rationale for such exclusions.
- If you select the option "Don’t know" in column 2 (% of revenue…), explain why you listed that agricultural commodity as one of the five most important for your business.
- If you are unable to provide revenue data because you use a different metric to evaluate your key agricultural commodities, please explain why this is the case and specify the metric you use.
- If you do not consider any of your key commodities under risk due to climate change or large CO2e emissions, provide an explanation here and specify if this statement is the result of an evaluation made.
Example response
| Agricultural commodity | % of revenue dependent on this agricultural commodity | Produced or sourced | Please explain |
|---|
| Cattle products | 20-40% | Produced | The largest percentage of our revenue (approximately
39%) is associated with beef and other cattle products that are produced in our
own farms. To calculate this figure, we have considered all of our own-branded cattle
products and their associated revenue in the past financial year. |
| Soy | 10-20% | Produced; Sourced | Soybeans for animal feed constitute 12% of our
total revenue. To calculate this figure, we have considered all of our soy-based
animal feed production and its associated revenue in the past financial year. |
Explanation of terms
- Revenue: Income arising in the course of an entity’s ordinary activities (less returns, allowances and discounts) - before deducting costs for the goods/services sold and operating expenses to arrive at profit (based on the International Financial Reporting Standard)
(C0.8) Does your organization have an ISIN code or another unique identifier (e.g., Ticker, CUSIP, etc.)?
Change from last year
No change
Rationale
ISIN codes and other market identifiers are used globally in the identification of securities such as bonds, futures, and stocks. Providing your organization’s unique identifier(s) will increase the transparency of your response.
Response options
Please complete the following table:
(*column/row appearance is dependent on selections in this or other questions)
| Indicate whether you are able to provide a unique identifier for your organization | Provide your unique identifier* |
|---|
Select from:- Yes, an ISIN code
- Yes, a CUSIP number
- Yes, a Ticker symbol
- Yes, a SEDOL code
- Yes, another unique identifier, please specify
- No
| Text field [maximum 50 characters] |
[Add row]
Requested content
General
- If your organization has multiple unique identifiers, add a row for each.
Provide your unique identifier (column 2)
- This column is only presented if one of the “Yes” options is selected in column 1.
- Ensure that you enter the correct format for your unique identifier. For example, ISIN codes include a two-letter country/area code, followed by a nine-character alphanumeric identifier and a single check digit.
Explanation of terms
- ISIN: International Securities Identification Number, a 12-character alphanumeric code used to identify a security, such as a stock or bond. It is structured with the first two letters referencing the country/area of origin of the issuer for the security, in accordance with ISO 3166. The second grouping consists of nine characters made up of digits and letters, which is the unique identifying code for the security. In the U.S. and Canada this is known as the CUSIP number (see below). The final digit is the check digit, which ensures the authenticity of the code.
- CUSIP number: Committee on Uniform Security Identification Procedures number, a 9-character alphanumeric code that identifies a security for the purposes of facilitating clearing and settlement of trades. CUSIPs are used to distinguish, among other reasons, between multiple share classes or bond tranches. CUSIPs are mostly used in the United States and Canada.
- Ticker symbol: A ticker symbol, also known as a stock symbol, is a unique series of letters assigned to a security for trading purposes. Ticker symbols are usually related to the organization’s name, and additional letters denote additional characteristics such as share class or trading restrictions.
- SEDOL code: Stock Exchange Daily Official List code, a 7-character identification code consisting of two parts: a 6-character alphanumeric code and a trailing check digit. SEDOLs issued prior to January 26, 2004 were composed only of numbers. SEDOLs serve as the National Securities Identifying Number for all securities issued in the United Kingdom.
C1 Governance
Module Overview
Board-level oversight of climate-related issues is considered best practice and provides an indication of the importance of climate-related issues to the organization.
This module is intended to capture the governance structure of your company with regard to climate change, and provides data users with an understanding of the organization's approach to climate-related issues at the board level and management level.
Key changes
- Removed questions:
- C1.2a (2022) – asking where in the organizational structure the positions with responsibility for climate related issues are. These data points have been merged into C1.2
- Modified questions:
- C1.1a – has new dropdown options on positions on the board with responsibility for climate-related issues.
- C1.1b – has new response options on governance mechanisms including oversight of public policy engagement and climate transition plans.
- C1.2 – has new response options on management responsibilities including public policy engagement and climate transition plans. C1.2a merged into this question with ‘please explain’ column.
- C1.3a – has new response options on performance indicators and a new column on the contribution of the incentives to the organization’s climate commitments or climate transition plan.
Click here for a list of all changes made this year.
Sector-specific content
Additional questions on retirement schemes for the following high-impact sectors:
Pathway diagram - questions
This diagram shows the general questions contained in module C1. To access question-level guidance, use the menu on the left to navigate to the question.
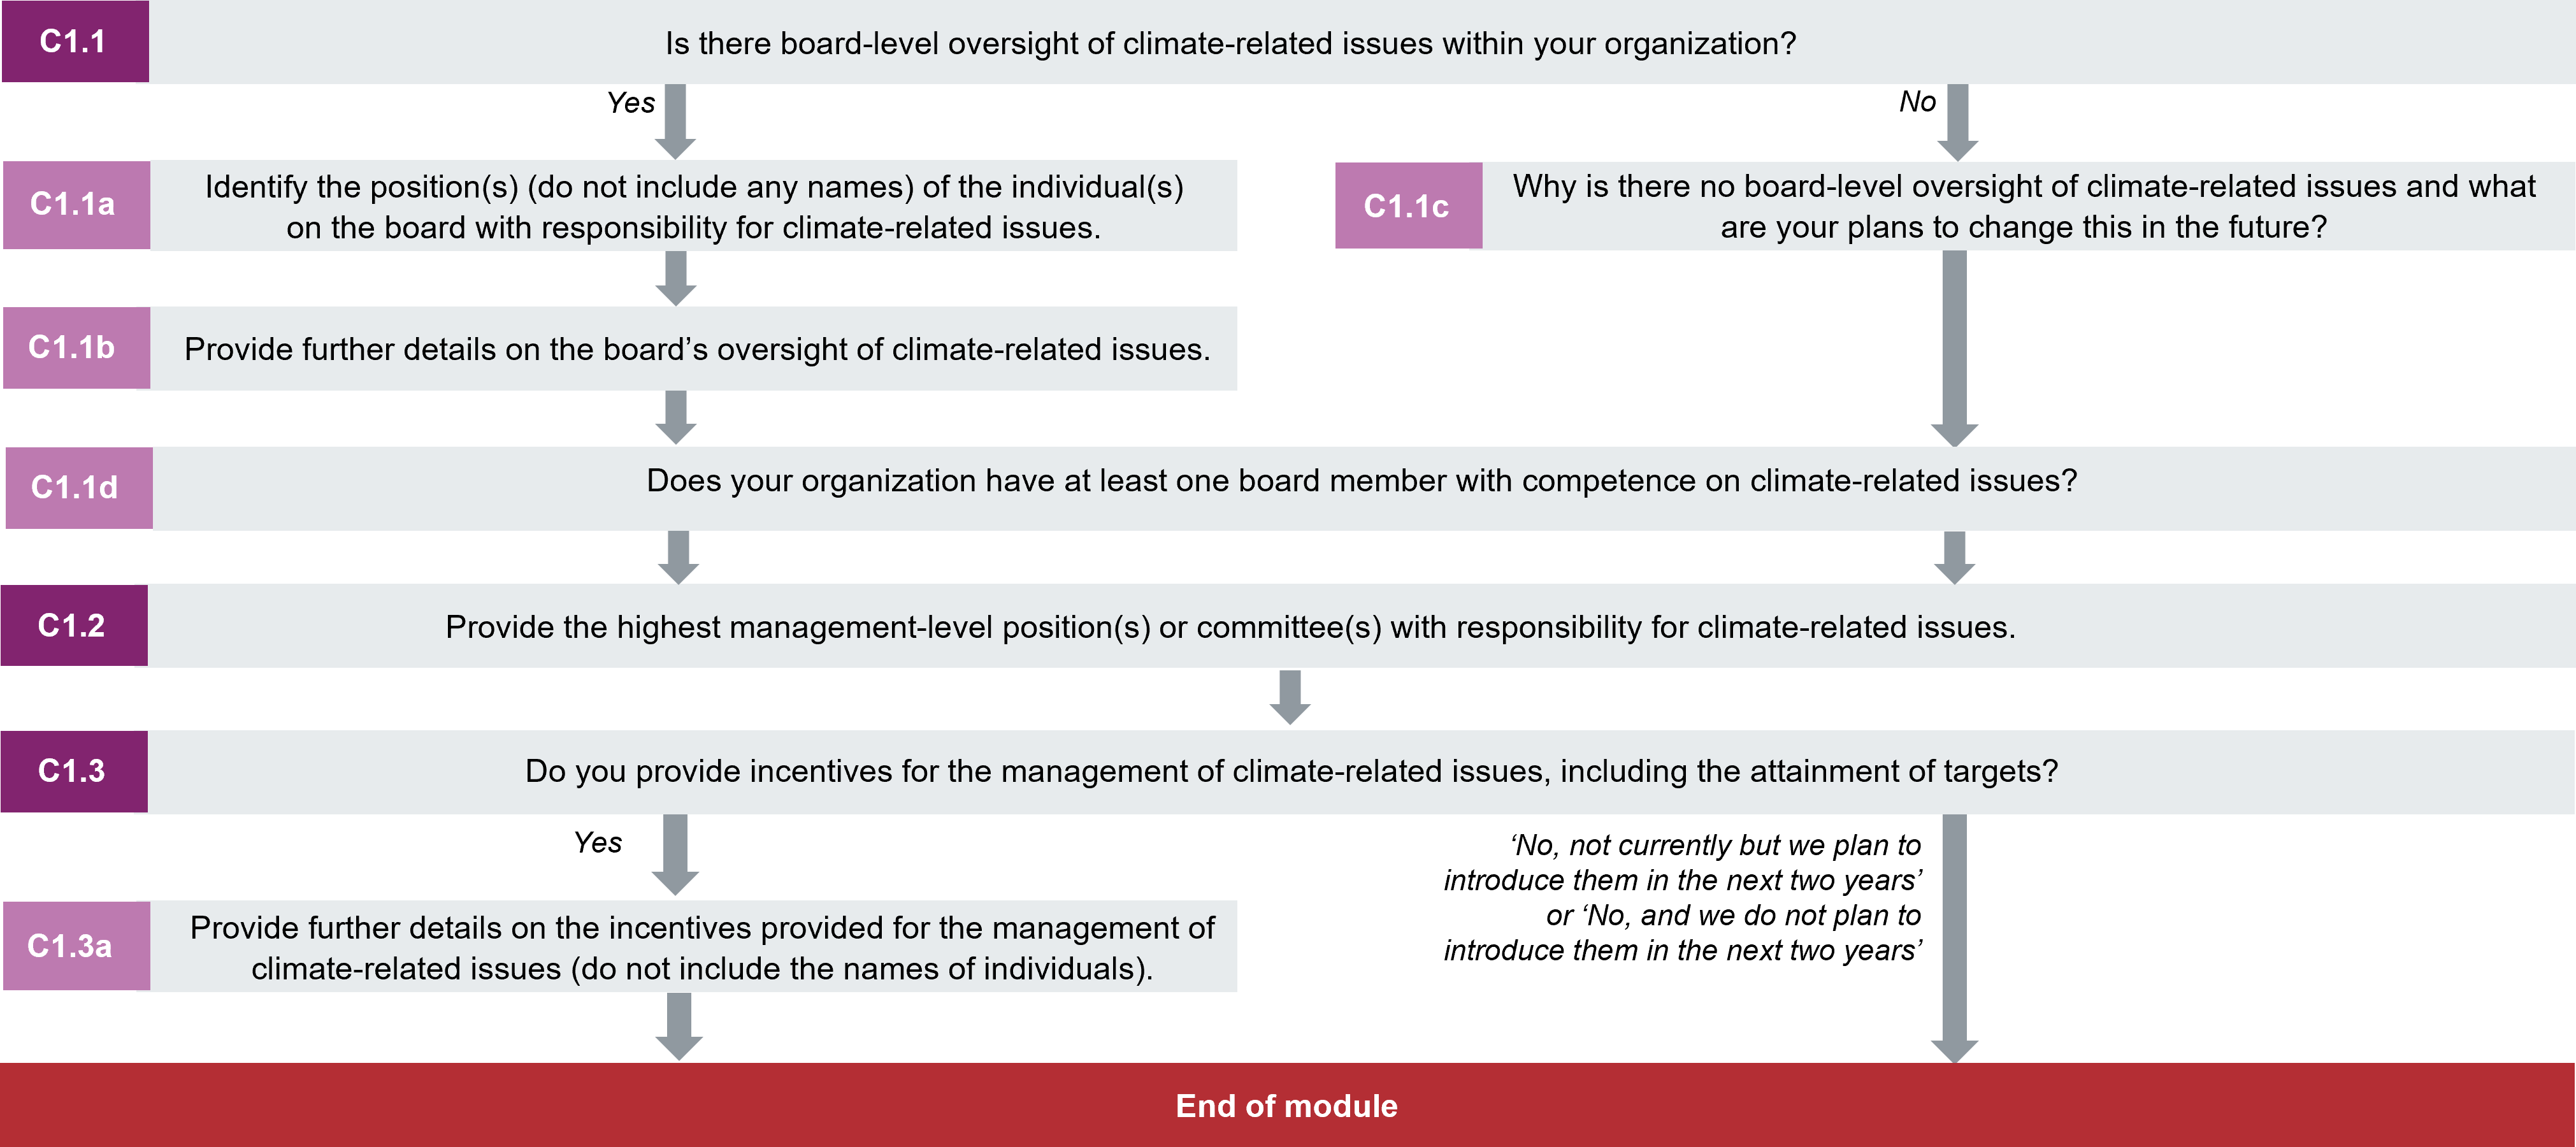
Board oversight
(C1.1) Is there board-level oversight of climate-related issues within your organization?
Change from last year
No change
Rationale
This question provides an indication of the importance of climate-related issues to your business. Investors and other data users are interested in an organization's understanding and approach to climate-related risks at the board level; how aligned this is with business strategy, policies, and performance objectives; and how the board monitors progress against targets and goals.
Connection to other frameworks
SDG
Goal 12: Responsible consumption and production
S&P Global Corporate Sustainability Assessment
TCFD Disclosure
Response options
Select one of the following options:
Requested content
General
- Select “Yes” if the board and/or board committees take account of climate-related issues when, for example:
- reviewing and guiding business strategy, the risk management approach and annual budgets;
- overseeing the organization's employee incentives, major capital expenditures, acquisitions, and divestitures;
- monitoring progress towards targets;
- creating and reviewing environmental policies, strategy or information.
Note for financial services sector companies:
- Consider whether the board and/or board committees have oversight of climate-related issues in relation to the financial activities undertaken by your organization such as lending, financial intermediary, investment and/or insurance underwriting activities, in addition to operational activities.
- Further details can be provided in subsequent questions C1.1a and C1.1b
Explanation of terms
- Board: Or “Board of Directors” refers to a body of elected or appointed members who jointly oversee the activities of a company or organization. Some countries/areas use a two-tiered system where “board” refers to the “supervisory board” while “key executives” refers to the “management board".
Additional information
For further information on board-level oversight in governance, see TCFD’s recommendations, CDP’s technical note on the TCFD’s recommendations and “How to Set Up Effective Climate Governance on Corporate Boards - Guiding principles and questions” (World Economic Forum, 2019).
(C1.1a) Identify the position(s) (do not include any names) of the individual(s) on the board with responsibility for climate-related issues.
Question dependencies
This question only appears if you select “Yes” in response to C1.1.
Change from last year
Modified question
Rationale
This question provides an indication of the importance of climate-related issues to your business and aims to identify the highest-level individual(s) on the board with direct responsibility for climate-related issues.
Ambition: Companies allocate responsibility for climate-related issues to specific board -level positions/committees.
Connection to other frameworks
SDG
Goal 12: Responsible consumption and production
S&P Global Corporate Sustainability Assessment
TCFD Disclosure
Response options
Please complete the following table. You are able to add rows by using the “Add Row” button at the bottom of the table.
| Position of individual or committee
|
Responsibilities for climate-related issues
|
|
Select from:
- Board Chair
- Director on board
- Chief Executive Officer (CEO)
- Chief Financial Officer (CFO)
- Chief Operating Officer (COO)
- Chief Procurement Officer (CPO)
- Chief Risk Officer (CRO)
- Chief Sustainability Officer (CSO)
- Chief Investment Officer (CIO) [Financial services only]
- Chief Credit Officer (CCO) [Financial services only]
- Chief Underwriting Officer (CUO) [ Financial services only]
- Chief Government Relations Officer (CGRO)
- Chief Technology Officer (CTO)
- Other C-Suite Officer
- President
- Board-level committee
- General Counsel
- Other, please specify
|
Text field [maximum 2,500 characters]
|
[Add Row]
Requested content
General
- Report where in the board the responsibility for oversight of climate-related issues lies. This may be with an individual member of the board or a board-level committee, e.g. sustainability committee, risk committee, etc.
- Note that this question is asking about direct responsibility for oversight. In practical terms, this is the person or committee at the top of the chain of command specifically managing information on climate-related issues, making decisions about what the company will do and adapting those decisions based on climate-related information.
- The CEO is ultimately responsible for everything in the company; however this question is looking to identify board-level responsibility specifically on climate-related issues. While this may be the CEO, it is not necessarily always the case.
- Note that this question asks about the position and not about the names of the staff holding these positions. Do not include the name of any individual or any other personal data in your response.
Position of individual or committee (column 1)
- Select the position of the individual on the board responsible for climate-related issues. If the position is not listed here please select the closest match for your organization and provide the position title in column 2 (“Responsibilities for climate-related issues”).
- If oversight falls jointly to the members of a committee, rather than an individual position, you should select “Board-level committee” and provide the name of the committee in column 2 (“Responsibilities for climate-related issues”).
- If there is more than one position, please add a row.
Responsibilities for climate-related issues (column 2)
- State what responsibilities this position/committee has related to climate issues.
- You can use this text field to provide any other relevant information, such as:
- Examples of climate-related decisions that the position/committee made or contributed to.
Explanation of terms
- C-suite: A term used to collectively refer to the most senior executive team.
(C1.1b) Provide further details on the board’s oversight of climate-related issues.
Question dependencies
This question only appears if you select “Yes” in response to C1.1.
Change from last year
Modified question
Rationale
Investors and other data users are interested in organizations’ understanding and approach to climate-related risks at the board level; how aligned this is with organizational strategy, financial planning, and external engagement; and the monitoring of progress against corporate targets.
Ambition: Climate-related issues are integrated into the mechanisms used by the board to oversee the company.
Connection to other frameworks
SDG
Goal 12: Responsible consumption and production
TCFD
Governance recommended disclosure a) Describe the board’s oversight of climate related risks and opportunities.
S&P Global Corporate Sustainability Assessment
TCFD Disclosure
Response options
Please complete the following table. You are able to add rows by using the “Add Row” button at the bottom of the table.
| Frequency with which climate-related issues are a scheduled agenda item
|
Governance mechanisms into which climate-related issues are integrated
|
[FINANCIAL SERVICES ONLY] Scope of board-level oversight
|
Please explain
|
|
Select from:
- Scheduled - all meetings
- Scheduled - some meetings
- Sporadic - as important matters arise
- Other, please specify
|
Select all that apply from drop down options below:
|
Select all that apply:
- Climate-related risks and opportunities to our own operations
- Climate-related risks and opportunities to our banking activities
- Climate-related risks and opportunities to our investment activities
- Climate-related risks and opportunities to our insurance underwriting activities
- The impact of our own operations on the climate
- The impact of our banking activities on the climate
- The impact of our investing activities on the climate
- The impact of our insurance underwriting activities on the climate
|
Text field [maximum 3,000 characters]
|
[Add Row]
Governance mechanisms into which climate-related issues are integrated (column 2)
- Reviewing and guiding annual budgets
- Overseeing major capital expenditures
- Overseeing acquisitions, mergers, and divestitures
- Reviewing innovation/R&D priorities
- Overseeing and guiding employee incentives
- Reviewing and guiding strategy
- Overseeing and guiding the development of a transition plan
- Monitoring the implementation of a transition plan
- Overseeing and guiding scenario analysis
|
- Overseeing the setting of corporate targets
- Monitoring progress towards corporate targets
- Overseeing and guiding public policy engagement
- Overseeing value chain engagement
- Reviewing and guiding the risk management process
- Other, please specify
|
Requested content
General
- You should consider the frequency that climate-related issues are a scheduled agenda item for the principal board-level committee having oversight for climate-related issues. This may be a subcommittee of the board, or the full board itself.
- If you select “Other, please specify” provide a label for the Frequency with which climate-related issues are a scheduled agenda item.
- Note that your response to this question may refer to the position of employees relevant to board oversight mechanisms. In this case, do not include the name of any individual or any other personal data in your response.
Governance mechanisms into which climate-related issues are integrated (column 2)
- Select all of the governance mechanisms in which climate-related issues are included.
Scope of board-level oversight [FINANCIAL SERVICES ONLY]
- Activities of a business may be both affected by climate change or contribute to climate change. For financial institutions these impacts may materialize via the organization’s own operations, the financial products and services offered to its clients, and/or its investments. This column seeks insight on whether an organization’s board considers both:
- How the risks posed or opportunities presented by climate change impact its business; and conversely
- How its business activities contribute either positively or negatively to climate change.
Please explain (column 3)
- Describe the governance mechanisms selected in column 2 and explain how these mechanisms contribute to the board's overall oversight of climate-related issues.
- Include such details as what climate issues are scheduled agenda items, who briefs the board and on which matters (e.g. "a report from each Business Head regarding progress towards climate-related targets is reviewed quarterly by the board").
- As much as possible, give examples from the reporting year.
(C1.1c) Why is there no board-level oversight of climate-related issues and what are your plans to change this in the future?
Question dependencies
This question only appears if you select “No” in response to C1.1.
Change from last year
No change
Rationale
As board-level oversight of climate-related issues is considered best practice, this question allows organizations to explain why there is no board-level oversight.
Response options
Please complete the following table:
| Primary reason
|
Board-level oversight of climate-related issues will be introduced within the next two years.
|
Please explain
|
|
Text field [maximum 1,000 characters]
|
Select from:
- Yes, we plan to do so within the next two years
- No, we do not currently plan to do so
|
Text field [maximum 2,400 characters]
|
Requested content
Primary reason (column 1)
- Provide your organization's main rationale for not currently having board-level oversight of climate-related issues.
Please explain (column 3)
- Explain what you plan to implement in the next two years, or why you do not currently plan to do so.
(C1.1d) Does your organization have at least one board member with competence on climate-related issues?
Change from last year
No change
Rationale
Transitioning a business for success in a sustainable future requires related expertise within its decision-making bodies. This capability at board level signals a company’s commitment to understanding and responding to risks, opportunities, and impacts.
Connection to other frameworks
SDG
Goal 12: Responsible consumption and production
Response options
Please complete the following table:
(*column/row appearance is dependent on selections in this or other questions)
| Board member(s) have competence on climate-related issues
|
Criteria used to assess competence of board member(s) on climate-related issues*
|
Primary reason for no board-level competence on climate-related issues*
|
Explain why your organization does not have at least one board member with competence on climate-related issues and any plans to address board-level competence in the future*
|
Select from: - Yes
- No, but we plan to address this within the next two years
- No, and we do not plan to address this within the next two years
- Not assessed
|
Text field [maximum 2,500 characters]
|
Select from:- Important but not an immediate priority
- Judged to be unimportant, explanation provided
- Other, please specify
|
Text field [maximum 2,500 characters]
|
Requested content
General
- Consider whether any kind of skills, experience or expertise assessment of your board is conducted for environmental issues.
- Note that your response to this question may refer to the position of employees relevant to board-level competence. In this case, do not include the name of any individual or any other personal data in your response.
Criteria used to assess competence on climate-related issues (column 2)
- This column is only presented if “Yes” is selected in column 1.
- Detail the specific criteria used to assess the board’s climate-related competence.
Primary reason for no board-level competence on climate-related issues (column 3)
- This column is only presented if one of the “No” options is selected in column 1.
- Select the primary reason as to why there is no board-level competence on climate-related issues in your organization.
- If none of the reasons are applicable to your organization, select “Other, please specify” to provide the primary reason.
Explain why your organization does not have at least one board member with competence on climate-related issues and any plans to address board-level competence in the future (column 4)
- This column is only presented if one of the “No” options is selected in column 1.
- If you selected “Judged to be unimportant, explanation provided” in column 3, explain the criteria used to decide that board-level competence on climate-related issues is not important for your organization.
- Describe any plans to address board-level competence on climate-related issues, such as any measures you have implemented to enhance the climate-related competence of the board.
Management responsibility
(C1.2) Provide the highest management-level position(s) or committee(s) with responsibility for climate-related issues.
Change from last year
Modified question
Rationale
While it is most important for a member of the board to have responsibility for climate-related issues, assigning management-level responsibility indicates to CDP data users that the organization is committed to implementing its climate-related strategy.
Ambition: Companies allocate management responsibility for climate-related issues to senior roles.
Connections to other frameworks
SDG
Goal 12: Responsible consumption and production
TCFD
Governance recommended disclosure b) Describe management’s role in assessing and managing climate related risks and opportunities.
S&P Global Corporate Sustainability Assessment
TCFD Disclosure
Response options
Please complete the following table. You are able to add rows by using the “Add Row” button at the bottom of the table.
| Position or committee
|
Climate-related responsibilities of this position
|
[FINANCIAL SERVICES ONLY] Coverage of responsibilities
|
Reporting line
|
Frequency of reporting to the board on climate-related issues via this reporting line
|
Please explain
|
|
Select from:
- Chief Executive Officer (CEO)
- Chief Financial Officer (CFO)
- Chief Operating Officer (COO)
- Chief Procurement Officer (CPO)
- Chief Risks Officer (CRO)
- Chief Sustainability Officer (CSO)
- Chief Government Relations Officer (CGRO)
- Chief Technology Officer (CTO)
- Chief Investment Officer (CIO) [Financial services only]
- Chief Credit Officer (CCO) [Financial services only]
- Chief Underwriting Officer (CUO) [Financial services only]
- Other C-Suite Officer, please specify
- President
- General Counsel
- Risk committee
- Sustainability committee
- Safety, Health, Environment and Quality committee
- Corporate responsibility committee
- Credit committee [Financial services only]
- Investment committee [Financial services only]
- Responsible Investment committee [Financial services only]
- Audit committee [Financial services only]
- Other committee, please specify
- Business unit manager
- Energy manager
- Environmental, Health, and Safety manager
- Environment/Sustainability manager
- Facility manager
- Process operation manager
- Procurement manager
- Public affairs manager
- Risk manager
- Portfolio/Fund manager [Financial services only]
- ESG Portfolio/Fund manager [Financial services only]
- Investment/credit/insurance analyst [Financial services only]
- Dedicated responsible investment analyst [Financial services only]
- Investor relations manager [Financial services only]
- Risk analyst [Financial services only]
- There is no management level responsibility for climate-related issues
- Other, please specify
|
Select all that apply from drop-down options below
|
Select all that apply:
- Risks and opportunities related to our banking
- Risks and opportunities related to our investing activities
- Risks and opportunities related to our insurance underwriting activities
- Risks and opportunities related to our own operations
|
Select from:
- Reports to the board directly
- CEO reporting line
- Risk - CRO reporting line
- Finance – CFO reporting line
- Investment – CIO reporting line [Financial services only]
- Operations – COO reporting line
- Corporate Sustainability/CSR – CSO reporting line
- Other, please specify
|
Select from:
- More frequently than quarterly
- Quarterly
- Half-yearly
- Annually
- Less frequently than annually
- As important matters arise
- Not reported to the board
|
Text field [maximum 3,000 characters]
|
[Add Row]
Climate-related responsibilities of this position (column 2)
- Managing annual budgets for climate mitigation activities
- Managing major capital and/or operational expenditures related to low-carbon products or services (including R&D)
- Managing climate-related acquisitions, mergers, and divestitures
- Providing climate-related employee incentives
- Developing a climate transition plan
- Implementing a climate transition plan
- Integrating climate-related issues into the strategy
- Conducting climate-related scenario analysis
|
- Setting climate-related corporate targets
- Monitoring progress against climate-related corporate targets
- Managing public policy engagement that may impact the climate
- Managing value chain engagement on climate-related issues
- Assessing climate-related risks and opportunities
- Managing climate-related risks and opportunities
- Other, please specify
|
Requested content
General
- Provide details of the highest management-level position or committee with responsibility for climate-related issues.
- Note that this question asks about the position and not about the names of the staff holding these positions. Do not include the name of any individual or any other personal data in your response.
Position or committee (column 1)
- Select the best match for the position/committee in your organization, or select "Other, please specify".
- The list includes senior positions that may sometimes but not always be at board level, and therefore positions listed in C1.1a are also listed here. Select one of those positions only if the individual has management responsibility for climate-related issues.
- If there is more than one senior position/committee with management-level responsibility for climate-related issues and you would like to describe this, you may use the "Add Row button". This is optional. In this case, ensure that the position/committee with the highest level of responsibility is in the top row of the table.
- If you select “There is no management level responsibility for climate-related issues", provide your organization’s rationale for that in column 6 “Please explain”.
Climate-related responsibilities of this position (column 2)
- This column does not appear if “There is no management level responsibility for climate-related issues” is selected in column 1 “Position or committee”.
Coverage of responsibility [FINANCIAL SERVICES ONLY] (column 3)
- This column only appears if “Assessing climate-related risks and opportunities” or “Managing climate-related risks and opportunities” is selected in column 2 “Climate-related responsibilities of this position”.
- This column seeks to understand whether the highest management-level position or committee with responsibility for climate-related issues considers both climate-related risks and opportunities related to both your own operations and core financing activities.
Reporting line (column 4)
- This column does not appear if “There is no management level responsibility for climate-related issues” is selected in column 1 “Position or committee”.
- Select the best match for the reporting line that oversees the position/committee with responsibility for climate-related issues.
Frequency of reporting to the board on climate-related issues via this reporting line (column 5)
- This column does not appear if “There is no management level responsibility for climate-related issues” is selected in column 1 “Position or committee”.
Please explain (column 6)
- Provide a rationale as to why the climate-related responsibilities selected in column 2 have been assigned to this position/committee.
- State the processes by which the position/committee is informed of and monitors climate-related issues.
Explanation of terms
- Highest management-level position(s) or committee(s): The most senior individual or committee with operational responsibility for the implementation of decisions taken at the board level and day-to-day management.
Employee incentives
(C1.3) Do you provide incentives for the management of climate-related issues, including the attainment of targets?
Change from last year
No change
Rationale
CDP data users aim to understand the degree to which companies encourage their employees to address climate-related issues and impacts of the business, as well as the mechanisms by which companies are incentivizing certain behaviors and performances.
Connection to other frameworks
SDG
Goal 12: Responsible consumption and production
S&P Global Corporate Sustainability Assessment
Climate-Related Management Incentives
Response options
Please complete the following table:
| Provide incentives for the management of climate-related issues
|
Comment
|
Select from:
- Yes
- No, not currently but we plan to introduce them in the next two years
- No, and we do not plan to introduce them in the next two years
|
Text field (maximum 1,000 characters)
|
Requested content
General
- Note that incentives can be positive (i.e. give people something) or negative (prevent access to something).
(C1.3a) Provide further details on the incentives provided for the management of climate-related issues (do not include the names of individuals).
Question dependencies
This question only appears if you select “Yes” in response to C1.3.
Change from last year
Modified question
Rationale
CDP data users aim to understand the degree to which companies encourage their employees to address climate-related issues and impacts of the business, as well as the mechanisms by which companies are incentivizing certain behaviors and performances.
Ambition: Executive-level employees are incentivized to achieve measurable climate-related outcomes linked to the organization’s climate commitments and/or transition plan.
Connection to other frameworks
SDG
Goal 12: Responsible consumption and production
S&P Global Corporate Sustainability Assessment
CEO Compensation - Long-Term Performance Alignment
CEO Compensation - Success Metrics
Climate-Related Management Incentives
Response options
Please complete the following table. You are able to add rows by using the “Add Row” button at the bottom of the table.
| Entitled to incentive
|
Type of incentive
|
Incentive(s)
|
Performance indicator(s)
|
Incentive plan(s) this incentive is linked to
|
Further details of incentive(s)
|
Explain how this incentive contributes to the implementation of your organization’s climate commitments and/or climate transition plan
|
|
Select from:
- Board Chair
- Board/Executive board
- Director on board
- Corporate executive team
- Chief Executive Officer (CEO)
- Chief Financial Officer (CFO)
- Chief Operating Officer (COO)
- Chief Procurement Officer (CPO)
- Chief Risk Officer (CRO)
- Chief Sustainability Officer (CSO)
- Chief Government Relations Officer (CGRO)
- Chief Technology Officer (CTO)
- Chief Investment Officer (CIO) [Financial services only]
- Chief Underwriting Officer (CUO) [Financial services only]
- Chief Credit Officer (CCO) [Financial services only]
- Other C-Suite Officer
- President
- General Counsel
- Executive officer
- Management group
- Business unit manager
- Energy manager
- Environmental, health, and safety manager
- Environment/Sustainability manager
- Facilities manager
- Process operation manager
- Procurement manager
- Public affairs manager
- Risk manager
- Portfolio/Fund manager [Financial services only]
- ESG Portfolio/Fund manager [Financial services only]
- Investment analyst [Financial services only]
- Dedicated Responsible Investment staff [Financial services only]
- Investor Relations staff [Financial services only]
- Risk management staff [Financial services only]
- Buyers/purchasers
- All employees
- Other, please specify
|
Select from:
- Monetary reward
- Non-monetary reward
|
Select all that apply:
Monetary reward
- Bonus - % of salary
- Bonus – set figure
- Promotion
- Salary increase
- Shares
- Profit share
- Retirement plan
- Other, please specify
Non-monetary reward
- Internal company award
- Internal team/employee of the month/quarter/year recognition
- Public recognition
- Other, please specify
|
Select all that apply from drop-down options below:
|
Select from:
- Short-Term Incentive Plan
- Long-Term Incentive Plan
- Both Short-Term and Long-Term Incentive Plan
- Not part of an existing incentive plan
- This position does not have an incentive plan
|
Text field [maximum 2,500 characters]
|
Text field [maximum 2,500 characters]
|
[Add Row]
Performance indicator(s) (column 4)
- Board approval of climate transition plan
- Shareholder approval of climate transition plan
- Achievement of climate transition plan KPI
- Progress towards a climate-related target
- Achievement of a climate-related target
- Implementation of an emissions reduction initiative
- Reduction in absolute emissions
- Reduction in emissions intensity
- Energy efficiency improvement
- Increased share of low-carbon energy in total energy consumption
- Increased share of renewable energy in total energy consumption
- Reduction in total energy consumption
- Increased investment in low-carbon R&D
- Increased share of revenue from low-carbon products or services in product or service portfolio
|
- Increased engagement with suppliers on climate-related issues
- Increased engagement with customers on climate-related issues
- Increased engagement with clients on climate-related issues [Financial Services only]
- Increased engagement with investee companies on climate-related issues [Financial Services only]
- Increased supplier compliance with a climate-related requirement
- Increased value chain visibility (traceability, mapping, transparency)
- Company performance against a climate-related sustainability index (e.g., DJSI, CDP Climate Change score etc.)
- Implementation of employee awareness campaign or training program on climate-related issues
- Increased alignment of portfolio/fund to climate-related objectives [Financial Services only]
- Other, please specify
|
Requested content
General
- Note that this question asks about the position of employees entitled to incentives. Do not include the name of any individual or any other personal data in your response.
- Add a row to report incentives that your most senior employees are entitled to before reporting those for other employees.
Entitled to incentives (column 1)
- Select the best match for the position entitled to the incentive(s), or select “Other, please specify”.
Types of incentive (column 2)
- Monetary - a bonus or some form of financial remuneration;
- Non-monetary - employee rewards not resulting directly in any form of financial remuneration.
- If the position is entitled to both monetary and non-monetary incentives, enter details of each type of incentive in separate rows.
Incentive(s) (column 3)
- The options presented in this column depend on your selection in column 2 “Type of incentive”.
Performance indicator(s) (column 4)
- Select the climate-related performance indicator(s) relevant to the incentive(s) for the position selected in column 1. You will have the opportunity to provide further details in column 6 “Further details of incentive”.
Incentive plan(s) this incentive is linked to (column 5)
- Indicate whether the climate-related incentive(s) for this position is part of an incentives plan:
- Short-Term Incentive Plans (STIPs) aim to reward employees for their individual contribution to achieving short-term business objectives and maximizing organizational performance over the course of a year.
- Long-Term Incentive Plans (LTIPs) aim to reward and retain employees key to achieving the organization’s long-term strategic goals. Incentives that are part of an employee’s LTIP are usually rewarded over the course of/after a number of years
- If the position has an incentive plan but the performance indicator(s) disclosed in column 4 is not part of the plan, select “Not part of an existing incentive plan”.
- If the position does not have an incentive plan, or your organization does not implement employee incentive plans, select “This position does not have an incentive plan”.
Further details of incentive(s) (column 6)
- Use this field to provide further details of the climate-related incentive(s) the position is entitled to, including:
- The timeframe of the performance indicator(s)
- Quantitative details of the incentive(s) and the performance indicator(s)
- Regional, sectoral, and/or operational context
- Provide further details of how the incentive(s) ties in with the position’s employee incentive plan (if relevant).
Explain how this incentive contributes to the implementation of your organization’s climate commitments and/or climate transition plan (column 7)
- For example, explain how the performance indicator(s) reported in column 4 is linked to key performance indicators (KPIs) within your climate transition plan, or how it will progress your commitment to reach net-zero emissions by 2050.
Example response
| Entitled to incentive
|
Type of incentive
|
Incentive(s)
|
Performance indicator(s)
|
Incentive plan(s) this incentive is linked to
|
Further details of incentive(s)
|
Explain how this incentive contributes to the implementation of your organization’s climate commitments and/or climate transition plan
|
| Chief Executive Officer (CEO)
|
Monetary reward
|
Bonus - % of salary
|
Reduction in absolute emissions
|
Long- term Incentive Plan
|
Our CEO is entitled to a bonus of 100% of their salary after 5 years if the organization has achieved a 25% reduction in absolute emissions within those 5 years.
|
The performance indicator is in line with our near-term science-based target, which forms part of our climate transition plan.
|
| Chief Procurement Officer (CPO)
|
Monetary reward
|
Shares
|
Increased supplier compliance with a climate-related requirement
|
Short-Term Incentive Plan
|
If supplier compliance with our requirement of setting a science-based target increases by 10% by the end of the reporting year, our CPO is entitled to an extra 1% of company shares.
|
This incentive is linked to our commitment to net-zero emissions throughout our supply chain by 2050.
|
C2 Risks and opportunities
Module Overview
Evaluating exposure to climate-related risks and opportunities over a range of time horizons allows for a strategy for the transition to a net-zero carbon economy recognized in the Paris Agreement and UN SDGs. This module focuses on processes for identifying, assessing, and responding to climate-related issues as well as on the climate-related risks and opportunities identified by your organization. This information helps investors to assess the potential impacts to valuations and the adequacy of the company’s risk response.
Many of the challenges you face when reporting on climate-related issues are common to other aspects of corporate reporting, requiring you to provide statements about your prospective condition. Some organizations, particularly accounting firms and their governing bodies, have published guidance about how to prepare statements that contain forward-looking information.
You may wish to consult with your financial, legal, and/or compliance departments for advice on your company’s general approach to the provision of forward-looking statements and information concerning risks.
Note that the questions relate to “inherent” risk and not the “residual” risk that remains after management measures have been taken into account.
Note for financial services sector companies:
The TCFD recommendations highlight the importance of the financial sector considering the impacts of climate-related issues in the context of their financing activities. When evaluating exposure to climate-related risks and opportunities, financial services sector companies should primarily consider the impact on their lending, financial intermediary, investing and/or insurance underwriting activities, in addition to operational activities.
Key changes
- Modified guidance:
- C2.2 – guidance updated to request that companies include an explanation of the frequency of assessment and time horizons reported when describing their process for identifying, assessing and responding to climate-related risks and opportunities.
- C2.3a – clarification on how companies who cannot provide an absolute figure may report the cost of response to a risk.
- C2.4a – clarification on how companies who cannot provide an absolute figure may report the cost to realize an opportunity.
Click here for a list of all changes made this year.
Sector specific content
Additional questions for financial services sector companies.
Pathway diagram - questions
This diagram shows the general questions contained in module C2. To access question-level guidance, use the menu on the left to navigate to the question.
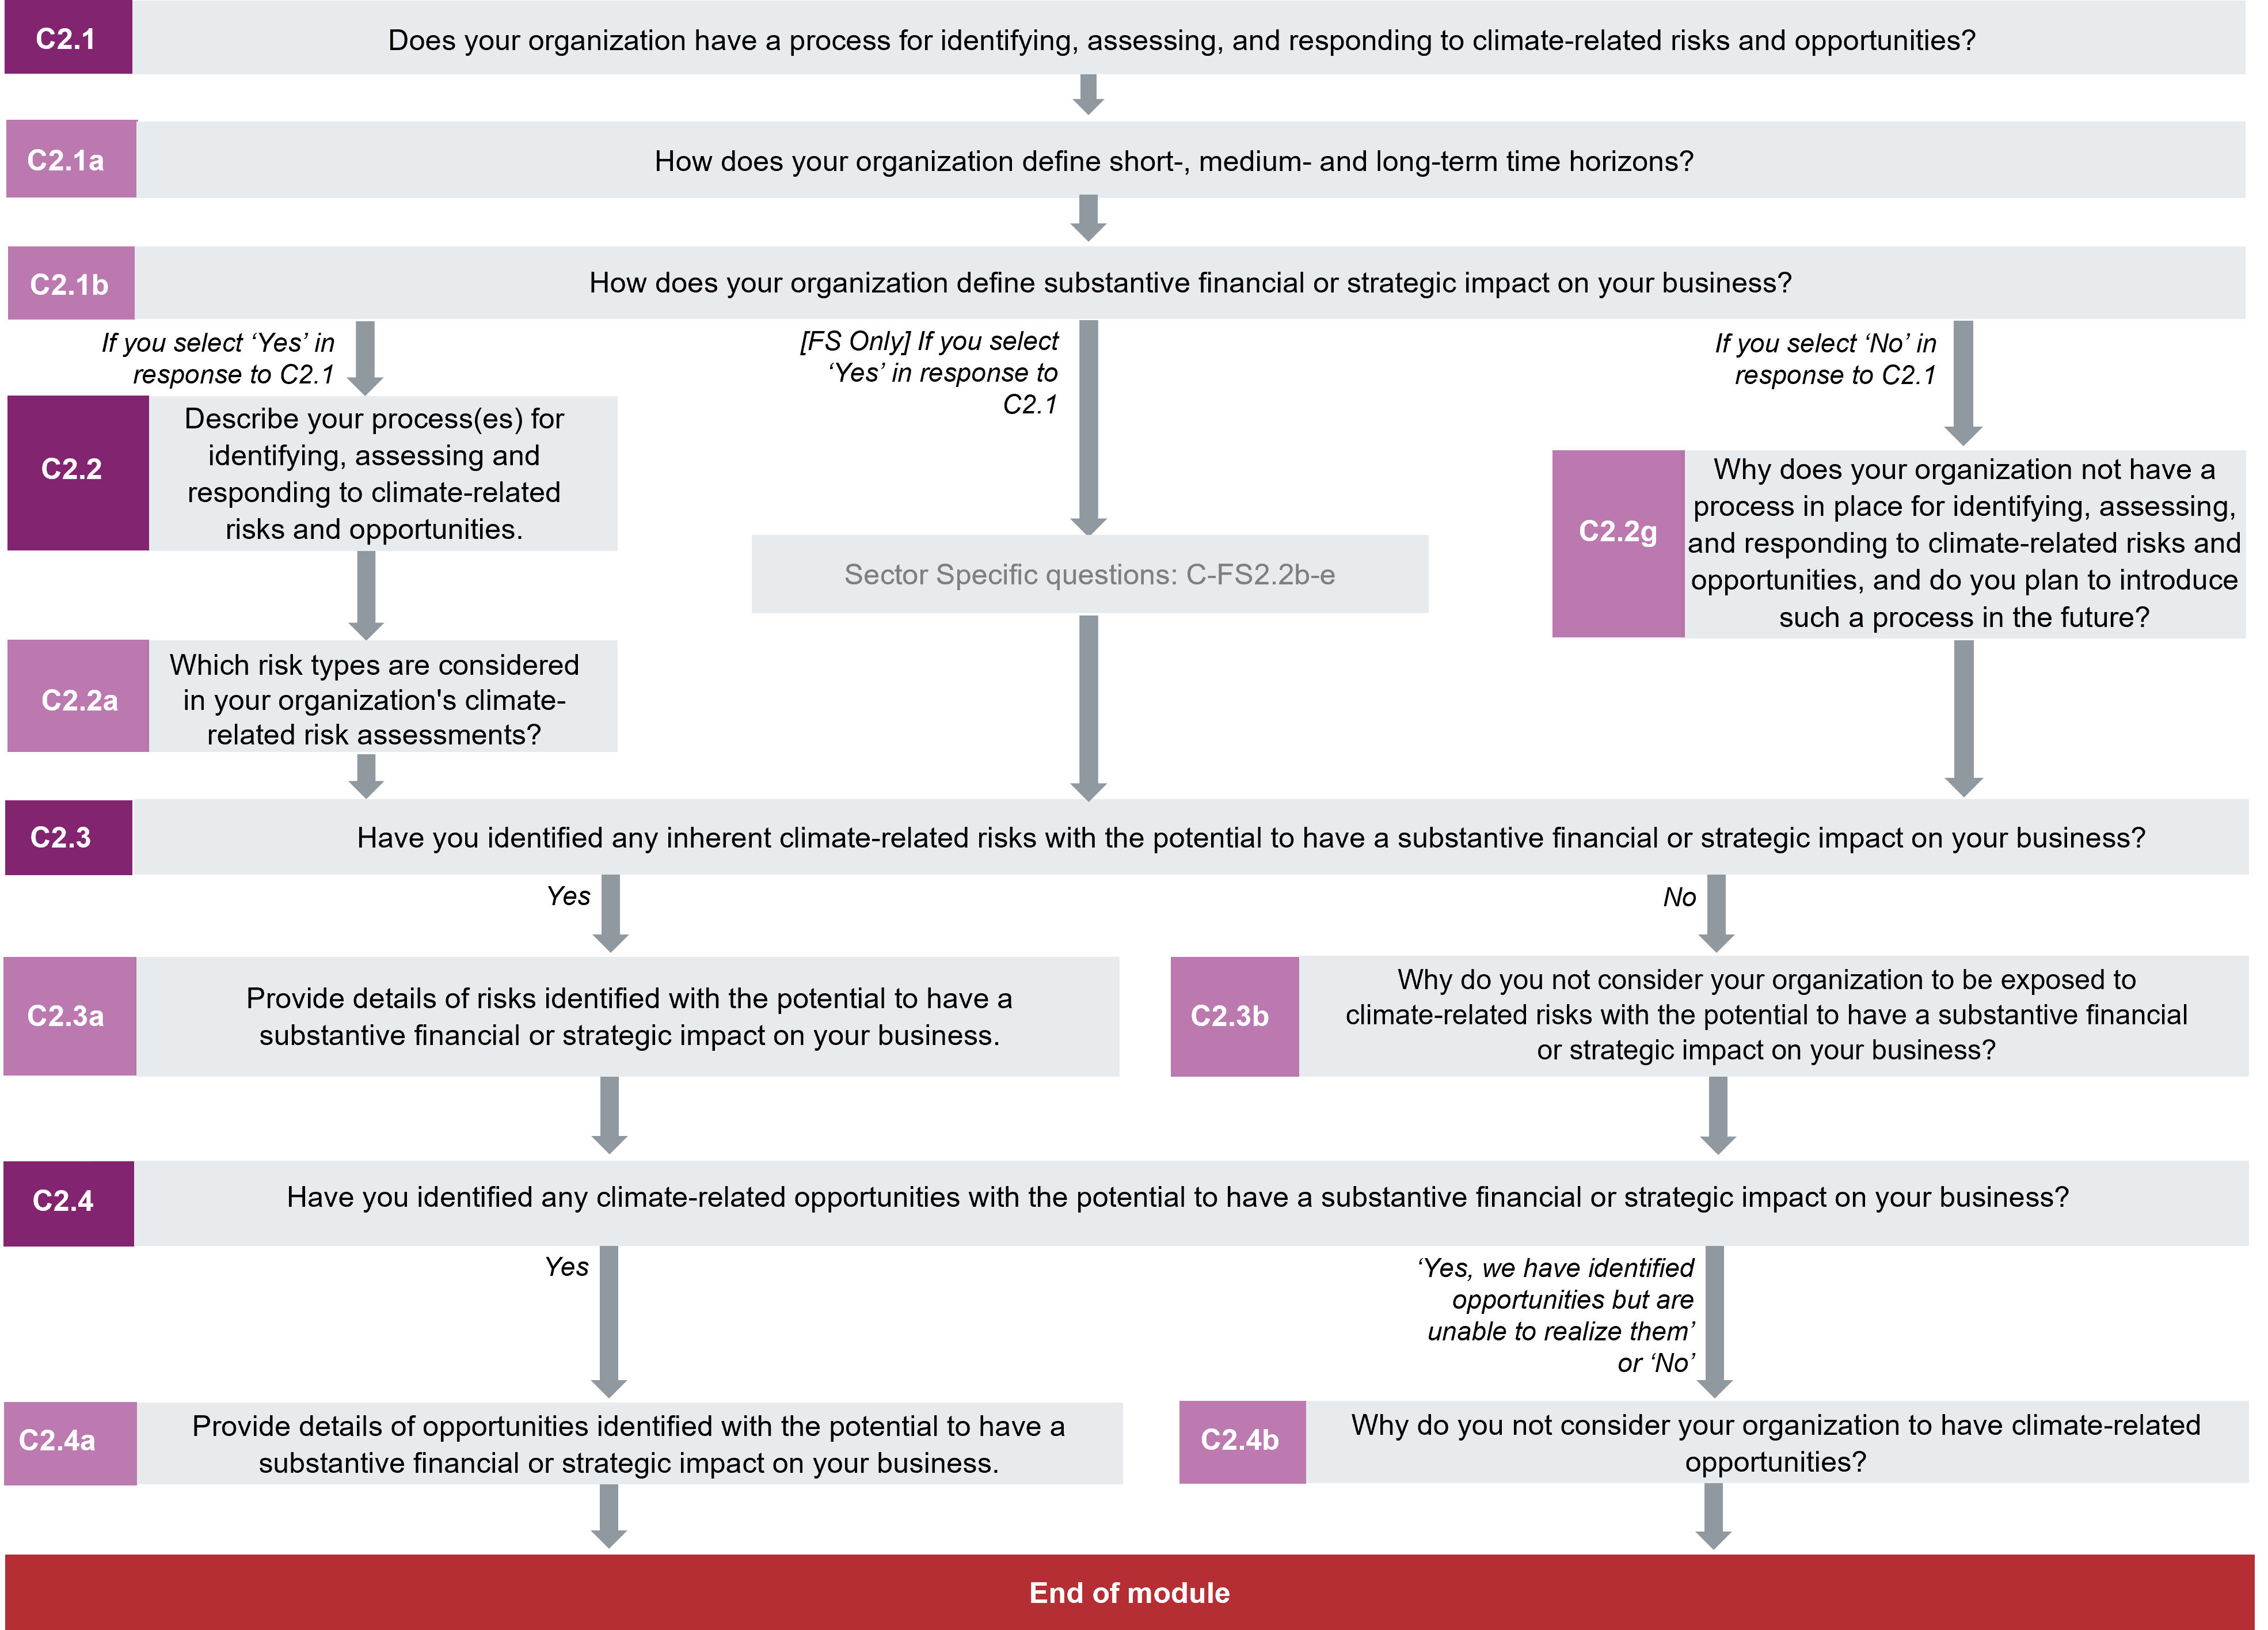
Management processes
(C2.1) Does your organization have a process for identifying, assessing, and responding to climate-related risks and opportunities?
Change from last year
No change
Rationale
For many companies, climate change poses significant financial challenges and opportunities, now and in the future. CDP asks about a process for identifying, assessing, and responding to climate-related risks and opportunities so that data users may gauge the thoroughness of your company's understanding of its exposure to climate-related issues.
Connection to other frameworks
TCFD
Risk Management recommended disclosure a) Describe the organization’s processes for identifying and assessing climate-related risks.
Risk Management recommended disclosure b) Describe the organization’s processes for managing climate-related risks
Risk Management recommended disclosure c) Describe how processes for identifying, assessing, and managing climate-related risks are integrated into the organization’s overall risk management.
Response options
Select one of the following options:
Requested content
General
- Select "Yes" if you have any process in place for identifying, assessing, and responding to climate-related risks and opportunities, regardless of how thorough it is. You will be able to provide further details in the subsequent questions.
- Only select "No" if you do not have any form of process for identifying, assessing, and responding to climate-related issues.
Explanation of terms
- Climate-related risk, in line with the TCFD, refers to the potential negative impacts of climate change on an organization. Physical risks emanating from climate change can be event-driven (acute) such as increased severity of extreme weather events (e.g., cyclones, droughts, floods, and fires). They can also relate to longer-term shifts (chronic) in precipitation, temperature and increased variability in weather patterns (e.g., sea level rise). Climate-related risks can also be associated with the transition to a lower-carbon global economy, the most common of which relate to policy and legal actions, technology changes, market responses, and reputational considerations.
- Climate-related opportunity, in line with the TCFD, refers to the potential positive impacts on an organization resulting from efforts to mitigate and adapt to climate change, such as through resource efficiency and cost savings, the adoption and utilization of low-emission energy sources, the development of new products and services, and building resilience along the supply chain. Climate-related opportunities will vary depending on the region, market, and industry in which an organization operates.
- Risk management: Risk management involves identifying, assessing and responding to risk to make sure organizations achieve their objectives. It must be proportionate to the complexity and type of organization involved (based on Institute of Risk Management, 2016).
(C2.1a) How does your organization define short-, medium- and long-term time horizons?
Change from last year
No change
Rationale
CDP has added this question to understand the different timescales at which businesses consider climate-related issues in their risk assessment process and in strategy and financial planning. Subsequent questions on risk and opportunity disclosure, strategy and financial planning, relate to different time horizons, hence their definition is requested here.
Connection to other frameworks
TCFD
Strategy recommended disclosure a) Describe the climate-related risks and opportunities the organization has identified over the short, medium, and long term.
S&P Global Corporate Sustainability Assessment
TCFD Disclosure
Response options
Please complete the following table:
| Time horizon | From (years) | To (years) | Comment |
| Short-term | Numerical field [enter a number from 0-100 using no decimals or commas] | Numerical field [enter a number from 0-100 using no decimals or commas] | Text field [maximum 2,400 characters] |
| Medium-term |
|
| |
| Long-term |
|
|
|
Requested content
General
- This question is seeking a definition of what your organization considers to be short-, medium-, and long-term horizons in the context of climate-related risks and opportunities.
- If your long-term time horizon is open-ended, you may leave the column “To (years)” blank.
Comment (column 4) (optional)
- You may specify if this time horizon for assessing climate-related risks and opportunities is aligned with other business practices time horizons and provide any other relevant information.
Additional information
Time horizons of climate-related risks
- There is a common perception that all climate-related risks are “long-term”, arising in 10+ years; however, transitional risks such as policies, technology, and markets are emerging earlier than this, and physical risks including the frequency and intensity of storms, floods, and droughts are recognized risks today.
- Evaluating exposure to climate-related risks over a range of time horizons allows for a strategy for the transition to a low-carbon economy as recognized in the Paris Agreement and UN SDGs.
TCFD position on time horizons
- Because the timing of climate-related impacts on organizations will vary, TCFD believes specifying timeframes across sectors could hinder organizations’ consideration of the climate-related risks and opportunities specific to their businesses. TCFD is therefore not defining timeframes and encourages respondents to decide how to define their own timeframes according to the life of their assets, the profile of the climate-related risks they face, and the sectors and geographies in which they operate.
- In assessing climate-related issues, organizations should be sensitive to the timeframes used to conduct their assessments. While many organizations conduct operational and financial planning over a 1-2 year timeframe, and strategic and capital planning over a 2-5 year timeframe, climate-related risks may have implications over a longer period. It is therefore important for organizations to consider the appropriate timeframes when assessing climate-related risks.
(C2.1b) How does your organization define substantive financial or strategic impact on your business?
Change from last year
No change
Rationale
The subsequent questions will ask you to disclose risks and opportunities with the potential to have a substantive financial or strategic impact on your business. What is considered a substantive impact for a business will be different for each responding company, therefore explaining your threshold for classifying potential impacts as substantive is critical context for CDP data users.
Response options
This is an open text question with a limit of 5,000 characters. Please note that when copying from another document into the ORS, formatting is not retained.
Requested content
General
- Describe and quantify, in detail, how your organization defines a ‘substantive impact’ on your business at the corporate level, in the context of a climate-related risk.
- What constitutes a substantive impact will vary between companies. For example, a 1% reduction in profits will have different effects on different companies depending on their respective profit margins. Companies are therefore asked to determine ‘substantive’ in the way that they would do for their business decision-making. For example, a substantive impact of relatively high magnitude could occur because of a large number for any one of the following aspects, or because of a small number for all three combines to create a larger impact:
- the proportion of business units affected
- the size of the impact on those business units
- the dependency of the organization on that unit
- the potential for shareholder or customer concern.
Explanation of terms
- Substantive impact on the business: an impact that has a considerable or relatively significant effect on an organization at the corporate level. This could include operational, financial or strategic effects that undermine the entire business or part of the business.
Example response
A substantive financial or strategic impact on our business is defined in our risk management process as follows: either the effect on revenue is more than EUR 50 million and the probability of occurrence is above 25%, or the effect on revenue is EUR 10-50 million and the probability of occurrence is above 75%.
(C2.2) Describe your process(es) for identifying, assessing and responding to climate-related risks and opportunities.
Question dependencies
This question only appears if you select "Yes" in response to C2.1.
Change from last year
Modified guidance
Rationale
Understanding how a company integrates the consideration of climate-related issues into its overall risk management framework provides insight into the thoroughness of the risk management processes employed by organizations. Companies that fully integrate and frequently assess climate-related risks and opportunities across their value chain and over a range of time-horizons may be better equipped to handle longer-term uncertainties and liabilities.
Connection to other frameworks
TCFD
Risk Management recommended disclosure a) Describe the organization’s processes for identifying and assessing climate-related risks.
Risk Management recommended disclosure b) Describe the organization’s processes for managing climate-related risks
Risk Management recommended disclosure c) Describe how processes for identifying, assessing, and managing climate related risks are integrated into the organization’s overall risk management.
S&P Global Corporate Sustainability Assessment
Climate Risk Assessment - Physical Risks
Climate Risk Assessment - Transition Risks
Climate Change Strategy
TCFD Disclosure
Response options
Please complete the following table. You are able to add rows by using the “Add Row” button at the bottom of the table.
| Value chain stage(s) covered
|
Risk management process
|
Frequency of assessment
|
Time horizon(s) covered
|
Description of process
|
Select all that apply:
- Direct operations
- Upstream
- Downstream [not shown to FS]
|
Select from:
- Integrated into multi-disciplinary company-wide risk management process
- A specific climate-related risk management process
|
Select from:
- More than once a year
- Annually
- Every two years
- Every three years or more
- Not defined
|
Select all that apply:
- Short-term
- Medium-term
- Long-term
- None of the above/Not defined
|
Text field [maximum 7,000 characters]
|
[Add Row]
Requested content
General
- You are requested to provide information on the risk management processes at all the stages of the value chain applicable to your organization.
- Upstream value chain refers to activities, products and services that are inputs to the activities of your business, sourced from third parties. This may include the regulations and policies applied by governments, or the products and services provided by your suppliers (i.e. the supply chain).
- Downstream value chain refers to the third parties benefiting from the outputs, products and services of your business activities. This may be your customers and clients, or the organizations and projects your business invests in.
- Note that if your response to this question refers to the position of employees relevant to your risk management processes, do not include the name of any individual or any other personal data in your response.
Value chain stage (column 1)
- Select all the stages of the value chain that your risk management process covers.
- If you have separate processes for different value chain stages, you may add rows to describe those processes separately.
Risk management process (column 2)
- Select the option that best describes how your process for identifying, assessing, and responding to climate-related risks and opportunities is integrated into your overall risk management framework. If your organization has more than one process in place, select the one that is most commonly employed. You will have the opportunity to expand further in column 5 “Description”.
- Integrated into multi-disciplinary company-wide risk management processes: a documented process where climate-related risks and opportunities are identified and assessed in an integrated way in the company’s centralized enterprise risk management program covering all possible types/sources of risks and opportunities
- A specific climate-related risk management process: a documented process that identifies, assesses and responds to climate change risks and opportunities separate from other business risks and opportunities.
Frequency of assessment (column 3)
- Select the option that describes how often climate-related risks are assessed. If climate-related risk management is integrated into company-wide risk management processes then the frequency of assessment will be the same throughout the enterprise risk management process.
Time horizons covered (column 4)
- Choose all the time horizons that are considered in your climate-related risk assessment. For example, if you only consider risks that may impact your business in the short term, in line with your definition of time horizons provided in C2.1a, you should select “short-term” here. Or, if you consider, short-term, medium-term and long-term horizons, select all three.
- In case none of the time horizons provided in C2.1a are covered by this risk management process, select “None of the above/ Not defined” and explain the applicable time horizon or why it is not defined in the column “Description”
Description (column 5)
- Describe your process for identifying, assessing and responding to climate-related risks and opportunities, including:
- The process used to determine which risks and opportunities could have a substantive financial or strategic impact on the organization;
- How your organization makes decisions to mitigate, transfer, accept or control the identified climate-related risks and to capitalize on opportunities.
- An explanation of the frequency of assessment and time horizons reported in columns 3 and 4.
Note for financial services sector companies
- This question is asking about the processes used to identify, assess and respond to climate-related risks and opportunities within your operations and your supply chain.
- There is a separate question on portfolio risk management.
Explanation of terms
- Risk management: Risk management involves identifying, assessing and responding to risk to make sure organizations achieve their objectives. It must be proportionate to the complexity and type of organization involved (based on Institute of Risk Management, 2016).
(C2.2a) Which risk types are considered in your organization's climate-related risk assessments?
Question dependencies
This question only appears if you select "Yes" in C2.1.
Change from last year
No change
Rationale
Data users need to know which risk types are considered in climate-related risk assessments. Not all risk types are relevant to each organization. The aim of this question is to ascertain how thoroughly companies examine multiple risk types as an indication of the comprehensiveness of the risk assessment.
Connection to other frameworks
TCFD
Risk Management recommended disclosure a) Describe the organization’s processes for identifying and assessing climate-related risks.
S&P Global Corporate Sustainability Assessment
Climate Risk Assessment - Physical Risks
Climate Risk Assessment - Transition Risks
Climate Change Strategy
TCFD Disclosure
Response options
Please complete the following table:
| Risk type
|
Relevance & inclusion
|
Please explain
|
|
Current regulation
|
Select from:
- Relevant, always included
- Relevant, sometimes included
- Relevant, not included
- Not relevant, included
- Not relevant, explanation provided
- Not evaluated
|
Text field [maximum 2,500 characters]
|
|
Emerging regulation
|
|
|
|
Technology
|
|
|
|
Legal
|
|
|
|
Market
|
|
|
|
Reputation
|
|
|
|
Acute physical
|
|
|
|
Chronic physical
|
|
|
Requested content
Please explain (column 3)
- Your response should explain:
- Your decision on the relevance and inclusion of this risk type in your risk assessment.
- For every risk type deemed relevant, an example of a specific risk considered in your assessment.
- If you choose ‘Not relevant, explanation provided’: why this risk type is not deemed relevant.
Note for financial services sector companies:
- Consider which climate-related risks are relevant to your lending, investment, insurance underwriting and/or financial intermediary activities, in addition to your operational risks.
- Consider characterizing your climate-related risks in the context of traditional industry risk categories such as credit risk, market risk, liquidity risk, and operational risk.
- Banks:
- Describe climate-related risks (transition and physical) in lending and other financial intermediary business activities by geography, industry, credit quality or average tenor.
- Describe climate-related risks on re-/insurance portfolios by geography, business division, or product segments, including the following risks:
- Physical risks from changing frequencies and intensities of weather-related perils;
- Transition risks resulting from a reduction in insurable interest due to a decline in value, changing energy costs, or implementation of carbon regulation; and
- Liability risks that could intensify due to a possible increase in litigation. For example, the risk of an increase in claims for defense costs in relation to directors and officers (D&O) liability.
- Additionally, as an asset owner, please also describe the climate-related risks relevant to your investment portfolio.
- Describe the climate-related risks relevant to your product or investment strategy by geography, industry, or product segment.
Explanation of terms
- Climate-related risks: TCFD divides climate-related risks into two major categories: risks related to the transition to a lower-carbon economy and risks related to the physical impacts of climate change.
- Transition risks
- Current and emerging regulation: policy developments that attempt to constrain actions that contribute to the adverse effects of climate change or policy developments that seek to promote adaptation to climate change;
- Technology: all risks associated with technological improvements or innovations that support the transition to a lower-carbon, energy-efficient economic system;
- Legal: all climate-related litigation claims;
- Market: all shifts in supply and demand for certain commodities, products, and services;
- Reputation: all risks tied to changing customer or community perceptions of an organization’s contribution to or detraction from the transition to a lower-carbon economy.
- Acute: risks that are event-driven, including increased severity of extreme weather events, such as cyclones, hurricanes, or floods;
- Chronic: longer-term shifts in climate patterns (e.g. sustained higher temperatures) that may cause sea level rise or chronic heat waves.
- Upstream and downstream risks: defined based on the location of the risks in your value chain and can also refer to any of the risk types above i.e. emerging regulation, technology, legal, market reputation etc.
Example response
| Risk type | Relevance & inclusion | Please explain |
|---|
| Current regulation | Relevant, always included | As an energy company, we are subject to many regulatory requirements relating to climate change, including the EU Emissions Trading Scheme (ETS), Energy Savings Opportunity Scheme (ESOS) and Energy Company Obligation (ECO). Due to the significance of such regulations to our business, we closely monitor and assess risks associated with any changes through their inclusion in our enterprise risk management (ERM) process. Operating costs of our business are expected to increase by an average of £300 per new regulatory measure introduced by the government. |
| Emerging regulation | Relevant, always included | We continually monitor, review, and assess proposed and incoming regulatory change as part of our ERM framework to mitigate and manage potential impacts on our business. Our company invested £500m in our business solutions over 2016-2018 and uncertainty over UK regulations, such as flexible generation incentives for distributed generation, could potentially affect our return on that investment therefore it was vital that regulatory changes relevant to climate change and with the potential to impact this investment were identified at an early stage and the required mitigations implemented. |
| Technology | Relevant, always included | Decarbonization is a significant driver of technology development within the energy sector and vice versa, including distributed energy products and services, such as demand response and energy optimization. We are currently launching a hybrid heat pump trial to increase our understanding of consumer behaviors around a technology we believe will play a significant role in the transition. |
| Legal | Relevant, always included | Failure to comply with our legal obligations in relation to climate change is a key risk to our business. For example, failure to deliver our obligations under ECO to improve domestic energy efficiency and invest in reducing heating costs for vulnerable customers could lead to enforcement action, including fines to compensate for consumer detriment. |
| Market | Relevant, always included | Consumer behavior is changing due to factors such as energy efficiency and climate change, leading to reduced energy usage volumes per customer in some markets. With 70% of our total revenue coming from energy supply, the risk from reduced demand is that our revenue will also reduce by approximately 2 million USD annually. |
| Reputation | Relevant, always included | An example of this risk type is damage to our brand, trust and reputation due to failure to manage our impact on society including climate change. For example, due to one of our partner company’s stake in a coal power plant, there was a risk of adverse media attention which could result in us losing customers. |
| Acute physical | Relevant, always included | Acute climate risks, such as extreme weather events, pose numerous challenges to our operations and assets, due to the potential for disruption to critical processes and/or infrastructure, as well as the potential for increased customer demand for our services. For example, flooding, snow and ice events impact our employees’ ability to travel to work safely and may drive an increased demand for domestic heating engineer callouts at the same time, placing pressure and safety risks on our workforce. |
| Chronic physical | Relevant, sometimes included | Long-term changes to weather patterns present both risks and opportunities for our business. Given the long-term nature of these trends and global scale of impact, such risks are considered through our annual strategic planning processes. While the possibility of milder winters could lead to a reduction in energy demand for heating, warmer summers would likely increase demand for cooling during the day and night, which could lead to significant changes in patterns of demand – both impacts could affect our supply revenue. |
Questions C-FS2.2b to C-FS2.2e only apply to organizations with activities in the Financial Services sector.
(C2.2g) Why does your organization not have a process in place for identifying, assessing, and responding to climate-related risks and opportunities, and do you plan to introduce such a process in the future?
Question dependencies
This question only appears if you select “No” in response to C2.1.
Change from last year
No change
Rationale
A thorough risk and opportunity assessment is integral to addressing climate-related issues. Therefore data users want to understand why your company does not carry out such assessments, as well as any plans to do so in the future. Without a process for managing risks and opportunities, companies may be unable to determine the best ways to prepare for future uncertainties and liabilities, or to capitalize on available opportunities.
Response options
Please complete the following table:
| Primary reason | Please explain |
| Select from: - We are planning to introduce a climate-related risk management process in the next two years
- Important but not an immediate business priority
- Judged to be unimportant, explanation provided
- Lack of internal resources
- Insufficient data on operations
- No instruction from management
- Other, please specify
| Text field [maximum 1,500 characters] |
Requested content
Primary reason (column 1)
- Select the primary reason why your company does not have a process in place to identify, assess, and respond to climate-related issues.
- Select only one option from the drop-down menu. If multiple options reasonably apply to your company, explain any additional reasons in column 2.
- If you select “Other, please specify”, provide a label for the primary reason.
Please explain (column 2)
- Ensure your explanation is company-specific and provides additional details as to why you do not have a process in place, including any specific plans to create a process and the anticipated timeline for its creation. For instance, you may include details on how you are exploring creating a process, using concrete examples from your company’s experience.
- Please also include details of how climate-related risks are addressed as they do arise (such as environmental legislation, weather-related events, or reputational risks related to climate change). Include company-specific examples in your description.
Risk disclosure
(C2.3) Have you identified any inherent climate-related risks with the potential to have a substantive financial or strategic impact on your business?
Change from last year
No change
Rationale
Investors and data users are interested in learning whether your organization has knowledge at the corporate level of any substantive climate-related risks, across any part of your value chain.
Connection to other frameworks
TCFD
Strategy recommended disclosure a) Describe the climate related risks and opportunities the organization has identified over the short, medium, and long term.
SDG
Goal 13: Climate action
Response options
Select one of the following options:
Requested content
General
- Please indicate if you have identified any inherent climate-related risks.
- For the purposes of this response, the risks reported should only be those which:
- May pose substantive financial or strategic impacts, in line with your definition of substantive impact provided in C2.1b; and
- Are inherent (risks that exist in the absence of controls, i.e. not taking into account any potential mitigation or management measures that have been or could be implemented).
Note for financial services sector companies:
- For the purposes of this response, the risks reported should be inherent and have the potential for substantive impacts on your investing, financing, underwriting and/or operational activities. Further details can be provided in subsequent questions.
(C2.3a) Provide details of risks identified with the potential to have a substantive financial or strategic impact on your business.
Question dependencies
This question only appears if you select “Yes” in response to C2.3.
Change from last year
Modified guidance
Rationale
Your response to this question will allow data users to see, in one place, details of the risks posed to your organization by climate-related issues, and also the estimated potential financial impact of these risks at the corporate level and your response strategy to manage these risks.
Connection to other frameworks
SDG
Goal 12: Responsible consumption and production
Goal 13: Climate action
TCFD
Strategy recommended disclosure a) Describe the climate related risks and opportunities the organization has identified over the short, medium, and long term.
Strategy recommended disclosure b) Describe the impact of climate-related risks and opportunities on the organization's businesses, strategy and financial planning.
Please note: columns 1-6 align with the TCFD recommendations.
S&P Global Corporate Sustainability Assessment
Climate Risk Assessment - Physical Risks
Climate Risk Assessment - Transition Risks
Financial Risks of Climate Change
Physical Climate Risk Adaptation
TCFD Disclosure
Response options
Please complete the following table. The table is displayed over several rows for readability. You are able to add rows by using the “Add Row” button at the bottom of the table.
| 1 |
2 |
3a |
3b |
4 |
5 |
6 |
7 |
| Identifier
|
Where in the value chain does the risk driver occur?
|
Risk type
|
Primary climate-related risk driver
|
Primary potential financial impact
|
[Financial services only]
Climate risk type mapped to traditional financial services industry risk classification
|
Company- specific description
|
Time horizon
|
Select from:
|
Select from: - Banking portfolio [FS only]
- Investing (Asset manager) portfolio [FS only]
- Investing (Asset owner) portfolio [FS only]
- Insurance underwriting portfolio [FS only]
- Direct operations
- Other parts of the value chain [FS only]
- Upstream [not shown to FS]
- Downstream [not shown to FS]
|
Select from:
- Current regulation
- Emerging regulation
- Legal
- Technology
- Market
- Reputation
- Acute physical
- Chronic physical
|
See drop-down options below
|
See drop-down options below
|
Select from:
- Capital adequacy and risk-weighted assets
- Liquidity risk
- Funding risk
- Market risk
- Credit risk
- Insurance risk
- Reputational risk
- Policy and legal risk
- Systemic risk
- Operational risk
- Strategic risk
- Other non-financial risk
- None
|
Text field [maximum 2,500 characters]
|
Select from:
- Short-term
- Medium-term
- Long-term
- Unknown
|
| 8 |
9 |
10 |
11 |
12 |
13 |
| Likelihood
|
Magnitude of impact
|
Are you able to provide a potential financial impact figure?
|
Potential financial impact figure (currency)
|
Potential financial impact figure - minimum (currency)
|
Potential financial impact figure - maximum (currency)
|
|
Select from:
- Virtually certain
- Very likely
- Likely
- More likely than not
- About as likely as not
- Unlikely
- Very unlikely
- Exceptionally unlikely
- Unknown
|
Select from:
- High
- Medium-high
- Medium
- Medium-low
- Low
- Unknown
|
Select from:
- Yes, a single figure estimate
- Yes, an estimated range
- No, we do not have this figure
|
Numerical field [enter a number from 0 to 999,999,999,999,999 using up to 2 decimal places]
|
Numerical field [enter a number from 0 to 999,999,999,999,999 using up to 2 decimal places]
|
Numerical field [enter a number from 0 to 999,999,999,999,999 using up to 2 decimal places]
|
| 14 |
15 |
16 |
17 |
| Explanation of financial impact figure
|
Cost of response to risk
|
Description of response and explanation of cost calculation
|
Comment
|
| Text field [maximum 2,500 characters]
|
Numerical field [enter a number from 0-999,999,999,999,999 using a maximum of 2 decimal places]
|
Text field [maximum 2,500 characters]
|
Text field [maximum 2.500 characters]
|
[Add Row]
Primary climate-related risk driver drop-down options (column 3b)
Select one of the following options:
Current regulation
- Carbon pricing mechanisms
- Enhanced emissions-reporting obligations
- Mandates on and regulation of existing products and services
- Regulation and supervision of climate-related risk in the financial sector [Financial services only]
- Other, please specify
Emerging regulation
- Carbon pricing mechanisms
- Enhanced emissions-reporting obligations
- Mandates on and regulation of existing products and services
- Regulation and supervision of climate-related risk in the financial sector [Financial services only]
- Other, please specify
Legal
- Exposure to litigation
- Regulation and supervision of climate-related risk in the financial sector [Financial services only]
- Lending that could create or contribute to systemic risk for the economy [Financial services only]
- Investing that could create or contribute to systemic risk for the economy [Financial services only]
- Insurance underwriting that could create or contribute to systemic risk for the economy [Financial services only]
- Other, please specify
Technology
- Substitution of existing products and services with lower emissions options
- Unsuccessful investment in new technologies
- Transitioning to lower emissions technology
- Other, please specify
|
Market
- Changing customer behavior
- Uncertainty in market signals
- Increased cost of raw materials
- Inability to attract co-financiers and/or investors due to uncertain risks related to the climate [Financial services only]
- Loss of clients due to a fund’s poor environmental performance outcomes (e.g. if a fund has suffered climate-related write-downs) [Financial services only]
- Contraction of insurance markets, leaving clients exposed and changing the risk parameters of the credit [Financial services only]
- Rise in risk-based pricing of insurance policies (beyond demand elasticity) [Financial services only]
- Other, please specify
Reputation
- Shifts in consumer preferences
- Stigmatization of sector
- Increased stakeholder concern or negative stakeholder feedback
- Lending that could create or contribute to systemic risk for the economy [Financial services only]
- Investing that could create or contribute to systemic risk for the economy [Financial services only]
- Insurance underwriting that could create or contribute to systemic risk for the economy [Financial services only]
- Negative press coverage related to support of projects or activities with negative impacts on the climate (e.g. GHG emissions, deforestation, water stress) [Financial services only]
- Other, please specify
Acute physical
- Avalanche
- Cold wave/frost
- Cyclone, hurricane, typhoon
- Drought
- Flood (coastal, fluvial, pluvial, groundwater)
- Glacial lake outburst
- Heat wave
- Heavy precipitation (rain, hail, snow/ice)
- Landslide
- Storm (including blizzards, dust, and sandstorms)
- Subsidence
- Tornado
- Wildfire
- Other, please specify
Chronic physical
- Changing precipitation patterns and types (rain, hail, snow/ice)
- Changing temperature (air, freshwater, marine water)
- Changing wind patterns
- Coastal erosion
- Heat stress
- Ocean acidification
- Permafrost thawing
- Precipitation and/or hydrological variability
- Saline intrusion
- Sea level rise
- Soil degradation
- Soil erosion
- Solifluction
- Temperature variability
- Water scarcity
- Other, please specify
|
Primary potential financial impact drop-down options (column 4)
Select one of the following options:
- Increased direct costs
- Increased indirect (operating) costs
- Increased capital expenditures
- Increased credit risk
- Decreased revenues due to reduced demand for products and services
- Decreased revenues due to reduced production capacity
- Decreased access to capital
- Decreased asset value or asset useful life leading to write-offs, asset impairment or early retirement of existing assets
- Increased insurance claims liability [Financial services only]
- Reduced profitability of investment portfolios [Financial services only]
- Devaluation of collateral and potential for stranded, illiquid assets [Financial services only]
- Other, please specify
Requested content
General
- For the purposes of this response, the risks reported should only be those which may pose inherently substantive impacts in your business operations, revenue, or expenditure, regardless of whether or not the company has taken action to mitigate the risk(s).
Identifier (column 1)
- Select a unique identifier from the drop down menu provided to identify the risk in subsequent questions, if required, and to track the status of the risk in subsequent reporting years. Please select from Risk1-Risk100 and use the same identifier in subsequent years for the same risk. For any new risks you are adding, always use a new identifier that you have not used previously.
Where in the value chain does the risk driver occur? (column 2)
- Upstream value chain refers to activities, products and services that are inputs to the activities of your business, sourced from third parties. This may include the regulations and policies applied by governments; the products and services provided by your suppliers (i.e. the supply chain).
- Downstream value chain refers to the third parties benefiting from the outputs, products and services of your business activities. This may be your customers and clients, or the organizations and projects your business invests in.
- [Financial Services only] The options shown will be driven by the organizational activities you selected in C-FS0.7.
Risk type (column 3a)
- See explanation of terms for definitions of risk types.
- Note that a selection must be made for both column 3a and column 3b. Your data will not be saved if either column is left blank.
Primary climate-related risk driver (column 3b)
- Risk driver describes the source of the risk and will depend on the risk type chosen in column 3a. Select an option that best describes the primary risk driver of the identified risk from the drop-down menu.
- Note that a selection must be made for both column 3a and column 3b. Your data will not be saved if either column is left blank.
Primary potential financial impact (column 4)
- This column refers to the potential financial impact that the risk could have on your organization. The financial impacts of climate-related issues on organizations are not always clear or direct, and for many organizations there might be more than one financial impact associated with a climate-related risk. Select the option from the drop-down menu that you evaluate as having the biggest impact. You can provide additional details on other financial impacts in the column Explanation of financial impact figure (column 14).
Climate risk type mapped to traditional financial services industry risk classification [Financial services only] (column 5)
- In this column consider how climate-related risks fit into your already existing organizational framework. Consider where in your traditional industry risk framework you classify the potential financial impact of the climate risk. As per the TCFD supplemental guidance to financial institutions, “Banks should consider characterizing their climate-related risks in the context of traditional banking industry risk categories such as credit risk, market risk, liquidity risk, and operational risk.” If an identified risk maps to multiple risk categories, choose the primary risk category.
- Capital adequacy and risks weighted assets: refers to the minimum amount of capital that must be held by financial institutions in order to reduce the risk of insolvency.
- Liquidity risk: occurs when a financial institution cannot meet its short-term debt obligations.
- Funding risk: refers to the risk associated with the impact on a project's cash flow from higher funding costs or lack of availability of funds.
- Market risk: refers to the possibility of loss resulting from an adverse movement in asset prices.
- Credit risk: refers the possibility of a loss resulting from a counterparty’s failure to repay a loan or meet contractual obligations.
- Insurance risk: refers to the possibility of loss resulting from an event(s) that triggers the insurer to pay (a) claim(s).
- Reputational risk: refers to the risk for negative public perception or to the potential of uncontrollable events to have an impact on a company's reputation.
- Policy and legal risk: refers to the possibility that legal action will be taken because of an individual's or corporation's actions, inaction, products, services, or other events.
- Systemic risk: the possibility that an event at the company level could trigger severe instability or collapse an entire industry or economy.
- Operational risk: refers to the possibility of loss resulting from failed processes, systems, human error or outside influences.
Company-specific description (column 6)
- Provide further contextual information on the risk driver, including more detail on the exact nature, location and/or regulation of the effect concerned, as well as any notable geographic/regional examples.
- Be sure to include company-specific detail, such as references to activities, programs, products, services, methodologies, or operating locations specific to your company’s business or operations.
Likelihood (column 8)
- The likelihood of the impact occurring along with the magnitude of the impact are the building blocks of a risk/opportunity matrix – a common method of identifying and prioritizing risk and opportunities.
- The likelihood refers to the probability of the impact to your business occurring within the time horizon provided, which in the case of an inherent risk might be similar to the probability of the climate event itself.
- For example, if the risk relates to a piece of new legislation which has already been prepared in draft form, the likelihood of the impact associated with that risk occurring will be relatively high.
Magnitude of impact (column 9)
- The magnitude describes the extent to which the impact, if it occurred, would affect your business. You should consider the business as a whole and therefore the magnitude can reflect both the damage that may be caused and the exposure to that potential damage.
- For example, two companies may have identical facilities located on a coast in an area which is vulnerable to sea level rise. However, if company A relies on that facility for 90% of its production capacity and company B relies on it for only 40% of its production capacity, the magnitude of a sea level rise impact on company A will be comparatively higher than that on company B.
- It is not possible for CDP to accurately define terms for magnitude as they will vary from company to company. For example, a 1% reduction in profits will have different effects on different companies depending on the profit margins on which they work. Therefore, companies are asked to determine magnitude on a qualitative scale. Factors to consider include:
- The proportion of business units affected;
- The size of the impact on those business units; and
- The potential for shareholder or customer concern.
Are you able to provide a potential financial impact figure? (column 10)
- Your selection will determine whether columns 11,12, and 13 will be presented.
- It is acknowledged that these figures will be estimates.
- If you are unable to provide a figure for a financial impact, you may use column 14 "Explanation of financial impact" to provide a description of the impact in relative terms; for example, as a percentage relative to a stated or publicly available figure, or give a qualitative estimate of the financial impact.
Potential financial impact figure (currency) (column 11)
- Provide a single figure for the inherent financial impact of the risks (before taking into consideration any controls you may have in place to mitigate the impacts). This figure should be in the same currency that you selected in question C0.4 for all financial information disclosed throughout your response.
- An example would be the cost of destruction of facilities from extreme weather (before taking into consideration how much insurance coverage you have).
Potential financial impact figure - minimum/maximum (currency) (columns 12, 13)
- Provide the estimated range for the inherent financial impact (before taking into consideration any controls you may have in place to mitigate the impacts). This figure should be in the same currency that you selected in question C0.4 for all financial information disclosed throughout your response.
- Potential financial impact figure – minimum (currency): Use this field to report the lower point of your estimated financial impact associated with the risk. For example, if the range is from US $5,000 to $50,000, ‘5,000’ should be reported here.
- Potential financial impact figure – maximum (currency): Use this field to report the upper point of your estimated financial impact associated with the risk. For example, if the range is from US $5,000 to $50,000, ‘50,000’ should be reported here.
Explanation of financial impact figure (column 14)
- Use this open text field to explain the figure provided in the “Potential financial impact” (columns 11, 12, 13);
- Describe how you arrived at this figure (or range), including:
- What approach was employed to calculate the figure;
- The figures used in your calculation;
- Any assumption the figure is dependent on.
- If "We do not have this figure" was selected in column 10, use this column to provide a description of the financial impact in relative terms (for example as a percentage relative to a stated or publicly available figure) or give a qualitative estimate of the financial impact. Otherwise, if you have no information about the financial impact, please state “The impact has not been quantified financially”.
- You can also describe here other financial impacts of the selected climate-related risk (other than the main impact identified in column 4), and provide more details on the nature of the impact in case you selected “Other, please specify” in column 4.
Cost of response to risk (column 15)
- Provide a quantitative figure for the cost of your risk response actions. If there are no costs to responding to the risk, enter 0.
- If you cannot provide an absolute value, you may report a percentage value by entering 0 in this column and then report the percentage figure in column “Description of response and explanation of cost calculation" (column 16), including an explanation for how the percentage was calculated.
- This figure should be in the same currency that you selected in question C0.4 for all financial information disclosed throughout your response.
Description of response and explanation of cost calculation (column 16)
- Provide details of your organization’s response to mitigate, control, transfer or accept the risk.
- Include an example of company-specific risk responses actions (activities, projects, products and/or services).
- Provide an explanation of how the figure for the cost of managing the risk (in column 15) was calculated, including the figures used in your calculation. If you entered 0 in column 15 “Cost of response to risk”, you should still explain how you arrived at a figure of 0, even if the cost is absorbed into business-as-usual activities.
Comment (column 17) (optional)
- You can use this text field to enter any additional relevant information.
Note for oil and gas sector companies:
- In answering the questions above, please consider the impact of national and international emissions targets and how those could affect demand for oil and gas products. Will they lead to your company having a less carbon-intensive fuel mix? Will fuel efficiency standards affect the demand for fuel? Are there other instances where demand is likely to reduce due to regulation?
- Is your company affected by other types of regulation such as restrictions on flaring, or by requirements for a certain level of climate-related performance in order to receive permission to operate and/or as a condition of accessing new oil & gas resources? (e.g. a requirement for carbon sequestration).
- Companies are encouraged to include these drivers in the response to this question and explain how their portfolio of reserves is evolving in response to these drivers (in the Comment column).
Note for electric utility sector companies:
- Electric utilities are asked to consider, among other issues:
- How national and international targets on demand management might affect demand for electricity;
- The impacts of related policies such as building regulations specifying more energy-efficient buildings;
- Policies to increase renewable electricity supply or to support developments that may result in GHG emissions reductions, e.g. CO2 capture and storage, clean coal technologies and energy storage;
- The impacts of any emissions trading schemes and any emissions reduction targets you have set or with which you have to comply, including the analysis of possible scenarios and their effect on the company;
- The effects on wholesale and retail power prices of carbon prices in the different markets in which you operate and the extent to which carbon prices are passed through, or may in the future be passed through, into electricity prices in the markets, based on current and anticipated regulatory requirements.
Note for auto and auto component manufacturing companies:
- Please consider the financial and strategic implications of current and planned national, regional, and international policies for increasing automobile fuel efficiency and developing “clean” engines for each of the markets in which you operate. You should also consider how other related environmental policies, such as regulations and standards regarding air quality, use of alternative fuels, and sustainable mobility could further impact your business.
- Specifically, you should take into account how climate change policy could impact you in terms of sales, the financial cost of any loss or potential loss of market share, additional costs of complying with regulation and, if applicable, how you have or will pass increased costs down the value chain.
Note for agricultural sector companies:
- Agricultural companies should report on risks that may affect the revenue associated with the agricultural/forestry, processing/manufacturing and/or distribution. These risk are often driven by:
- Physical factors, e.g. extreme weather events that disrupt production/supply of raw materials.
- Changes in regulation pertaining to agricultural, processing, manufacturing, distribution and/or consumption activities.
- Changes in consumer demands and new market trends
Note for companies with coal reserves:
Note for financial services sector companies:
- For the purposes of this response, the risks reported should be inherent and have the potential for substantive impacts on your investing, financing, underwriting and/or operational activities, regardless of whether any action has been taken to respond to the risk(s).
- Note that if providing a potential financial impact figure, this figure should represent the financial impact on your business. For example, if reporting a risk of stranded assets, you should report the potential financial impact (such as the write-down or devaluation) of the assets stranding on your balance sheet (before taking into consideration any controls you may have in place to mitigate the impacts), as opposed to reporting the portfolio exposure to those assets.
- Consider providing a description of risks by sector and/or geography, as appropriate. This can be provided in the "Company-specific description" (column 6).
- Both physical and transition risks in your investing, financing, underwriting, and/or operational activities should be considered, including the risk of stranded assets. These are assets that are no longer economically viable as a result of climate-related transition or physical risks.
- Banks:
- Banks should describe significant concentrations of credit exposure to carbon-related assets.
- Additionally, banks should consider disclosing their climate-related risks (transition and physical) in their lending and other financial intermediary business activities.
- Insurance companies should consider climate-related risks on re-/insurance portfolios by geography, business division, or product segments, including the following risks:
- Physical risks from changing frequencies and intensities of weather-related perils;
- Transition risks resulting from a reduction in insurable interest due to a decline in value, changing energy costs, or implementation of carbon regulation; and
- Liability risks that could intensify due to a possible increase in litigation. For example, the risk of an increase in claims for defense costs in relation to directors and officers (D&O) liability.
- Additionally, as an asset owner, please also describe the climate-related risks relevant to your investment portfolio.
- Asset managers should consider climate-related risks for each product or investment strategy.
Note for real estate companies:
- Since real estate is a location-bound and a long-term investment, it is highly exposed to climate-related risks. Commercial real
estate companies should consider stranding risks - the devaluation or
non-performance of assets, thus making them ‘stranded’.
- Stranded assets may be subject to write-downs due to:
- Demand shifts towards sustainable properties, putting pressure on ‘non-green’ assets;
- Higher exposure to acute physical risks (storms, flooding, wildfires, etc.);
Notes for capital goods sector companies:
- All the end markets supplied to by the capital goods sector face increasing regulation and decarbonization targets; from building standards to mandated technologies for power generation. Companies in this sector are therefore indirectly exposed to risks in their value chain, and should consider, among other issues, risks associated with:
- Carbon pricing regulation and stricter emissions constraints on products and services;
- Shifts in end-market demand away from fossil fuel dependent technologies.
Explanation of terms
- Climate-related risks: TCFD divides climate-related risks into two major categories: risks related to the transition to a lower-carbon economy and risks related to the physical impacts of climate change.
- Transition risks
- Current and emerging regulation – policy developments that attempt to constrain actions that contribute to the adverse effects of climate change or policy developments that seek to promote adaptation to climate change;
- Technology – all risks associated with technological improvements or innovations that support the transition to a lower-carbon, energy-efficient economic system;
- Legal – all climate-related litigation claims;
- Market – all shifts in supply and demand for certain commodities, products, and services;
- Reputation – all risks tied to changing customer or community perceptions of an organization’s contribution to or detraction from the transition to a lower-carbon economy.
- Acute – risks that are event-driven, including increased severity of extreme weather events, such as cyclones, hurricanes, or floods;
- Chronic – longer-term shifts in climate patterns (e.g., sustained higher temperatures) that may cause sea level rise or chronic heat waves.
- Likelihood: The terms used to describe likelihood are taken from the Intergovernmental Panel on Climate Change’s (IPCC) 2013 reports. They are associated with probabilities, indicating the percentage likelihood of the event occurring. It is not necessary for respondents to have calculated probabilities for the risks they are considering, however they can give an indication as to the meaning of the terms:
- Virtually certain: 99–100% probability
- Very likely: 90–100%;
- Likely: 66–100%;
- More likely than not: 50–100%;
- About as likely as not: 33–66%;
- Unlikely: 0–33%;
- Very unlikely: 0-10%;
- Exceptionally unlikely: 0–1%.
- Direct costs: Also known as “costs of goods or services sold”. These expenses can be attributed to the manufacture of a particular product or the provision of a particular service.
- Indirect (operating) costs: Refers to the essential expenses incurred in order to maintain the business including wages, rent, transport, energy (electricity, fuel, etc.), maintenance, and so on. These expenses cannot be attributed to the manufacture of a particular product or the provision of a particular service - they are standard costs that apply regardless of the volume of goods produced.
- Capital expenditure: A measure of the value of purchases of fixed assets such as property, buildings, an industrial plant, technology, or equipment. Put differently, CapEx is any type of expense that a company capitalizes, or shows on its balance sheet as an investment, rather than on its income statement as an expenditure.
- Revenue: Income arising in the course of an entity’s ordinary activities (less returns, allowances and discounts) - before deducting costs for the goods/services sold and operating expenses to arrive at profit (based on the International Financial Reporting Standard)
- Access to capital: Cash flows from sources other than an organization’s sales and other revenues. It includes cash infusions from investors or securing lines of credit with banks and other lenders.
Example response
| Identifier
|
Where in the value chain does the risk driver occur?
|
Risk type
|
Primary climate-related risk driver
|
Primary potential financial impact
|
| Risk1
|
Direct Operations
|
Chronic physical
|
Changing temperature (air, freshwater, marine water)
|
Increased direct costs
|
| Company- specific description
|
Time horizon
|
Likelihood
|
Magnitude of impact
|
Are you able to provide a potential financial impact figure?
|
Company X owns and operates data centres across the United States and Europe. Our data centres require cooling to maintain a stable temperature to operate. All of our data centres use our in-house DATACOOL systems to regulate temperatures. However, as global mean temperatures rise, more cooling is required, needing more electricity usage to cool the data centres. Correspondingly the cost of cooling will increase.
Company X carried out a scenario analysis to identify the likely impact on cooling costs under a 1.5°C scenario. With the existing DATACOOL technologies in use in our North American and European operations, costs associated with data centre cooling will increase 63% overall by 2050. This reflects a 65% increase in electricity consumption for our 345 North American data centres, and 58% across our 90 European facilities. For our largest data centre in Dallas Texas, we anticipate cooling costs to increase by 120% by 2050.
|
Long-term
|
Very likely
|
Medium
|
Yes, a single figure estimate
|
| Potential financial impact figure (currency)
|
Explanation of financial impact figure
|
Cost of response to risk
|
Description of response and explanation of cost calculation
|
Comment
|
| $63,000,000
|
The $63 million figure is based on a 63% increase in annual data centre cooling costs across all our operations by 2050, under a 1.5°C scenario. This is based on current annual cooling costs of $100 million. This figure assumes continued use of existing DATACOOL cooling systems.
|
$25,000,000
|
As global mean temperatures rise, the cost of cooling our data centres is set to increase significantly. As part of our 2025 business strategy, Company X’s response to this risk consists of two programmes. First, we are investing $15 million in research and development towards next generation DATACOOL cooling systems, including outside air and sea water indirect cooling technologies. These have the potential to reduce our cooling costs by up to 70%. Second, we are investing $10 million in self-generation renewable energy projects. This investment will double our current renewable generation capacity and reduce our exposure to increasing electricity costs as cooling costs increase.
The total cost of the response to risk, $25 million, is the sum of the cost of these two programmes: $15 million in R&D for more energy efficient cooling technologies, and an investment of $10 million in renewable electricity self-generation capacity.
|
N/A
|
(C2.3b) Why do you not consider your organization to be exposed to climate-related risks with the potential to have a substantive financial or strategic impact on your business?
Question dependencies
This question only appears if you select “No” in response to C2.3.
Change from last year
No change
Rationale
A risk assessment may identify no substantive climate-related risks. This conclusion is important to disclose and explain. Knowing why your organization has concluded that it is not exposed to risks is crucial for data users to understand your business.
Response options
Please complete the following table:
| Primary reason
|
Please explain
|
|
Select from:
- Risks exist, but none with potential to have a substantive financial or strategic impact on business
- Evaluation in process
- Not yet evaluated
- Other, please specify
|
Text field [maximum 2,500 characters]
|
Requested content
Primary reason (column 1)
- Select the reason that best describes why you consider your organization to not be exposed to climate-related risks with the potential to have a substantive financial or strategic impact on your business, given your definition of substantive as reported in C2.1b.
Please explain (column 2)
- Your explanation should include company-specific details such as your evaluation process or specific reasons why you have not yet conducted a risk assessment or why there are no climate-related risks to your organization.
Opportunity disclosure
(C2.4) Have you identified any climate-related opportunities with the potential to have a substantive financial or strategic impact on your business?
Change from last year
No change
Rationale
Investors and data users wish to know whether your organization has identified at the corporate level any substantive climate-related opportunities, presented across any part of your value chain.
Connection to other frameworks
SDG
Goal 13: Climate action
TCFD
Strategy recommended disclosure a) Describe the climate related risks and opportunities the organization has identified over the short, medium, and long term.
S&P Global Corporate Sustainability Assessment
TCFD Disclosure
Response options
Select one of the following options:
- Yes
- Yes, we have identified opportunities but are unable to realize them
- No
Requested content
General
- Regulation on climate change as well as physical changes related to climate may present opportunities for your organization in a variety of ways, for example through the adoption of low-emission energy sources, the development of new products and services and access to new markets. Further details of such opportunities are provided in the guidance for question C2.4a.
- Please note that opportunities can be:
- Currently being experienced or expected to arise in the future
- Being managed or newly identified
- Well understood or with high levels of uncertainty with regard to the likelihood of the opportunity materializing and the extent to which it will impact the business
Note for financial services sector companies:
- For the purposes of this response, the opportunities reported should be inherent and have the potential for substantive impacts on your investing, financing, underwriting and/or operational activities. Further details can be provided in subsequent questions.
(C2.4a) Provide details of opportunities identified with the potential to have a substantive financial or strategic impact on your business.
Question dependencies
This question only appears if you select “Yes” in response to C2.4.
Change from last year
Modified guidance
Rationale
Your response to this question will allow CDP data users to see, in one place, details of the opportunities posed to your organization by climate-related issues, and also the estimated potential scale of these opportunities at the corporate level and your response strategy to take advantage of these opportunities.
Connection to other frameworks
SDG
Goal 7: Affordable and clean energy
Goal 12: Responsible consumption and production
Goal 13: Climate action
TCFD
Strategy recommended disclosure a) Describe the climate related risks and opportunities the organization has identified over the short, medium, and long term.
Strategy recommended disclosure b) Describe the impact of climate-related risks and opportunities on the organization’s businesses, strategy, and financial planning.
Please note: columns 1-7 align with the TCFD recommendations.
S&P Global Corporate Sustainability Assessment
Financial Opportunities Arising from Climate Change
TCFD Disclosure
Response options
Please complete the following table. The table is displayed over several rows for readability. You are able to add rows by using the “Add Row” button at the bottom of the table.
| 1 |
2 |
3 |
4 |
5 |
6 |
7 |
| Identifier
|
Where in the value chain does the opportunity occur?
|
Opportunity type
|
Primary climate-related opportunity driver
|
Primary potential financial impact
|
Company-specific description
|
Time horizon
|
| Select from:
|
Select from:
- Banking portfolio [FS only]
- Investing (Asset manager) portfolio [FS only]
- Investing (Asset owner) portfolio [FS only]
- Insurance underwriting portfolio [FS only]
- Direct operations
- Other parts of the value chain [FS only]
- Upstream [not shown to FS]
- Downstream [not shown to FS]
|
Select from:
- Resource efficiency
- Energy source
- Products and services
- Markets
- Resilience
|
See drop-down options below
|
See drop-down options below
|
Text field [maximum 2,500 characters]
|
Select from:
- Short-term
- Medium-term
- Long-term
- Unknown
|
| 8 |
9 |
10 |
11 |
12 |
13 |
| Likelihood
|
Magnitude of impact
|
Are you able to provide a potential financial impact figure?
|
Potential financial impact figure (currency)
|
Potential financial impact figure - minimum (currency)
|
Potential financial impact figure - maximum (currency)
|
Select from:
- Virtually certain
- Very likely
- Likely
- More likely than not
- About as likely as not
- Unlikely
- Very unlikely
- Exceptionally unlikely
- Unknown
|
Select from:
- High
- Medium-high
- Medium
- Medium-low
- Low
- Unknown
|
Select from:
- Yes, a single figure estimate
- Yes, an estimated range
- No, we do not have this figure
|
Numerical field [enter a number from 0 to 999,999,999,999,999 using up to 2 decimal places]
|
Numerical field [enter a number from 0 to 999,999,999,999,999 using up to 2 decimal places]
|
Numerical field [enter a number from 0 to 999,999,999,999,999 using up to 2 decimal places]
|
| 14 |
15 |
16 |
17 |
| Explanation of financial impact figure
|
Cost to realize opportunity
|
Strategy to realize opportunity and explanation of cost calculation
|
Comment
|
| Text field [maximum 2,500 characters]
|
Numerical field [enter a number from 0 to 999,999,999,999,999 using up to 2 decimal places]
|
Text field [maximum 2,500 characters]
|
Text field [maximum 2,500 characters]
|
[Add Row]
Primary climate-related opportunity driver drop-down options (column 4)
Select one of the following options:
Resource efficiency
- Use of more efficient modes of transport
- Use of more efficient production and distribution processes
- Use of recycling
- Move to more efficient buildings
- Reduced water usage and consumption
- Other, please specify
Energy source
- Use of lower-emission sources of energy
- Use of supportive policy incentives
- Use of new technologies
- Participation in carbon market
- Shift toward decentralized energy generation
- Other, please specify
|
Products and services
- Development and/or expansion of low emission goods and services
- Development of climate adaptation, resilience and insurance risk solutions
- Development of new products or services through R&D and innovation
- Ability to diversify business activities
- Shift in consumer preferences
- Reputational benefits resulting in increased demand for goods/services [Financial services only]
- Other, please specify
Markets
- Access to new markets
- Use of public-sector incentives
- Access to new assets and locations needing insurance coverage
- Increased diversification of financial assets (e.g., green bonds and infrastructure) [Financial services only]
- Increased sales of liability and other insurance to cover climate-related risks [Financial services only]
- Reduced risk of asset stranding considered in investment decision making [Financial services only]
- More timely preparation for investors in adhering to current and potentially stricter future regulation in relation to fiduciary duty [Financial services only]
- Increased demand for funds that invest in companies that have positive environmental credentials [Financial services only]
- Enhanced financial performance of investee companies as a result of being able to access new markets and develop new products to meet green consumer demand [Financial services only]
- The development of new revenue streams from new/emerging environmental markets and products [Financial services only]
- Improved ratings by sustainability/ESG indexes [Financial services only]
- Other, please specify
Resilience
- Participation in renewable energy programs and adoption of energy-efficiency measures
- Resource substitutes/diversification
- New products and services related to ensuring resiliency [Financial services only]
- Increased reliability, climate- resilience of investment chain [Financial services only]
- Other, please specify
|
Primary potential financial impact drop-down options (column 5)
Select from the following options:
- Reduced direct costs
- Reduced indirect (operating) costs
- Increased revenues resulting from increased demand for products and services
- Increased revenues through access to new and emerging markets
- Increased revenues resulting from increased production capacity
- Increased access to capital
- Increased value of fixed assets
- Increased diversification of financial assets
- Increased portfolio value due to upward revaluation of assets [Financial services only]
- Returns on investment in low-emission technology
- Other, please specify
Requested content
General
- For the purposes of this response, the opportunities identified should only be those which may pose substantive impacts in your business operations, revenue, or expenditure.
Identifier (column 1)
- Select a unique identifier from the drop down menu provided to identify the opportunity in subsequent questions, if required, and to track the status of the opportunity in subsequent reporting years. Please select from Opp1-Opp100 and use the same identifier in subsequent years for the same opportunity. For any new opportunities you are adding, always use a new identifier that you have not used previously.
Where in the value chain does the opportunity occur? (column 2)
- Upstream value chain refers to activities, products and services that are inputs to the activities of your business, sourced from third parties. This may include the regulations and policies applied by governments; the products and services provided by your suppliers (i.e. the supply chain).
- Downstream value chain refers to the third parties benefiting from the outputs, products and services of your business activities. This may be your customers and clients, or the organizations and projects your business invests in.
- [Financial Services only] The options shown will be driven by the organizational activities you selected in C-FS0.7.
Opportunity type (column 3)
- Select an option from the drop-down menu that best describes the type of the identified opportunity:
- Resource efficiency – opportunities related to improving resource efficiency across production and distribution processes, buildings, machinery/appliances, and transport/mobility.
- Energy source - opportunities related to shifting energy usage toward low emission energy sources.
- Products and services - opportunities related to innovation and development of new low-emission and climate adaptation products and services.
- Markets – opportunities in new markets or types of assets that may help organizations to diversify their activities and better position themselves for the transition to a lower-carbon economy.
- Resilience – opportunities related to the development of adaptive capacity to respond to climate change. They may be especially relevant for organizations with long-lived fixed assets or extensive supply or distribution networks; those that depend critically on utility and infrastructure networks or natural resources in their value chain; and those that may require longer-term financing and investment.
Primary climate-related opportunity driver (column 4)
- Opportunity driver describes the source of the opportunity and will depend on the opportunity type selected in column 3. Select an option from the drop-down menu that best describes the identified opportunity. If you select “Other”, please provide further details in column Company-specific description (6).
Primary potential financial impact (column 5)
- This column refers to the potential financial impact that the opportunity could have on your organization. The financial impacts of climate-related opportunities on organizations are not always clear or direct, and for many organizations there might be more than one financial impact associated with a climate-related opportunity;
- Select the option that you deem to have the biggest impact. You can provide additional details on other financial impacts in the column Explanation of financial impact figure (column 14);
Company-specific description (column 6)
- Provide further context on the opportunity driver, including more detail on the exact nature, location, and/or regulation of the effect concerned, as well as any notable geographic/regional examples.
- Be sure to include company-specific detail, such as references to activities, programs, products, services, methodologies, or operating locations specific to your company’s business or operations.
Likelihood (column 8)
- The likelihood of the impact occurring, along with the magnitude (see below) are the building blocks of a risk/opportunity matrix – a common method of identifying and prioritizing risk and opportunities.
- The likelihood refers to the probability of the impact to your business occurring within the time horizon provided, which in the case of an inherent opportunity might be similar to the probability of the climate event itself.
- For example, if the opportunity relates to a piece of new legislation which has already been prepared in draft form, the likelihood of the impact associated with that opportunity occurring will be relatively high.
Magnitude of impact (column 9)
- The magnitude describes the extent to which the impact, if it occurred, would affect your business. This should consider the business as a whole and therefore the magnitude can reflect both the opportunity and the extent to which it applies throughout the organization.
- It is not possible to accurately define terms for magnitude as they will vary from company to company. Therefore, companies are asked to determine magnitude on a qualitative scale. Factors to consider include:
- The proportion of business units affected;
- The size of the impact on those business units; and
- The potential for shareholder or customer response.
Are you able to provide a potential financial impact figure? (column 10)
- Your selection will determine whether column 11 or columns 12 and 13 will be presented.
- It is acknowledged that these will be estimates and, where possible, assumptions made in arriving at a financial impact figure should be stated in the column 14 ("Explanation of financial impact").
- If you are unable to provide a figure for a financial impact, you may use column 14 to provide a description of the impact in relative terms; for example, as a percentage relative to a stated or publicly available figure, or give a qualitative estimate of the financial impact
Potential financial impact figure (currency) (column 11)
- Provide a single figure for the financial impact of the opportunity. This figure should be in the same currency that you selected in question C0.4 for all financial information disclosed throughout your response.
Potential financial impact figure (currency) (columns 12, 13)
- Provide the estimated range for the financial impact of the opportunity. This figure should be in the same currency that you selected in question C0.4 for all financial information disclosed throughout your response.
- Potential financial impact figure – minimum (currency): use this field to report the lower point of your estimated financial impact associated with the opportunity. For example, if the range is from US $5,000 to $50,000, "5,000" should be reported here.
- Potential financial impact figure – maximum (currency): use this field to report the upper point of your estimated financial impact associated with the opportunity. For example, if the range is from US $5,000 to $50,000, "50,000" should be reported here.
Explanation of financial impact figure (column 14)
- Use this open text field to explain the figure provided in the “Potential financial impact” (columns 11, 12, 13).
- Describe how you arrived at this figure (or range), including:
- What approach was employed to calculate the figure;
- The figures used in your calculations;
- Any assumptions the figure is dependent on.
- If ‘We do not have this figure’ was selected in column 10, use this column to provide a description of the financial impact in relative terms (for example as a percentage relative to a stated or publicly available figure) or give a qualitative estimate of the financial impact. Otherwise, if you have no information about the financial impact, please state “The impact has not been quantified financially”.
- You can also describe here other financial impacts of the selected climate-related opportunity (other than the main impact identified in column 5), and provide more details on the nature of the impact in case you selected “Other, please specify” in column 5.
Cost to realize opportunity (column 15)
- Provide numerical data on the cost to realize opportunity. If there are no costs to this, enter 0.
- If you cannot provide an absolute value, you may report a percentage value by entering 0 in this column and then report the percentage figure in column “Strategy to realize opportunity and explanation of cost calculation” (column 16), including an explanation for how the percentage was calculated.
Strategy to realize opportunity and explanation of cost calculation (column 16)
- Use this text field to provide information on methods you are using or plan to use to exploit the opportunity and maximize its potential realization. Make sure to include an example of company specific activities, projects, products and/or services which are aiming to realize the opportunity. Make sure to include:
- An example of company-specific activities, projects, products and/or services which are aiming to realize the opportunity; and
- An explanation of how the figure for the cost to realize opportunity (in column 15) was calculated, including the figures used in your calculation. If you entered 0 in column 15 “Cost to realize opportunity”, you should still explain how you arrived at a figure of 0, even if the cost is absorbed into business-as-usual activities.
Comment (column 17) (optional)
- You can use this text field to enter any additional relevant information.
Note for electric utility sector companies:
- In answering the questions above, please consider:
- Opportunities that may arise from emissions trading;
- The opportunities that national or international targets on energy efficiency and demand management might present for your company e.g. revenue implications from energy services business units;
- Your company’s views on any opportunities that may result from policies on renewable energy or low emissions technologies e.g. current or planned investments in these areas; and
- The extent to which you receive financial incentives to reduce the electricity use of customers.
Note for agricultural sector companies:
- Agricultural companies should report on opportunities that the revenue associated with the agricultural/forestry, processing/manufacturing and/or distribution of raw materials and goods. For example, opportunities might arise from:
- Increased efficient by reducing energy use during the production of raw materials and/or the manufacture of food, beverage and other goods;
- Reduced costs due to carbon payments by adopting practices or technology to reduce carbon footprint;
- Government of private financial incentives for adoption low impact agriculture/forestry.
Note for financial services sector companies:
- Consider opportunities associated with products and services such as green bonds, green infrastructure, green loans/mortgages, green insurance products, products and services ensuring resiliency, specialty climate-related risk advisory services and others.
- Note that if providing a potential financial impact figure, this figure should represent the financial impact on your business. For example, the potential revenues generated by green loans should be reported, as opposed to the potential size of the green loan book.
- You should consider providing a description of your opportunities by sector and/or geography, as appropriate.
Note for capital goods sector companies:
- In line with the TCFD’s recommendations, companies in this sector should consider opportunities for products or services that improve efficiency, reduce energy use and support closed-loop product solutions.
Explanation of terms
- Likelihood: The terms used to describe likelihood are taken from the Intergovernmental Panel on Climate Change’s (IPCC) 2013 reports. They are associated with probabilities, indicating the percentage likelihood of the event occurring. It is not necessary for respondents to have calculated probabilities for the risks they are considering, however they can give an indication as to the meaning of the terms:
- Virtually certain: 99–100% probability;
- Very likely: 90–100%;
- Likely: 66–100%;
- More likely than not: >50–100%;
- About as likely as not: 33–66%;
- Unlikely: 0–33%;
- Very unlikely: 0-10%;
- Exceptionally unlikely: 0–1%.
- Direct costs: Also known as “costs of goods or services sold”. These expenses can be attributed to the manufacture of a particular product or the provision of a particular service.
- Indirect (operating) costs: Refers to the essential expenses incurred in order to maintain the business including wages, rent, transport, energy (electricity, fuel, etc.), maintenance, and so on. These expenses cannot be attributed to the manufacture of a particular product or the provision of a particular service - they are standard costs that apply regardless of the volume of goods produced.
- Revenue: Income arising in the course of an entity’s ordinary activities (less returns, allowances and discounts) - before deducting costs for the goods/services sold and operating expenses to arrive at profit (based on the International Financial Reporting Standard)
- Access to capital: Cash flows from sources other than an organization’s sales and other revenues. It includes cash infusions from investors or securing lines of credit with banks and other lenders.
Example response
| Identifier
|
Where in the value chain does the opportunity occur?
|
Opportunity type
|
Primary climate-related opportunity driver
|
Primary potential financial impact
|
Company- specific description
|
Time horizon
|
| Opp1
|
Downstream
|
Products and services
|
Development and/or expansion of low emissions goods and services
|
Increased revenues resulting from increased demand for products and services
|
Company Y produces packaging solutions for customers worldwide. The opportunity identified is increasing demand for our low-carbon, sustainable packaging ranges. Global awareness of climate change and the existential risk it poses to humanity is fueling demand for low-carbon products, including our packaging ranges made from non-virgin materials. Since launching in 2010, our carbon neutral ECO-PACK product range has grown to comprise 85% of our annual revenue. Based on current growth trends and market data, we anticipate ECO-PACK sales to increase a further 240% in our North American markets, 160% in the EMEA and APAC regions to 2030.
|
Medium-term
|
|
Likelihood
|
Magnitude of impact
|
Are you able to provide a potential financial impact figure?
|
Potential financial impact figure (currency)
|
Explanation of financial impact figure
|
Cost to realize opportunity
|
Strategy to realize opportunity and explanation of cost calculation
|
Comment
|
Likely
|
High
|
Yes, a single figure estimate
|
$870,000,000
|
The $870 million figure is based on a 200% increase in annual sales revenue from ECO-PACK product lines by 2030. This is based on current annual sales of $435 million. This figure is based on current growth trends and assumes no new product lines are developed.
|
$100,000,000
|
Company Y’s strategy to realise the opportunity consists of a 2030 marketing strategy for ECO-PACK product lines to capitalize on the growing demand for low-carbon packaging solutions, and a ramping up of ECO-PACK production capacity.
As part of our new marketing strategy, we will coordinate marketing campaigns for our award-winning ECO-PACK product lines in each of the regions, North America, EMEA and APAC. This will enable us to double annual sales revenue by 2030. At the same time, we are investing in increasing ECO-PACK production capacity by building a state-of-the-art, net-zero production facility in Germany. Production will begin at the facility in 2023, allowing us to more than double production capacity of our sustainable product lines.
The total cost to realise the opportunity, $100 million, consists of marketing costs of $6 million and a further $94 million on increasing production capacity to 2030.
|
N/A
|
(C2.4b) Why do you not consider your organization to have climate-related opportunities?
Question dependencies
This question only appears if you select “No” or “Yes, we have identified opportunities but are unable to realize them” in response to C2.4.
Change from last year
No change
Rationale
Investors and other data users are interested to know whether you are aware of climate-related opportunities. An explanation of why your organization has concluded that it is not exposed to opportunities is crucial for understanding your business strategy.
Response options
Please complete the following table:
| Primary reason
|
Please explain
|
|
Select from:
- Opportunities exist, but we are unable to realize them
- Opportunities exist, but none with potential to have a substantive financial or strategic impact on business
- Evaluation in progress
- Judged to be unimportant
- No instruction from management to seek out opportunities
- Not yet evaluated
- Other, please specify
|
Text field [maximum 2,500 characters]
|
Requested content
Primary reason (column 1)
- Select the reason that best describes why you consider your organization to not be exposed to climate-related opportunities with the potential to have a substantive financial or strategic impact on your business.
Please explain (column 2)
- Please explain further why there are no climate-related opportunities for your company or, if they exist, why you are unable to realize them;
- If relevant to your selection in column 1, please:
- Make reference to how you identified opportunities;
- Include how you have defined ‘substantive’ impact in the context of an opportunity, and reference the definition of substantive impact you gave in C2.1b if applicable;
- Describe when you will next repeat an assessment of opportunities;
- Include specific reasons why you have not yet conducted an opportunity assessment/why it is considered unimportant for your business;
- Provide any other company-specific details such as your evaluation process.
C3 Business strategy
Module Overview
CDP data users are interested in organizations’ forward-looking strategies and financial decisions that are driven by climate-related future market opportunities, public policy objectives, and corporate responsibilities. This module allows organizations to disclose whether they have acted upon integrating climate-related issues into their business strategy. The module includes questions on scenario analysis and transition planning which are important evolutions in strategic environmental planning.
Given the importance of forward-looking assessments of climate-related risks and opportunities, scenario analysis is an important and useful tool for an organization to use, both for understanding strategic implications of climate-related risks and opportunities, and for informing stakeholders of how the organization is positioning itself in recognition of these issues. It also can aid investors, lenders, and insurance underwriters in informing their own financial decision making.
Transition planning is also an important evolution of strategic environmental planning, and includes all the relevant changes that need to be made to the company’s business model before the company can adjust to a net-zero future. This is especially relevant for companies operating in high impact sectors.
Climate-related scenario analysis and transition planning disclosure was piloted by CDP in the Assessing Low-Carbon Transition (ACT) initiative in 2016. Further information on conducting and disclosing scenario analysis can be found in the CDP Technical Note on Scenario Analysis. Further information on transition planning can be found in the CDP Climate Transition Plan technical note.
Responses given in this module should be relevant to the reporting period, even if revisions have been made to your strategy between the reporting period and the time of submission of your CDP response. Where this is the case, you can include more up to date information in C-FI field at the end of the questionnaire. This will not be scored but will be available to investors, banks and customers (in the case of those responding on behalf of Supply Chain Members) that view your response.
Note for financial services sector companies:
- Financial services sector companies are asked to consider how climate-related risks and opportunities will affect business strategy in relation to their lending, financial intermediary, investment and/or insurance underwriting activities, in addition to operational activities.
Key changes
- New questions:
- C3.5b asks about the share of spending and revenue aligned with sustainable finance taxonomies at the activity level.
- C3.5c requests additional contextual information relevant to taxonomy alignment.
- Modified questions:
- C3.5 – has more response options that drive the subsequent new questions.
- C3.5a – has new columns to report a figure for taxonomy alignment and disclose the taxonomy and objective if required.
- [Financial Services Only] C-FS3.6 – requests an explanation for why the policy framework does not include climate-related requirements if this option is selected.
- [Financial Services Only] C-FS3.6a – includes a new drop-down option to disclose developments of pathways to net-zero by 2050 or sooner.
- [Financial Services Only] C-FS3.8a – requests information on coverage of covenants.
- Modified guidance:
- C3.4 – clarification that companies should provide details of how they plan to resource the different aspects of their climate transition plan.
- Additional guidance:
- C3.2b – additional information added on exploratory and normative scenario analysis.
Click here for a list of all changes made this year.
Sector-specific content
Additional questions for FS sector companies.
Pathway diagram - questions
This diagram shows the general questions contained in module C3. To access question-level guidance, use the menu on the left to navigate to the question.
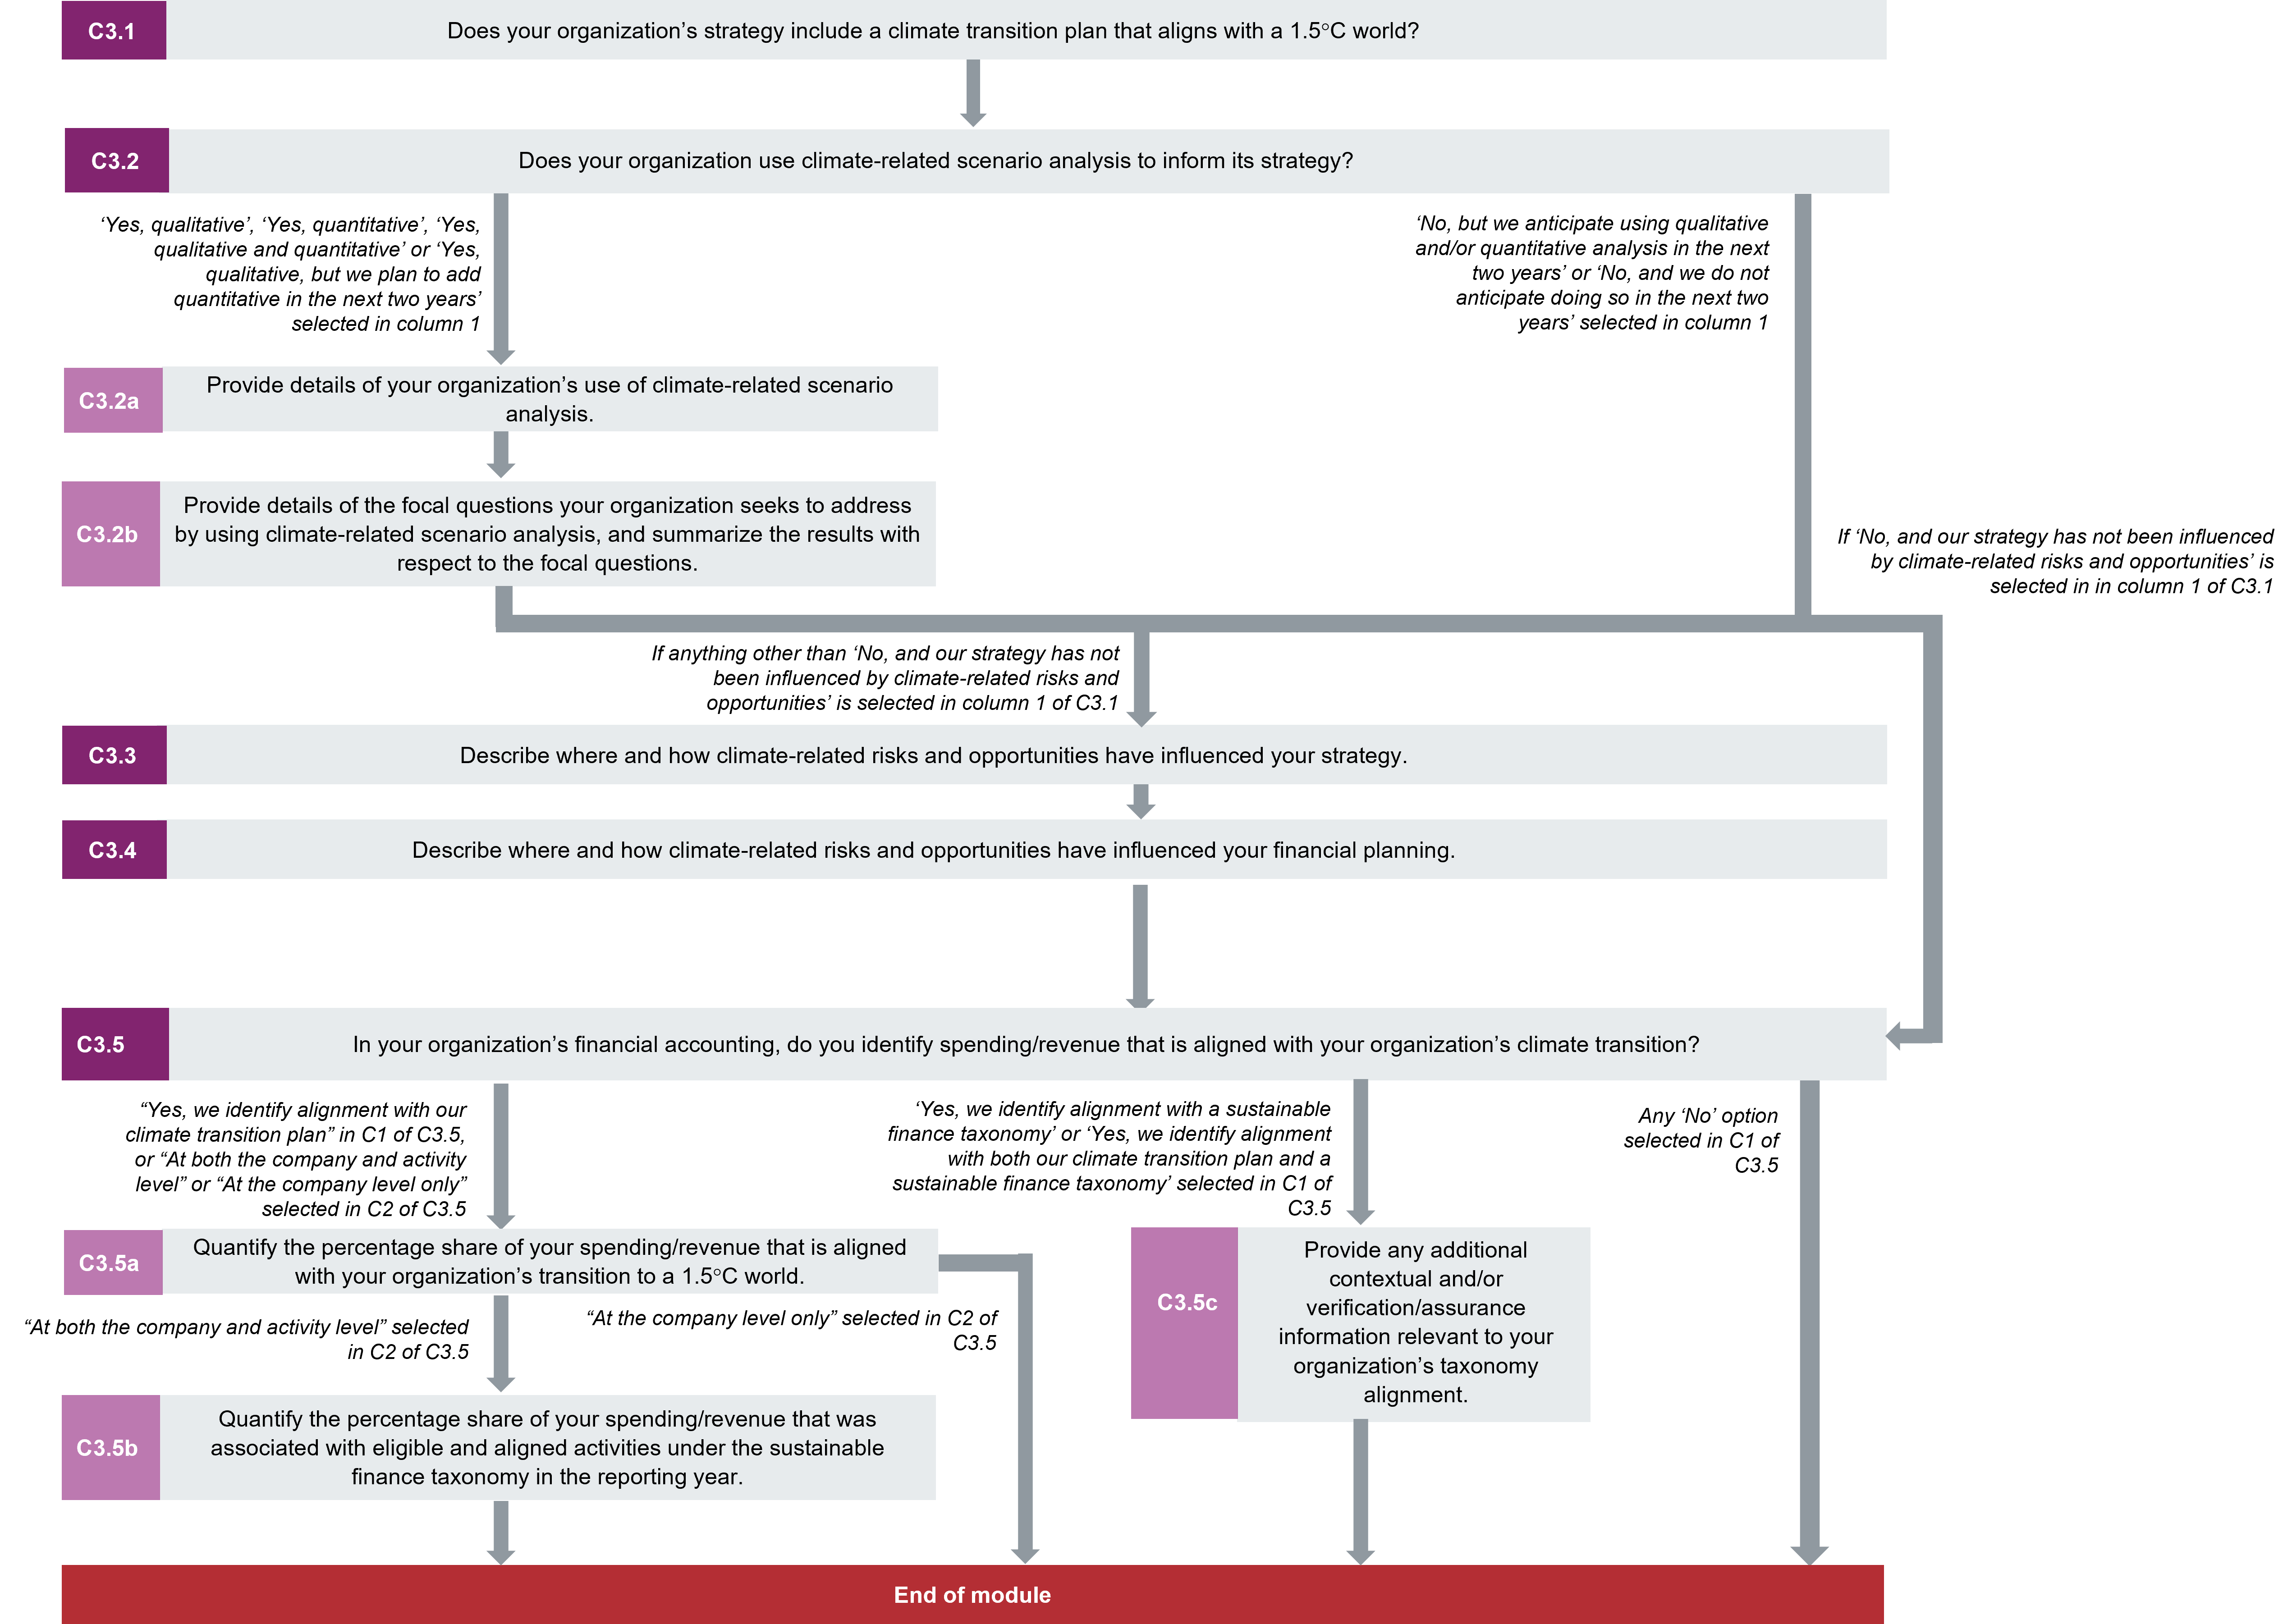
Business strategy
(C3.1) Does your organization’s strategy include a climate transition plan that aligns with a 1.5°C world?
Change from last year
Minor change
Rationale
Developing a climate transition plan provides certainty to data users that a company is aligning to the long-term climate goals and that its business model will continue to be relevant in a net-zero carbon economy. Collecting feedback on the climate transition plan allows shareholders to review and raise resolutions related to progress. This question allows companies to demonstrate transparency on their climate transition plans and associated feedback mechanisms.
Connection to other frameworks
SDG
Goal 13: Climate action
TCFD
Strategy recommended disclosure b) Describe the impact of climate-related risks and opportunities on the organization’s businesses, strategy, and financial planning.
S&P Global Corporate Sustainability Assessment
TCFD Disclosure
NZAM (FS Only)
Commitment 10
Response options
Please complete the following table:
| Climate transition plan | Publicly available climate transition plan | Mechanism by which feedback is collected from shareholders on your climate transition plan | Description of feedback mechanism | Frequency of feedback collection | Attach any relevant documents which detail your climate transition plan (optional) | Explain why your organization does not have a climate transition plan that aligns with a 1.5°C world and any plans to develop one in the future | Explain why climate-related risks and opportunities have not influenced your strategy |
|---|
| Select from:
- Yes, we have a climate transition plan which aligns with a 1.5°C world
- No, but our strategy has been influenced by climate-related risks and opportunities, and we are developing a climate transition plan within two years
- No, our strategy has been influenced by climate-related risks and opportunities, but we do not plan to develop a climate transition plan within two years
- No, and our strategy has not been influenced by climate-related risks and opportunities
| Select from:
| Select from:
- Our climate transition plan is voted on at Annual General Meetings (AGMs)
- We have a different feedback mechanism in place
- Our climate transition plan is voted on at AGMs and we also have an additional feedback mechanism in place
- We do not have a feedback mechanism in place, but we plan to introduce one within the next two years
- We do not have a feedback mechanism in place, and we do not plan to introduce one within the next two years
- Not applicable as our organization does not have shareholders
| Text field [maximum 2,500 characters] | Select from:
- More frequently than annually
- Annually
- Less frequently than annually
| [Functionality that allows for several attachments] | Text field [maximum 2,500 characters] | Text field [maximum 2,500 characters] |
Requested content
General
- Note for financial services sector companies: Questions C-FS14.3 and C-FS14.3a ask about actions to align your portfolio with a 1.5°C world, and whether you assess if your clients/investees' business strategies are aligned with a 1.5°C world.
Climate transition plan (column 1)
- You should select “Yes, we have a climate transition plan which aligns with a 1.5°C world” if you have developed a plan for how to transition your company to a business model compatible with the level of decarbonization required to keep global temperature increase to 1.5°C compared to pre-industrial temperatures. See “Explanation of Terms” for more information. If you select this option, you will be asked to provide further details on your climate transition plan in subsequent columns.
- You should select “No, but our strategy has been influenced by climate-related risks and opportunities, and we are developing a climate transition plan within two years” if climate-related risks and opportunities have already influenced your strategy and/or financial planning and you either:
- have not developed a climate transition plan but intend to develop one which aligns with a 1.5°C world within two years; or
- have developed a climate transition plan which does not yet align with a 1.5°C world (as per the definition in “Explanation of terms”) and intend to align it within two years.
- If you select “No, and our strategy has not been influenced by climate-related risks and opportunities”, you will have the opportunity to explain further in column 8 “Explain why climate-related risks and opportunities have not influenced your strategy”.
Publicly available climate transition plan (column 2)
- This column is only presented if “Yes, we have a climate transition plan…” is selected in column 1.
Mechanism by which feedback is collected from shareholders on your climate transition plan (column 3)
- This column is only presented if “Yes, we have a climate transition plan…” is selected in column 1.
- You should select “Our climate transition plan is voted on at Annual General Meetings” if you hold AGMs (as defined in the Explanation of Terms) during which shareholders vote on your organization’s climate transition plan. Note that this option is applicable even if your climate transition plan is already in progress, as it should be continually adjusted and voted on by shareholders (rather than a one-time sign-off). Furthermore, shareholders should be given the opportunity to provide feedback on progress made against your climate transition plan.
- You should select “We have a different feedback mechanism in place” if your climate transition plan is not voted on at AGMs, but there is another way shareholders can provide feedback on the contents and progress of your climate transition plan.
- You should select “Not applicable as our organization does not have shareholders” if, for example, your organization is privately held.
Description of feedback mechanism (column 4)
- This column is only presented if “We have a different feedback mechanism in place” or “Our climate transition plan is voted on at AGMs and we also have an additional feedback mechanism in place” is selected in column 3.
- Briefly describe the process shareholders use to provide feedback on the contents and progress of your climate transition plan. You may also provide any additional information to clarify your selection in column 3, for example, why you do not hold AGMs, or why you have more than one feedback mechanism in place.
Frequency of feedback collection (column 5)
- This column is only presented if “We have a different feedback mechanism in place” or “Our climate transition plan is voted on at AGMs and we also have an additional feedback mechanism in place” is selected in column 3.
Attach any relevant documents which detail your climate transition plan (optional) (column 6)
- This column is only presented if “Yes, we have a climate transition plan…” is selected in column 1.
- You may attach one or more documents which include your climate transition plan e.g., your annual report, your sustainability report, and/or a separate climate transition plan document.
- Note that CDP considers a credible climate transition plan to be succinctly integrated into an organization’s existing mainstream filings. Please refer to the CDP Climate Transition Plan technical note for more details.
Explain why your organization does not have a climate transition plan that aligns with a 1.5°C world and any plans to develop one in the future (column 7)
- This column is only presented if “No, but our strategy has been influenced by climate-related risks and opportunities, and we are developing a climate transition plan within two years” or “No, our strategy has been influenced by climate-related risks and opportunities, but we do not plan to develop a climate transition plan within two years” is selected in column 1.
- Explain why you have not developed a climate transition plan, or why your climate transition plan is not aligned with a 1.5°C world (as per the definition in “Explanation of terms”).
Explain why climate-related risks and opportunities have not influenced your strategy (column 8)
- This column is only presented if “No, and our strategy has not been influenced by climate-related risks and opportunities” is selected in column 1.
- Your answer should be company-specific and include:
- Why climate-related risks and opportunities have not influenced your business strategy and/or financial planning; and
- Whether you expect them to in the future. For example, climate change may have little effect on your business because of the nature of your goods/services. In that case, please give as complete an explanation as possible.
- [Oil and gas only] Discuss whether you have considered integrating regulatory and physical climate change risks into your business strategy, investment decisions and risk management. You should also discuss whether you have considered the diversification of your portfolio into lower-carbon and non-fossil fuel products (e.g. natural gas, biofuels, renewable energy), and development of carbon capture and sequestration technology. If relevant, provide the methodology used for any integration of future carbon prices into your hydrocarbon exploration strategy and investment decisions, and the assumptions used. Where possible, provide illustrative examples of the assumptions made in specific investment decisions.
- [Electric utilities only] Discuss any considerations to incorporate renewable energy, carbon capture & sequestration, cleaner coal technologies and energy storage into your strategy.
- [Transport OEMs only] Discuss whether you have considered the impact of climate-related issues on your strategy for your products at group level and, where relevant, for specific markets, including the impact of existing regulatory drivers. Discuss expansion into hybrid/fully electric vehicles and fuel cell technology, if relevant.
Explanation of terms
- Climate transition plan: a time-bound action plan that clearly outlines how an organization will achieve its strategy to pivot its existing assets, operations, and entire business model towards a trajectory that aligns with the latest and most ambitious climate science recommendations, i.e., halving greenhouse gas (GHG) emissions by 2030 and reaching net-zero by 2050 at the latest, thereby limiting global warming to 1.5 degrees Celsius. Please refer to the CDP Climate Transition Plan technical note for more details.
- Strategy: In line with TCFD recommendations, refers to an organization’s desired future state. An organization’s strategy establishes a foundation against which it can monitor and measure its progress in reaching that desired state. Strategy formulation generally involves establishing the purpose and scope of the organization’s activities and the nature of its businesses, taking into account the risks and opportunities it faces and the environment in which it operates.
- Financial planning: In line with TCFD recommendations, refers to an organization’s consideration of how it will achieve and fund its objectives and strategic goals. Financial planning allows organizations to assess future financial positions and determine how resources can be utilized in pursuit of short- and long-term objectives. As part of financial planning, organizations often create “financial plans” that outline the specific actions, assets, and resources (including capital) necessary to achieve these objectives over a 1-5 year period. However, financial planning is broader than the development of a financial plan as it includes long-term capital allocation and other considerations that may extend beyond the typical 3-5 year financial plan (e.g., investment, research and development, manufacturing, and markets).
- Annual General Meeting (AGM): (or annual shareholder meeting) is a yearly gathering between the shareholders of a company and its board of directors. It is primarily held to enable shareholders to vote on company issues, including the selection of the company's board of directors.
- Alignment with a 1.5°C world: refers to the Paris Agreement long-term temperature goal, as expressed in relevant IPCC reports, in particular the IPCC Sixth Assessment Report (AR6) and the IPCC Special Report on Global Warming of 1.5°C (SR1.5). According to the Science-based Targets initiative, aligning with a 1.5°C world currently means reducing Scope 1, 2 and 3 emissions to zero or close to zero and neutralizing any residual emissions by 2050 at the latest.
(C3.2) Does your organization use climate-related scenario analysis to inform its strategy?
Change from last year
No change
Rationale
Your disclosure to this question provides data users with an indication of the extent to which your company is considering a range of possible and probable futures when considering climate-related challenges and opportunities, in line with best practices in corporate environmental management.
Connection to other frameworks
SDG
Goal 13: Climate action
TCFD
Strategy recommended disclosure c) Describe the resilience of the organization’s strategy, taking into consideration different climate related scenarios, including a 2°C or lower scenario.
S&P Global Corporate Sustainability Assessment
Climate Risk Assessment - Physical Risks
Climate Risk Assessment - Transition Risks
TCFD Disclosure
Response options
Complete the following table:
| Use of climate-related scenario analysis to inform strategy | Primary reason why your organization does not use climate-related scenario analysis to inform its strategy | Explain why your organization does not use climate-related scenario analysis to inform its strategy and any plans to use it in the future |
|---|
Select from:
- Yes, qualitative
- Yes, quantitative
- Yes, qualitative and quantitative
- Yes, qualitative, but we plan to add quantitative in the next two years
- No, but we anticipate using qualitative and/or quantitative analysis in the next two years
- No, and we do not anticipate doing so in the next two years
| Select from:
- Important but not an immediate priority
- Judged to be unimportant, explanation provided
- Lack of internal resources
- No instruction from management
- Other, please specify
| [Text field, 2,500 characters] |
Requested content
General
- Select whether your organization uses climate-related scenario analysis to inform its business strategy, and if yes, the type of scenario analysis you use. See “Explanation of terms” for more details on qualitative and quantitative scenario analysis.
Primary reason why your organization does not use climate-related scenario analysis to inform its strategy (column 2)
- This column is only presented if “No, but we anticipate using qualitative and/or quantitative analysis in the next two years” or “No, and we do not anticipate doing so in the next two years” is selected in column 1.
- Select the reason that best describes why your organization does not use climate-related scenario analysis to inform your strategy.
- If more than one reason applies to your organization, select the reason which is most relevant and elaborate on the other reason(s) in column 3.
Explain why your organization does not use climate-related scenario analysis to inform its strategy and any plans to use it in the future (column 3)
- This column is only presented if “No, but we anticipate using qualitative and/or quantitative analysis in the next two years” or “No, and we do not anticipate doing so in the next two years” is selected in column 1.
- Provide a company-specific explanation of why you do not use climate-related scenario analysis to inform your strategy and outline any plans to do so in the future.
- If you selected “Judged to be unimportant, explanation provided” in column 2, explain the criteria used to decide that climate-related scenario analysis is not important for your organization.
- If you selected “Lack of internal resources”, specify whether this relates to lack of internal expertise, data availability, funds to outsource the analysis or other resources.
Explanation of terms
- Scenario analysis: A scenario describes a potential path of development that will lead to a particular outcome or goal. Scenario analysis is the process of highlighting central elements of a possible future and drawing attention to key factors (or critical uncertainties). It is a tool to enhance critical strategic thinking by challenging “business-as-usual” assumptions, and to explore alternatives based on their relative impact and likelihood of occurrence. Scenarios are not forecasts or predictions, but tools to describe potential pathways that lead to a particular outcome or goal.
- Qualitative scenarios: A high level, narrative approach to scenario analysis, suitable for organizations familiarizing themselves with the process. Qualitative scenario analysis explores relationships and trends for which little or no numerical data is available.
- Quantitative scenarios: A more detailed method for conducting scenario analysis, with greater rigor and sophistication in the use of data sets and quantitative models which may warrant further analysis. Quantitative scenario analysis can be used to assess measurable trends and relationships using models and other analytical techniques.
Additional information
Industry examples of scenario analysis - Shell, BP, Mercer, BHP Billiton, BIER’s Future Scenarios Toolkit
(C3.2a) Provide details of your organization’s use of climate-related scenario analysis.
Question dependencies
This question only appears if you select “Yes, qualitative”, “Yes, quantitative”, “Yes, qualitative and quantitative” or “Yes, qualitative, but we plan to add quantitative in the next two years” in response to C3.2.
Change from last year
Minor change
Rationale
Scenario analysis as a planning tool is a recommended practice for businesses preparing for possible futures. Investors are interested in understanding how companies use this planning tool to guide climate-related strategy, and specifically which scenarios different organizations utilize in their planning process.
Connection to other frameworks
SDG
Goal 13: Climate action
TCFD
Strategy recommended disclosure c) Describe the resilience of the organization’s strategy, taking into consideration different climate related scenarios, including a 2°C or lower scenario.
S&P Global Corporate Sustainability Assessment
Climate Risk Assessment - Physical Risks
Climate Risk Assessment - Transition Risks
TCFD Disclosure
Response options
Please complete the following table. You are able to add rows by using the “Add Row” button at the bottom of the table.
| Climate-related scenario
|
Scenario analysis coverage
|
Temperature alignment of scenario
|
Parameters, assumptions, analytical choices
|
Select from:
Transition scenarios
- IEA NZE 2050
- IEA B2DS
- IEA 2DS
- IEA 450
- IEA SDS
- IEA APS
- IEA STEPS (previously IEA NPS)
- IEA CPS
- Greenpeace
- DDP
- IRENA
- BNEF NEO
- NGFS scenarios framework [Financial Services only]
- Customized publicly available transition scenario
- Bespoke transition scenario
Physical climate scenarios
- RCP 1.9
- RCP 2.6
- RCP 3.4
- RCP 4.5
- RCP 6.0
- RCP 7.0
- RCP 8.5
- Customized publicly available physical scenario
- Bespoke physical scenario
|
Select from:
- Company-wide
- Business division
- Business activity
- Facility
- Country/area
- Product-level
- Portfolio [FS only]
- Other, please specify
|
Select from:
- 1.5ºC
- 1.6ºC – 2ºC
- 2.1ºC - 3ºC
- 3.1ºC - 4ºC
- 4.1ºC and above
- Unknown
|
Text field [maximum 2,500 characters]
|
[Add Row]
Requested content
General
- As recommended by TCFD, scenarios should be sufficiently diverse to allow challenging “what-if” analyses and capture a wide range of insights about uncertain futures. In assessing transition risks, a company should consider using or developing a 1.5°C scenario. In assessing physical risks, a company should use the current GHG pathway based on government policies currently in place, which according to latest estimates from the Climate Action Tracker would result in warming of about 2.7°C above pre-industrial levels. 2.7°C is the median of the low and high ends of current policy projections.
- Companies using customized or bespoke scenarios should have a robust and accountable process to ensure that the scenarios used are objective and diverse, and should transparently disclose this process and the content of the scenarios in this question.
Climate-related scenario (column 1)
- Add a row for each scenario used in your scenario analysis.
- Only companies with financial services as their primary sector should select the “NGFS scenarios framework” dropdown. All other companies using the NGFS scenarios framework should select “Customized publicly available transition scenario”.
Scenario analysis coverage (column 2)
- The TCFD Guidance on Scenario Analysis recommends that scenario analysis should encompass the whole company. Note that “company” refers collectively to all the companies, businesses, organizations, other entities or groups that fall within your definition of the reporting boundary.
- If the scenario analysis does not apply to the whole company, select the option that best describes the coverage of the scenario, and provide further details in column 4 “Parameters, assumptions, analytical choices”.
Temperature alignment of scenario (column 3)
- This column is only presented if “Customized publicly available physical scenario”, “Customized publicly available transition scenario”, “Bespoke physical scenario”, or “Bespoke transition scenario” is selected in column 1.
Parameters, assumptions, analytical choices (column 4)
- Provide details on how the selected scenario was identified, with reference to the parameters, assumptions and analytical methods used:
- Parameters refer to measurable factors built into the scenario that may have a material impact on your business performance, such as discount rate, GDP, and other macro-economic or demographic variables.
- Assumptions refer to assumptions made about how the parameters are likely to develop over the scenario’s timeframe, such as the timing of policy changes (e.g., carbon prices) or the development of market prices of key commodities/products.
- Analytical choices refer to the time horizons, data sources and models used, such as any SSPs (Shared Socioeconomic Pathways) used in conjunction with your scenario.
- Indicate in your response whether your analysis using this scenario was quantitative or qualitative.
Note for financial services sector companies:
- State if your organization uses climate-related scenario analysis to understand the impact of climate-related issues on lending, financial intermediary, investment and/or insurance underwriting activities, in addition to operational activities.
- Note that “Company-wide” in column 2 refers to the reporting boundary as disclosed in question C0.5 in the introduction module. Financial services sector organizations using scenario analysis on their portfolios should select “Portfolio [FS only]”, even when the scenario analysis covers all financial activities and portfolios.
- Both physical and transition pathway risks should be considered in your scenario analysis.
- Banks:
- Banks are encouraged to use the Network for Greening the Financial System (NGFS) scenarios framework.
- Insurance companies:
- Insurance companies that perform climate-related scenario analysis on their underwriting activities should provide the following information:
- Information on the time frames used for the climate-related scenarios, including short-, medium-, and long-term milestone; and
- Companies with substantial exposure to weather-related perils should consider a greater than 2°C scenario to account for physical effects of climate change.
Explanation of terms
- 1.5°C or lower scenario: A core element of the TCFD’s Strategy recommendation c) “Describe the resilience of the organization’s strategy, taking into consideration different climate-related scenarios, including a 2°C or lower scenario”. As noted on page 26 of The TCFD Guidance on Scenario Analysis for Non-Financial Companies, the TCFD now recommends that in assessing transition risks, companies should consider using or developing a 1.5°C scenario for the “2°C or lower scenario”, stating that “a 1.5°C scenario would provide stronger diversity in assumptions about future policies and technologies. A 1.5°C scenario also aligns with the latest scientific research from the IPCC, the growing momentum of pledges to limit emissions to net-zero by 2050, and the spirit of the Paris Agreement, demonstrating a company’s alignment to recognized temperature targets.”
- Publicly available scenarios: Taken from TCFD recommendations, “Publicly available scenarios” refer to scenarios which are:
- used/referenced and issued by an independent body;
- wherever possible, supported by publicly available datasets;
- updated on a regular basis; and
- linked to functional tools (e.g., visualizers, calculators, and mapping tools) that can be applied by organizations.
- IEA NZE 2050: IEA’s Net Zero by 2050 scenario presents a roadmap for the energy sector to transition to a net zero energy system by 2050. It assumes that advanced economies will reach net zero in advance of 2050 and sets out an emissions trajectory consistent with a 50% chance of limiting the global temperature rise to 1.5°C without a temperature overshoot.
- IEA B2DS: IEA’s Beyond 2°C Scenario (B2DS) sets out a rapid decarbonization pathway in line with international policy goals. The B2DS looks at how far known clean energy technologies could go if pushed to practical limits, in line with countries’ ambitious aspirations in the Paris Agreement. In this scenario, the energy sector reaches carbon neutrality by 2060 to limit future temperature increases to 1.75°C by 2100. This pathway implies that all available policy levers are activated throughout the outlook period in every sector worldwide, requiring unprecedented policy action as well as effort and engagement from all stakeholders.
- IEA 2DS: IEA’s 2°C Scenario is built on a projected warming limit of 2°C and is part of the annual publication “Energy Technology Perspectives”, providing scenario analysis based on the development of lower carbon technology and its deployment in various sectors. The IEA ETP 2DS sets out an energy system development pathway and an emissions trajectory consistent with at least a 50% chance of limiting the average global temperature rise to 2°C. It sets the target of cutting CO2 emissions by almost 60% by 2050 (compared with 2013), followed by continued decline after 2050 until carbon neutrality is reached. It also identifies changes that help ensure a secure and affordable energy system in the long run, while emphasizing that transforming the energy sector is vital, but not enough on its own.
- IEA 450: IEA’s World Energy Outlook 450 scenario is expressed as realizing a 50% chance of limiting warming to a 2°C rise by 2100 (originally based upon a projected warming limit of 2°C through limiting the concentration of GHG’s to around 450ppm of CO2 equivalent) and offers steps by which that goal might be achieved. It references many separate measures which are required to reduce energy-related emissions from 2015 to 2040, including stronger deployment of technologies that are familiar and available at a commercial scale today, delivering close to 60% of the emissions reductions. Technologies referenced include the building of significant additional nuclear capacity and rapid CCS expansion.
- IEA SDS: IEA’s Sustainable Development Scenario (SDS) is compatible with the Paris Agreement’s less ambitious “well-below 2°C” goal. It assumes all energy-related SDGs and all current net-zero pledges are achieved, with advanced economies reaching net zero emissions by 2050, China by 2060 and all others by 2070 at the latest. It has a 50% probability of limiting global temperature rise to 1.65°C, assuming no extensive net negative emissions. With some net negative emissions after 2070, temperature rise could be reduced to 1.5°C by 2100.
- IEA APS: IEA’s Announced Pledges Scenario (APS) takes account of all climate commitments made by governments around the world including Nationally Determined Contributions (NDCs) as well as longer-term net-zero targets and assumes they will be met in full and on time. The global emissions difference between the APS and the NZE represents the “ambition gap” that needs to be closed for governments to achieve the goals agreed in the 2015 Paris Agreement.
- IEA STEPS (previously IEA NPS): IEA’s Stated Policies Scenario (STEPS) does not take for granted that governments will meet all announced goals. It instead looks at where the energy system might go without additional policy implementation, looking at existing policies and measures and those under development. The global emissions difference between the STEPS and the APS represents the “implementation gap” that needs to be closed for governments to achieve their announced decarbonization targets.
- IEA CPS: IEA’s Current Policies Scenario (CPS) includes only existing energy policies. This default setting for the energy system is a benchmark against which the impact of “new” policies can be measured.
- Greenpeace: Refers to the Advanced Energy [R]evolution scenario. Based on Greenpeace’s basic Energy [R]evolution scenario, which includes significant efforts to exploit opportunities for energy efficiency, along with large-scale integration of renewables, biofuels, and hydrogen into the energy mix, the Advanced Energy [R]evolution scenario sets out an ambitions pathway towards a fully decarbonized energy system by 2050 through much stronger efforts to move energy towards a 100% renewable energy supply. Consumption pathways remain similar to the basic scenario, but faster introduction of technologies leads to complete decarbonization. The IEA’s Current Policies Scenario serves as the reference point in the development of Greenpeace’s Advanced Energy Revolution scenario.
- DDP: The Deep Decarbonization Pathways (DDP) initiative builds and brings to the public debate realistic decarbonization pathways to 2050. These are designed to deeply reduce carbon emissions while satisfying socio-economic objectives. The pathways are developed country/area by country/area, considering in each case the specific context and highlighting key drivers of the transformation and their potential effects.
- IRENA: IRENA’s REmap determines the potential for countries, regions and the world to scale up renewables in order to ensure an affordable and sustainable energy future. REmap assesses worldwide renewable energy potential assembled from the bottom-up, starting with country/area analyses – in collaboration with country/area experts, and then aggregating these results to arrive at a global picture. REmap accounts for renewable power technologies, but also considers technology options in heating, cooling and transport. In determining the potential to scale up renewables, REmap focuses on possible technologies pathways and assesses numerous other metrics, including: technology, sector and system costs; investment needs; externalities relating to air pollution and climate; CO2 emissions; and economic indicators such as employment and economic growth. Based on these country/area driven results, REmap provides insights to policy and decision makers for areas in which action is needed.
- BNEF NEO: Bloomberg New Energy Finance’s (BNEF) New Energy Outlook (NEO) focusses on the annual long-term economic analysis of the world’s power sector out to 2050. 2021’s edition presents three scenarios that are aligned with the Paris Agreement, achieving net-zero emissions in 2050. The Green Scenario is a net-zero pathway where so-called ‘green hydrogen’ complements greater electricity use, recycling and bioenergy. The Grey Scenario assumes greater use of electricity and renewable power is complemented by carbon capture and storage technology and allows for the continued use of some fossil fuels. The Red Scenario assumes smaller, modular nuclear is deployed to complement wind, solar and battery technology in the power sector, with dedicated nuclear plants manufacturing so-called “red hydrogen”.
- NGFS scenarios framework: To facilitate the uptake of climate scenario analysis by central banks, financial regulators, and the larger financial community, the NGFS developed a global set of scenarios and published guidance on conducting such analysis.
- RCP 1.9: Representative Concentration Pathway (RCP) 1.9 is the IPCC’s lowest emission pathway that focuses on limiting warming to below 1.5°C by the end of the century, which is the aspirational goal of the Paris Agreement. RCPs provide a quantitative description of atmospheric pollutions over time, as well as radiative forces in 2100. In RCP 1.9, radiative forcing is limited to no more than 1.9 W/m2 above pre-industrial levels.
- RCP 2.6: In RCP 2.6, radiative forcing peaks at 3.1 W/m2 before returning to 2.6 W/m2 by 2100, achieved through; a shift to renewable energy sources; CO2 remaining at today’s level until 2020, then decline and becoming negative in 2100; and CO2 concentrations peaking by 2050, followed by a modest decline to around 400 ppm by 2100.
- RCP 3.4: RCP 3.4 represents the IPCC’s intermediate pathway between the very stringent RCP2.6 and the less stringent mitigation efforts associated with RCP4.5.
- RCP 4.5: RCP 4.5 represents one of IPCC’s intermediate stabilization pathways in which radiative forcing is stabilized at approximately 4.5 W/m2 after 2100.
- RCP 6.0: RCP 6.0 represents one of IPCC’s intermediate stabilization pathways in which radiative forcing is stabilized at approximately 6.0 W/m2 after 2100.
- RCP 7.0: RCP 7.0 consists of a baseline outcome rather than a mitigation target, and represents the medium-to-high end of the range of future emissions and warming resulting from no additional climate policy.
- RCP 8.5: RCP 8.5 represents the IPCC’s high-end pathway in which radiative forcing reaches greater than 8.5 W/m2 by 2100, and continues to rise for some time afterwards.
- Transition risks
- Current and emerging regulation – policy developments that attempt to constrain actions that contribute to the adverse effects of climate change or policy developments that seek to promote adaptation to climate change;
- Technology – all risks associated with technological improvements or innovations that support the transition to a lower-carbon, energy-efficient economic system;
- Legal – all climate-related litigation claims;
- Market – all shifts in supply and demand for certain commodities, products, and services;
- Reputation – all risks tied to changing customer or community perceptions of an organization’s contribution to or detraction from the transition to a lower-carbon economy.
- Physical risks
- Acute – risks that are event-driven, including increased severity of extreme weather events, such as cyclones, hurricanes, or floods;
- Chronic – longer-term shifts in climate patterns (e.g., sustained higher temperatures) that may cause sea level rise or chronic heat waves.
Additional information
Exploratory vs. Normative Scenario analysis
The TCFD Guidance on Scenario Analysis for Non-Financial Companies identifies two main types of scenarios: (1) exploratory scenarios used to explore a range of different possible futures and (2) normative scenarios used to plan for a preferred future. The essential difference is that with normative scenarios, scenario analysis begins with a desired future outcome and works backward to inform decisions on what is needed to achieve that outcome. With exploratory scenarios, the scenario analysis instead begins from the present, and then describes a diverse set of plausible future states.
Normative scenarios are typically used for assessment and setting of specific targets and implementation plans, while exploratory scenarios are used to assess potential climate-related risks and uncertainties, and test the resiliency of various strategies to a wide range of future conditions. The TCFD recommends the use of an exploratory approach.
IEA Energy Technology Perspectives (ETP)
International Energy Agency (IEA)’s comprehensive publication on energy technology focuses on the opportunities and challenges of scaling and accelerating the deployment of clean energy technologies. Additional information on this publication can be found here.
Critical uncertainties
Identified using a process of scaling potential impacts and uncertainties, those meeting high for both impact and uncertainty should be considered ‘critical uncertainties’ and the basis for the development of scenarios. A common process for identifying critical uncertainties is the development of an impact/uncertainty grid. Further information on critical uncertainties can be found in CDP’s technical note on Scenario Analysis.
(C3.2b) Provide details of the focal questions your organization seeks to address by using climate-related scenario analysis, and summarize the results with respect to these questions.
Question dependencies
This question only appears if you select “Yes, qualitative”, “Yes, quantitative”, “Yes, qualitative and quantitative” or “Yes, qualitative, but we plan to add quantitative in the next two years” in response to C3.2.
Change from last year
Additional guidance
Rationale
Scenario analysis should be based on concise focal questions that provide direction for the analysis, and the results inform an organization’s decisions and actions. Providing this information to CDP data users gives insight into why your organization is using scenario analysis and how the results have impacted your organization’s strategy.
Connection to other frameworks
SDG
Goal 13: Climate action.
TCFD
Strategy recommended disclosure b) Describe the impact of climate-related risks and opportunities on the organization’s businesses, strategy, and financial planning.
Strategy recommended disclosure c) Describe the resilience of the organization’s strategy, taking into consideration different climate related scenarios, including a 2°C or lower scenario.
S&P Global Corporate Sustainability Assessment
Climate Risk Assessment - Physical Risks
Climate Risk Assessment - Transition Risks
TCFD Disclosure
Response options
Please complete the following table:
| Focal questions | Results of the climate-related scenario analysis with respect to the focal questions |
|---|
Text field [maximum 3,000 characters]
| Text field [maximum 3,000 characters] |
Requested content
General
- In this question you should provide a single response based on all scenarios disclosed in C3.2a.
Focal questions (column 1)
- List the focal question(s) that provided direction to your climate-related scenario analysis. See “Additional information” for further guidance on focal questions.
- Provide a rationale for selecting the scenarios disclosed in C3.2a to address the focal question(s).
Results of the climate-related scenario analysis with respect to the focal questions (column 2)
- Provide a company-specific summary of the results of the scenario analysis, and how the results have informed your decisions and actions, with respect to the focal question(s).
- You may also describe how the results of the climate-related scenario analysis have influenced your business strategy and financial planning more broadly.
Note for energy sectors:
- Discuss in particular whether your focal questions address the exposure of current investments in new reserves and/or assets to the risk of lower demand and stranded assets; how current and future capital expenditure may be affected by short-to-long term risk of stranded assets, and what probability/likelihood you assign to that risk. You should also discuss how you have considered your organization’s energy outlook in the scenario analysis, and whether you tested the flexibility of your strategy to adjust to significant changes in the demand for your products.
Note for financial services sector companies:
- Banks:
- Banks should consider providing a discussion of how climate-related scenarios are used, such as to inform credit and exclusion policies.
- Asset Managers/Asset owners:
- Asset managers should consider describing how they use climate-related scenarios, for example to better understand how climate-related issues inform relevant products or investment strategies.
- Asset owners should consider providing a discussion of how climate-related scenarios are used, such as to inform investments in specific assets.
- Insurance companies:
- Insurance companies should consider describing how they use climate-related scenarios, for example to inform insurance premiums and capital requirements.
Explanation of terms
- Focal question(s): The critical questions or potential decisions that a company seeks to address.
Additional information
Problem Definition: “Define the focal question(s)” – from section 2.2, step 2 of the TCFD Guidance on Scenario Analysis:
“This step is important because focal questions are a key anchor point for many of the decisions made during scenario development and analysis. In thinking about focal questions, a company is seeking to flesh out the focus of scenario analysis around the broad question of “how could climate change plausibly affect our [company, business unit, product, commodity input, customer segment], what should we do, and when?” Some questions a company should consider are as follows:
- What possible future developments need to be probed?
- What variables are needed to support decision-making?
- What forces and developments have the greatest ability to shape future performance?”
Exploratory vs. Normative Scenario analysis
The TCFD Guidance on Scenario Analysis for Non-Financial Companies identifies two main types of scenarios: (1) exploratory scenarios used to explore a range of different possible futures and (2) normative scenarios used to plan for a preferred future. The essential difference is that with normative scenarios, scenario analysis begins with a desired future outcome and works backward to inform decisions on what is needed to achieve that outcome. With exploratory scenarios, the scenario analysis instead begins from the present, and then describes a diverse set of plausible future states.
Normative scenarios are typically used for assessment and setting of specific targets and implementation plans, while exploratory scenarios are used to assess potential climate-related risks and uncertainties, and test the resiliency of various strategies to a wide range of future conditions. The TCFD recommends the use of an exploratory approach.
(C3.3) Describe where and how climate-related risks and opportunities have influenced your strategy.
Question dependencies
This question only appears if you select any option except “No, and our strategy has not been influenced by climate-related risks and opportunities” in response to column 1 of C3.1.
Change from last year
Modified guidance for FS only
Rationale
Investors and data users are interested to know how climate-related risks and opportunities may have affected organizations’ strategies. Answers to this question may be used to inform expectations about the future performance of an organization and on how resilient its strategy is to climate-related risks and opportunities.
Connection to other frameworks
SDG
Goal 12: Responsible consumption and production
Goal 13: Climate action
TCFD
Strategy recommended disclosure b) Describe the impact of climate-related risks and opportunities on the organization’s businesses, strategy, and financial planning.
S&P Global Corporate Sustainability Assessment
Climate Strategy Impacts
TCFD Disclosure
Response options
Please complete the following table:
| Business area
|
Have climate-related risks and opportunities influenced your strategy in this area?
|
Description of influence
|
|
Products and services
|
Select from:
- Yes
- No
- Evaluation in progress
- Not evaluated
|
Text field [maximum 2,400 characters]
|
|
Supply chain and/or value chain
|
|
|
|
Investment in R&D
|
|
|
|
Operations
|
|
|
Requested content
General
- Each row in the table corresponds to a possible area of impact in a company’s business. For each row, select how climate-related risks and opportunities have affected your strategy in this area.
- This question is intended to focus on the group business strategy – meaning the full corporate body on which you are reporting. However, if it is more appropriate, you may wish to comment on divisional (business unit) strategies. If you are responding to the request from a supply chain member, please also include information specific to your requesting member, i.e. relevant business units.
Description of influence (column 3)
- Describe how your strategy in this area has been influenced by climate-related risks and opportunities and the time horizon(s) it covers;
- Specify if this includes any climate change adaptation and mitigation activities.
- Include the most substantial strategic decision(s) in this area to date that have been influenced by the climate-related risks and opportunities;
- If a certain strategic decision was informed by the climate-related scenario analysis, please specify that.
- If your strategy in this area has not been influenced by climate-related risks and opportunities, explain why not.
- If the evaluation of influence is still in progress, include a company-specific description of the evaluation process used, and when it is expected to be completed.
Note for oil & gas companies, electric utilities, automotive and automotive component manufacturers, and companies with coal reserves:
- Please refer to the sector specific guidance for the risks and opportunities questions before answering this question.
- The guidance contains a number of issues that investors want these sectors to consider in answering the risks and opportunities questions and you may wish to draw together some of these issues in your answers to questions on the integration of climate change into business strategy.
- Please provide a complete answer to these questions on business strategy in the input fields provided. Do not cross-refer to the risks and opportunities answers in your response to this question.
Note for oil & gas sector companies:
- Discuss, if relevant, your methodology for the integration of regulatory and physical climate change risks into the company strategy, investment decisions and risk management, including the assumptions used.
- Where possible, provide illustrative examples of the assumptions made in specific investment decisions.
- You should also discuss - again if relevant - the diversification of your portfolio into lower-carbon and non-fossil fuel products (e.g. natural gas, biofuels, renewable energy) and strategy for development of carbon capture and sequestration technology, including technology areas of focus, and distinctive areas of strength your company believes it holds.
- Please give the methodology used for the integration of future carbon prices into your hydrocarbon exploration strategy and investment decisions, with the assumptions used. Where possible, provide illustrative examples of the assumptions made in specific investment decisions.
Note for electric utility sector companies:
- Discuss any work to incorporate renewable energy, carbon capture & sequestration, cleaner coal technologies and energy storage into your strategy.
Note for transport OEMs sector companies:
- Discuss the impact on your strategy for your products at group level and, where relevant, for specific markets, including any related targets for GHG emissions performance (expressed as gCO2e/unit distance) and include a reference to any regulatory drivers and the baseline against which performance is measured.
- Discuss expansion into hybrid/fully electric vehicles and fuel cell technology, if relevant.
Note for companies with coal reserves:
Note for financial services companies:
- The climate-related risks and opportunities to be considered in this question refer to lending, financial intermediary, investment and/or insurance underwriting activities of your organization, in addition to your operational activities.
- Banks:
- Describe the potential impacts of climate-related risks and opportunities on your core businesses, products and services, including:
- Information at the business division, sector or geography, credit quality and average tenor levels;
- Asset managers/Asset owners:
- Under” Supply chain and/or value chain” describe how climate-related risks and opportunities are factored into your investment strategies and investee selection.
- Also describe how each product or investment strategy may be affected by the transition to a lower-carbon economy.
- For members of the Net Zero Asset Manager initiative (NZAM)
"Products and services" apply to creating investment products under
NZAM Commitment 5, and "Supply chain and/or value chain" apply to
investment strategy/ investing in technology/ engagement strategy under NZAM
Commitment 3.
- Describe the potential impacts of
climate-related risks and opportunities on your core businesses,
products and services, including:
- Information at the business division, sector or geography levels;
- As asset owners, insurance companies
should describe how climate-related risks and opportunities are
factored into relevant investment strategies – in the business’ value
chain. This could be described from the perspective of the total fund or
investment strategy or individual investment strategies for various
asset classes.
Example response
| Business area
|
Have climate-related risks and opportunities influenced your strategy in this area?
|
Description of influence
|
| Products and services
|
Yes
|
Risks and opportunities related to the growing demand from customers for transparency, naturality, and food and drinks with low carbon footprint, (as reported in C2.3a Risk 6 and C2.4a Opportunity 8) have influenced our product-related strategy and product portfolio. In June 2019, our Board of Directors made a Global Transparency and Sustainability Pledge, committing to increasing the share of plant-based products in the portfolio, using more natural ingredients in our flagship brands such as Pantheon Peanut Butter, Red Rose Beetroot Paste, Gracious Hummus and increasing transparency on our packaging (e.g. disclosure of the presence of any synthetic or GMO ingredients on product labels). This gives consumers a greater variety of products and improved ability to choose them, while providing a high-quality product offering, benefiting the producers as well as preserving natural resources, promoting biodiversity, improving soil health and water quality, and reducing carbon emissions. We aim to have implemented changes to our products and packaging in line with the pledge by December 2020, prioritizing our consumer base in North America and Europe.
|
| Supply chain and/or value chain
|
Evaluation in progress
|
Since we source 80% of our raw materials from drought-prone India and severe water stress is increasing every year, we have started placing more emphasis on conducting risk assessments for extreme weather events. In December 2019, the Board decided to employ a team of external consultants to work on developing a supply chain transparency tool. This tool will allow us to gather important information about our supply network (including sub-tier suppliers), so that we can better assess our vulnerability to natural disasters and other risks across our global supply chain. The supply chain transparency tool is expected to be fully functional by September 2020 and will be central in informing our supply chain strategy going forward.
|
| Investment in R&D
|
No
|
Climate-related risks and opportunities have not yet influenced our R&D investment strategy, as we are initially focused on evaluating the risks and opportunities relating to our operations, supply chain and existing products and services, ensuring our business strategy is aligned in accordance with these. We expect to begin evaluating the impact of risks and opportunities on our R&D expenditures in 2020.
|
| Operations
|
Yes
|
National and sub-national jurisdictions that account for about half of the global economy now have carbon pricing systems (as disclosed in C2.3a Risk 2). This trend is on the rise and could result in increased operational costs for our company. For example, a carbon price of €32/ton would increase our operational costs to €25.1m in Europe. This has led to our Board's strategic decision to join RE100 and commit to transition to 100% renewable electricity by 2030, with an intermediary step of 40% by 2022. In 2019, 38 of our production sites in Europe ran on 100% renewable energy and we purchased 37% of our total electricity from renewable sources such as wind farms and hydropower plants (compared with 22% in 2018). As part of this strategy, all our new plants will have renewable power generation facilities on site.
|
(C3.4) Describe where and how climate-related risks and opportunities have influenced your financial planning.
Question dependencies
This question only appears if you select any option except “No, and our strategy has not been influenced by climate-related risks and opportunities” in response to column 1 of C3.1.
Change from last year
Modified guidance
Rationale
This question is seeking to understand where the identified risks and opportunities may have influenced your financial statements, and how this has been incorporated into your financial planning process.
Connection to other frameworks
TCFD
Strategy recommended disclosure b) Describe the impact of climate-related risks and opportunities on the organization’s businesses, strategy, and financial planning.
S&P Global Corporate Sustainability Assessment
Climate Strategy Impacts
TCFD Disclosure
Response options
Please complete the following table:
| Financial planning elements that have been influenced
|
Description of influence |
|
Select all that apply:
- Revenues
- Direct costs
- Indirect costs
- Capital expenditures
- Capital allocation
- Acquisitions and divestments
- Access to capital
- Assets
- Liabilities
- Provisions or general reserves [Financial services only]
- Claims reserves [Financial services only]
- None of the above
|
Text field [maximum 7,000 characters]
|
Requested content
General
- Climate-related issues can affect several important aspects of an organization’s financial position, both now and in the future. For example, climate-related issues may have implications for an organization’s capital expenditures. In turn, capital expenditures will determine the nature and amount of fixed assets, how these depreciate over time and the proportion of debt and equity to be funded on an organization’s balance sheet. Climate-related issues may also carry implications for future cash flows (operating, investing, and financing activities). This question seeks to establish whether climate-related issues have already had implications on your financial planning.
Description of influence (column 2):
- Provide details on how climate-related risks and opportunities have influenced the selected elements of your financial planning. Include a case study for at least one of the elements selected. For example, if you have disclosed substantive climate-related risks or opportunities in questions C2.3a or C2.4a, you may provide details of how the risk or opportunity has affected the financial planning element selected in column 1.
- If you have reported that your organization has a climate transition plan in C3.1, provide details of how you plan to resource the different aspects of the climate transition plan.
- Specify the time horizons this planning covers.
- If you selected “None of the above”, explain if there is another element of financial planning that has been influenced; or why climate-related risks and opportunities have not yet influenced your financial planning.
Note for financial services sector companies:
The climate-related risks and opportunities to be considered in this question refer to lending, financial intermediary, investment and/or insurance underwriting activities of your organization, in addition to your operational activities.
- Banks:
- Describe the potential financial impacts of the identified climate-related risks and opportunities on your core businesses, products and services. For example, you may do this by translating climate risk data into probability of default, total committed exposure and/or exposure at default.
- Asset managers/Asset owners:
- Where appropriate, describe how climate-related risks and opportunities may affect the financial returns of relevant products or investment strategies.
- Asset managers should also describe how each product or investment strategy might be affected by the transition to a lower-carbon economy.
- Insurance companies:
- Describe the potential financial impacts of climate-related risks and opportunities on your core businesses, products and services. For example, you may do this by translating climate risk data into probability of default and/or exposure at default.
- As asset owners, insurance companies should describe how climate-related risks and opportunities may affect the financial returns of investment strategies. This could be described from the perspective of the total fund or investment strategy or individual investment strategies for various asset classes.
Explanation of terms
- Financial planning: in line with the TCFD recommendations, refers to an organization’s consideration of how it will achieve and fund its objectives and strategic goals. Financial planning allows organizations to assess future financial positions and determine how resources can be utilized in pursuit of short- and long-term objectives. As part of financial planning, organizations often create “financial plans” that outline the specific actions, assets, and resources (including capital) necessary to achieve these objectives over a 1- 5 year period. However, financial planning is broader than the development of a financial plan as it includes long-term capital allocation and other considerations that may extend beyond the typical 3-5 year financial plan (e.g., investment, research and development, manufacturing, and markets).
- Revenue: Income arising in the course of an entity’s ordinary activities (less returns, allowances and discounts) - before deducting costs for the goods/services sold and operating expenses to arrive at profit (based on the International Financial Reporting Standard)
- Direct costs: Also known as “costs of goods or services sold”. These expenses can be attributed to the manufacture of a particular product or the provision of a particular service.
- Indirect costs: Also known as 'operating cost' or 'overheads'. This generally refers to the essential expenses incurred in order to maintain the business including wages, rent, transport, energy (electricity, fuel, etc.), maintenance, and so on. These expenses cannot be attributed to the manufacture of a particular product or the provision of a particular service - they are standard costs that apply regardless of the volume of goods produced.
- Capital allocation: refers to distributing and investing a company's financial resources in ways that will increase its efficiency, and maximize its profits. Some options for allocating capital could include returning cash to shareholders via dividends, repurchasing shares of stock, issuing a special dividend, or increasing a research and development (R&D) budget. Alternatively, the company may opt to invest in growth initiatives, which could include acquisitions and organic growth expenditures.
- Capital expenditure: Capital expenditure is a measure of the value of purchases of fixed assets such as property, buildings, an industrial plant, technology, or equipment. Put differently, CapEx is any type of expense that a company capitalizes, or shows on its balance sheet as an investment, rather than on its income statement as an expenditure.
- Acquisition: Obtaining ownership and control by one firm, in whole or in part, of another firm or business entity.
- Divestment: A process for selling assets for financial, environmental, political or social goals. In the progression to a low-carbon economy, organizations are recognizing climate-related transition and physical risks posed to minimize exposure to stranded assets (assets that have suffered unanticipated or premature write-downs, devaluations or conversion to liabilities).
- Access to capital: Cash flows from sources other than an organization’s sales and other revenues. It includes cash infusions from investors or securing lines of credit with banks and other lenders.
- Assets: Entities functioning as stores of value and over which ownership rights are enforced by institutional units, individually or collectively, and from which economic benefits may be derived by their owners by holding them, or using them, over a period of time (the economic benefits consist of primary incomes derived from the use of the asset and the value, including possible holding gains/losses, that could be realized by disposing of the asset or terminating it).
- Liabilities: An obligation which requires one unit (the debtor) to make a payment or a series of payments to the other unit (the creditor) in certain circumstances specified in a contract between them.
- Provisions or general reserves [Financial services only]: Balance sheet items representing funds set aside by the organization as assets to pay for anticipated future losses. For banks, a general provision is considered to be supplementary capital under the first Basel Accord.
- Claims reserves [Financial services only]: Balance sheet reserve specifically set aside by insurance companies to pay policyholders who have filed or are expected to file legitimate claims on their policies. Consider both reported but not settles (RBNS) and incurred but not reported (IBNR) reserves.
Example Response
| Financial planning elements that have been influenced
|
Description of influence
|
| Capital expenditures
|
In 2017 our organization introduced an internal price on carbon into our capital expenditures approval process, with the aim to redirect investments towards clean technologies, lower-carbon solutions, and renewable energy projects across our operations and supply chain. We conducted a benchmark study and decided to set the price at a relatively high level, 36€/tCO2e, to internalize the potential future cost of carbon in the long term. Returns on investments are assessed with the impact of the carbon implication. This enables management to arbitrate between different options and to choose the most virtuous and efficient ones in order to achieve our organization’s strategic goals. This is a long-term measure, and the price will be periodically reviewed and updated. As a direct result of this implemented internal price on carbon we have approved a project of installing solar panels in our factories in Spain that will reduce our demand for purchased energy by 30% in the next 5 years.
|
(C3.5) In your organization’s financial accounting, do you identify spending/revenue that is aligned with your organization’s climate transition?
Change from last year
Modified question
Rationale
Companies need to be aware of whether their spending and revenue is supporting their climate transition. Basing such an assessment on activities, projects or assets defined as sustainable by a sustainable finance taxonomy can inform progress being made on their commitment to mitigate and adapt to climate change and add credibility to it.
Ambition: Companies are aware of whether their spending and revenue are aligned with their climate transition, and/or a sustainable finance taxonomy.
Connection to other frameworks
NZAM (FS Only)
Commitment 4
Response options
Please complete the following table. *Column/row
appearance is dependent on selections in this or other questions.
| Identification of spending/revenue that is
aligned with your organization’s climate transition
|
Indicate the level at which you identify the
alignment of your spending/revenue with a sustainable finance taxonomy*
|
|
Select from:
- Yes, we identify alignment with our climate transition plan
- Yes, we identify alignment with a sustainable finance taxonomy
- Yes, we identify alignment with both our climate transition plan and a sustainable finance taxonomy
- No but we plan to in the next two years
- No, and we do not plan to in the next two years
|
Select from:
- At both the company and activity level [not shown to FS]
- At the company level only
|
Requested content
Identification of spending/revenue that is
aligned with your organization’s climate transition (column 1)
- The drop-down options presented in this
column will depend on your response to question C3.1.
- Select “Yes, we identify alignment with our climate transition plan" if, in your financial statements, you identify spending/revenue that is compatible with the level of decarbonization required to keep global temperature increase to 1.5°C compared to pre-industrial temperatures and is therefore aligned with your
organization’s climate transition plan as disclosed in C3.1. It is up to each company to determine what
is considered to be aligned with your organization’s climate transition plan,
but for example:
- Revenue derived from the sale of low-carbon products or services as defined via recognized taxonomies or methodologies.
- Spending (e.g., CAPEX or OPEX) on the implementation of emissions reduction initiatives and/or investment in new low-carbon assets or projects.
- Select “Yes, we identify alignment using a
sustainable finance taxonomy” if you identify financial information associated
with the alignment of your organization’s activities with a sustainable finance
taxonomy (e.g., the EU Taxonomy for Sustainable Activities), at the company
and/or activity level.
- Select “Yes, we identify the alignment with
both our climate transition plan and a sustainable finance taxonomy” if you are
able to provide information separately on both the alignment of your
spending/revenue with your climate transition plan, and the alignment of your
organization’s activities with a sustainable finance taxonomy. Disclosing
information on both is particularly useful where the ambition of the
sustainable finance taxonomy and your climate transition plan differs (e.g. if the
temperature goal of the taxonomy is to keep global temperatures to 2°C above
pre-industrial levels, but your climate transition plan is 1.5°C aligned).
- You will have the opportunity to provide further details in the subsequent questions.
Indicate
the level at which you identify the alignment of your spending/revenue with a
sustainable finance taxonomy (column 2)
- This column only appears if “Yes, we identify alignment with a sustainable finance taxonomy” or “Yes, we identify alignment with both our climate transition plan and a sustainable finance taxonomy” is selected in column 1.
- Select “At the company level only” if you wish
to disclose alignment against a sustainable finance taxonomy, but the taxonomy
does not require alignment information to be provided at the activity level.
For example, you should select this option if the taxonomy requires a breakdown
at project or asset level but not at activity level, or if the taxonomy
requires just an overall figure at company/group level. See “Explanation of terms” for more information.
- Non-financial services companies that wish to disclose alignment
against the EU Taxonomy for Sustainable Activities should select “At the
company and activity level”.
- Companies in the financial services sector are not presented with the option “At the company and activity level”.
- Note that as per the Disclosure Delegated Act, financial services companies are not required to report alignment against the EU Taxonomy for Sustainable Activities until January 2024.
- Financial services companies that wish to report alignment with a sustainable finance taxonomy other than the EU Taxonomy for Sustainable Activities may select “At the company level only”.
Explanation of terms
- Climate transition plan: a time-bound action plan that clearly outlines how an organization will achieve its strategy to pivot its existing assets, operations, and entire business model towards a trajectory that aligns with the latest and most ambitious climate science recommendations, i.e., halving greenhouse gas (GHG) emissions by 2030 and reaching net-zero by 2050 at the latest, thereby limiting global warming to 1.5. Please refer to the CDP Climate Transition Plan technical note for more details.
- Sustainable finance taxonomy: As defined by the
Bank for International Settlements, a sustainable finance taxonomy is a set of
criteria which can form the basis for an evaluation of whether and to what
extent a financial asset can support given sustainability goals. The central
goal of taxonomies is driving capital allocation towards sustainable
activities, reducing greenwashing, and enabling simpler comparison.
Additional information
Sustainable finance taxonomies are instruments to support the redirection of financial flows towards environmentally (and socially) sustainable activities. While a coherent disclosure system with internationally agreed standards and taxonomies is needed to ensure effective data access, analysis, and use by the data users, CDP’s 2025 strategy has highlighted that a harmonized taxonomy landscape is crucial to support the investment decisions of capital market actors and help to prevent greenwash, as laid out in CDP’s policy brief on sustainable finance taxonomies.
As a global environmental disclosure system, CDP aims to accelerate the implementation of sustainable finance taxonomies at scale. This is reflected in the questions in this module, asking companies to report the alignment of their business operations and financial accounting with sustainable finance taxonomies, such as the EU Taxonomy for Sustainable Activities.
These questions are taxonomy-agnostic, allowing companies to provide information on alignment with any sustainable finance taxonomy. However, additional guidance is provided for companies choosing to report under the EU Taxonomy for Sustainable Activities. The following (non-exhaustive) list of sources contains references to detailed taxonomy disclosure guidance developed by the EU Commission and the Technical Expert Group on Sustainable Finance (TEG):
(C3.5a) Quantify the percentage share of your spending/revenue that is aligned with your organization’s climate transition.
Question dependencies
This question only appears if any “Yes…” option is selected in response to column 1 of C3.5.
Change from last year
Modified question
Rationale
This question allows companies to demonstrate the extent to which their spending and revenue is compatible with their climate transition, and/or directed at/derived from activities, projects, or assets defined as sustainable by a sustainable finance taxonomy.
Ambition: The share of spending/revenue aligned with your climate transition plan and/or aligned with a sustainable finance taxonomy increases over time.
Connection to other frameworks
S&P Global Corporate Sustainability Assessment
Alignment with EU Taxonomy for sustainable activities - Capital Expenditure
Alignment with EU Taxonomy for sustainable activities - Operating Expenditure
Alignment with EU Taxonomy for sustainable activities - Revenues
NZAM (FS Only)
Commitment 4
Response options
Please complete the following table. You are able to add rows by using the “Add Row” button at the bottom of the table. *Column/row appearance is dependent on selections in this or other questions.
| 1
|
2
|
3
|
4
|
5
|
| Financial metric
|
Type of alignment being reported for this financial metric
|
Taxonomy under which information is being reported*
|
Objective under which alignment is being reported*
|
Amount of selected financial metric that is aligned in the reporting year (unit currency as selected in C0.4)
|
Select from:
- Revenue/Turnover
- CAPEX
- OPEX
- Other, please specify
|
Select from:
- Alignment with a sustainable finance taxonomy
- Alignment with our climate transition plan
|
Select from:
- EU Taxonomy for Sustainable Activities
- Other, please specify
|
Select from:
- Climate change mitigation
- Climate change adaptation
- Total across all objectives
|
Numerical field [enter a number from 0-999,999,999,999,999 using a maximum of 2 decimal places
|
| 6
|
7
|
8
|
9
|
| Percentage share of selected financial metric aligned in the reporting year (%)
|
Percentage share of selected financial metric planned to align in 2025 (%)
|
Percentage share of selected financial metric planned to align in 2030 (%)
|
Describe the methodology used to identify spending/revenue that is aligned
|
| Percentage field [enter a percentage from 0-100 using a maximum of 2 decimal places]
|
Percentage field [enter a percentage from 0-100 using a maximum of 2 decimal places]
|
Percentage field [enter a percentage from 0-100 using a maximum of 2 decimal places]
|
Text field [maximum 4,000 characters]
|
[Add row]
Requested content
General
- This question aims to understand your organization’s unique financial pathway associated with its climate transition.
- It is up to each company to select the relevant financial metric(s) and methodology(ies) for identifying the alignment of its expenditures/revenues with its climate transition.
- Note that this question requests information to be provided at the company (organizational) level. If you indicated in column 2 of C3.5 that you identify alignment at both the company and activity level, you will have the opportunity to provide activity-level information in the subsequent question, C3.5b.
- If you are reporting any type of spending on or revenue from low-carbon products and/or services, specify in column 9 whether it pertains to mature technologies or non-mature technologies (e.g., if you finance Emerging Climate Technologies). If this pertains to both mature and non-mature technologies, please provide the breakdown for these.
- It is acknowledged that figures for future years will be estimates. Assumptions underlying these estimates should be disclosed in column 9.
Financial metric (column 1)
- Add a row for each financial metric you would like to provide information for, or select “Other, please specify” to provide information for a financial metric that is not listed.
- You can make your response more granular by adding multiple rows and selecting “Other, please specify”. For example, if in addition to total OPEX, you wish to report several distinct categories of OPEX (e.g., utilities, business travel, R&D expenses, etc.) separately, you may do so by adding multiple rows and using “Other, please specify” to specify the relevant OPEX category.
- Companies disclosing alignment against the EU Taxonomy for Sustainable Activities should add a separate row to provide figures for turnover, CAPEX and if relevant, OPEX associated with each environmental objective separately, and a total across all objectives. Note that as per the EU Taxonomy Technical Expert Group Report (TEG), “turnover” and “revenue” are often used interchangeably, and in some contexts, may mean the same thing, despite there being some technical differences. The term turnover is most commonly used in Europe and Asia, while the use of the terms revenues or sales is more common in the United States. Revenue disclosures can therefore be considered as turnover wherever appropriate.
Type of alignment being reported for this financial metric (column 2)
- The drop-down options presented in this column will depend on your response to question C3.5.
- If you select “Alignment with a climate transition plan”, it is up to each company to determine what is considered to be aligned with your organization’s climate transition plan, for example:
- Revenue derived from the sale of low-carbon products or services as defined via recognized taxonomies or methodologies could be included in the percentage share aligned with your organization’s climate transition plan.
- Spending (e.g., CAPEX or OPEX) on the implementation of emissions reduction initiatives and/or investment in new low-carbon assets or projects could be included in the percentage share aligned with your organization’s climate transition plan.
- Spending/revenue that is related to activities which do not directly contribute to your organization’s climate transition (e.g. revenue from sales of equipment used in both low-carbon and high-emitting assets etc.) should not be included.
- If you select “Alignment with a sustainable finance taxonomy”, the information reported in the subsequent columns should be calculated in line with the requirements set out by the taxonomy. For example, if you are disclosing information under the EU Taxonomy for Sustainable Activities, the information should be reported in accordance with the requirements of Article 3 of the EU Taxonomy Regulation.
Taxonomy under which information if being reported (column 3)
- This column is only presented if “Alignment with a sustainable finance taxonomy” is selected in column 2 “Type of alignment being reported for this financial metric”.
- Add a row for each sustainable finance taxonomy you are providing information for.
- Select “Other, please specify” to provide information for a sustainable finance taxonomy that is not listed. For further information on alternative sustainable finance taxonomies, please see CDP’s policy brief.
- If you select “EU Taxonomy for Sustainable Activities”, note that the reporting period under the EU Taxonomy is January to December which may differ from the reporting period indicated in C0.2 relevant to the rest of the CDP questionnaire.
Objective under which alignment is being reported (column 4)
- This column is only presented if “Alignment with a sustainable finance taxonomy” is selected in column 2 “Type of alignment being reported for this financial metric”.
- Add a row for each environmental objective within the sustainable finance taxonomy you wish to provide information for. See the Explanation of Terms for more information on climate change mitigation and adaptation. If the sustainable finance taxonomy does not require disclosure against specific environmental objectives, select “Total across all objectives”.
- Companies disclosing alignment against the EU Taxonomy for Sustainable Activities should enter information for each environmental objective separately. You should also report total alignment across all objectives. The figures reported in this question should be calculated from the “Taxonomy-aligned” information you reported at activity-level in the subsequent question C3.5b.
Amount of selected financial metric that is aligned in the reporting year (column 5)
- Enter the spending/revenue that you consider to be aligned with your organization’s climate transition (i.e., aligned with your climate transition plan or a sustainable finance taxonomy as indicated in column 3) for this financial metric as an absolute monetary value in the reporting year.
- This figure should be based on your company-wide financial statement for the reporting year, consistent with your organizational boundary as disclosed in C0.5, and in the same currency that you selected in question C0.4 for all financial information disclosed throughout your response.
- Unless your organization is disclosing alignment against a sustainable finance taxonomy which requires data to be provided for a specific reporting year, the figure provided in this column should be consistent with the reporting year defined by your answer to C0.2.
- Companies disclosing alignment against the EU Taxonomy for Sustainable Activities should provide this figure for a January to December reporting period. If you are disclosing information under the EU Taxonomy for Sustainable Activities, the figure reported in this column should meet the requirements of Article 3 of the EU Taxonomy Regulation.
Percentage share of selected financial metric aligned in the reporting year (%) (column 6)
- Enter the spending/revenue that you consider to be aligned with your organization’s climate transition (i.e. that is aligned with your climate transition plan or a sustainable finance taxonomy as indicated in column 3) for this financial metric as a percentage of your total spending/revenue for this financial metric in the reporting year.
- This figure should be based on your company-wide financial statement for the reporting year, consistent with your organizational boundary as disclosed in C0.5.
- Unless your organization is disclosing alignment against a sustainable finance taxonomy which requires data to be provided for a specific reporting year, the figure provided in this column should be consistent with the reporting year defined by your answer to C0.2.
- Companies disclosing alignment against the EU Taxonomy for Sustainable Activities should provide this figure for a January to December reporting period. If you are disclosing information under the EU Taxonomy for Sustainable Activities, the figure reported in this column should meet the requirements of Article 3 of the EU Taxonomy Regulation.
Percentage share of selected financial metric planned to align in 2025 (%) (column 7)
- Enter the spending/revenue for this financial metric that you plan to align with your organization’s climate transition (i.e., that you plan to align with your climate transition plan or a sustainable finance taxonomy as indicated in column 3) as a percentage of your total planned spending/revenue for this financial metric in 2025.
Percentage share of selected financial metric planned to align with a 1.5°C world in 2030 (%) (column 8)
- Enter the spending/revenue for this financial metric that you plan to align with your organization’s climate transition (i.e., that you plan to align with your climate transition plan or a sustainable finance taxonomy as indicated in column 3) as a percentage of your total planned spending/revenue for this financial metric in 2030.
Describe the methodology used to identify spending/revenue that is aligned (column 9)
- Provide the criteria used to determine the alignment of the spending/revenue with your organization’s climate transition.
- Comment on how your organization’s spending/revenue that is aligned with your climate transition is estimated to change over time and describe the assumptions underlying the estimation.
- Companies disclosing alignment with your organization’s climate transition plan:
- Should provide examples of the activities, assets, technologies, products
and/or services for which you classified the associated spending/revenue
as aligned with your climate transition plan.
- You may also provide examples of activities, assets, technologies,
products and/or services for which you did not classify the associated
spending/revenue as aligned.
- Indicate whether you have obtained third party verification/assurance for your alignment information.
- Companies disclosing alignment against the EU Taxonomy for Sustainable Activities should use this column to describe your methodology for calculating your taxonomy alignment and how you have avoided double-counting. If you have obtained third party verification/assurance for your alignment information, you will have the opportunity to indicate this in a subsequent question.
- If you are disclosing alignment with your organization’s climate transition plan and alignment with a sustainable finance taxonomy in separate rows, use this column to explain why these figures differ.
Explanation of terms
- Climate transition plan: a time-bound action plan that clearly outlines how an organization will achieve its strategy to pivot its existing assets, operations, and entire business model towards a trajectory that aligns with the latest and most ambitious climate science recommendations, i.e., halving greenhouse gas (GHG) emissions by 2030 and reaching net-zero by 2050 at the latest, thereby limiting global warming to 1.5. Please refer to the CDP Climate Transition Plan technical note for more details
- Emerging Climate Technology (ECT): a commercially promising technology that addresses climate mitigation challenges but needs to attract enough investment to deploy the technology and develop business models and markets for the product or services it produces. Eventually it may become a successful innovation deployed at scale, generating new markets or profoundly disrupting established (fossil-based) ones (Auerswald et al., 2005). For a more detailed definition and guidance, refer to the ECT initiative.
- Climate change mitigation: the process of holding the increase in the global average temperature to well below 2°C and pursuing efforts to limit it to 1.5°C above pre-industrial levels, as laid down in the Paris Agreement.
- Climate change adaptation: the process of adjustment to actual and expected climate change and its impacts.
- Revenue: Income arising in the course of an entity’s ordinary activities (less returns, allowances and discounts) - before deducting costs for the goods/services sold and operating expenses to arrive at profit (based on the International Financial Reporting Standard)
- Turnover: 'net turnover' means the amount derived from the sale of products and the provision of services after deducting sales rebates and value added tax and other taxes directly linked to turnover, as per Article 2(5) of Directive 2013/34/EU (The Accounting Directive).
- Capital expenditure (CAPEX): A measure of the value of purchases of fixed assets such as property, buildings, an industrial plant, technology, or equipment. Put differently, CapEx is any type of expense that a company capitalizes, or shows on its balance sheet as an investment, rather than on its income statement as an expenditure.
- Operational expenditure (OPEX): Operating expenditure includes direct non-capitalized costs that relate to research and development, building renovation measures, short-term lease, maintenance and repair, and any other direct expenditures relating to the day-to-day servicing of assets of property, plant and equipment by the undertaking or third party to whom activities are outsourced that are necessary to ensure the continued and effective functioning of such assets.
Example Response
Company A Response
| 1
|
2
|
3
|
4
|
5
|
|
Financial Metric
|
Type of alignment being reported for this financial metric |
Taxonomy under which information is being reported* |
Objective under which alignment is being reported* |
Amount of selected financial metric that is aligned in the reporting year (unit currency as selected in C0.4) |
|
Revenue/Turnover
|
Alignment with our climate
transition plan
|
N/A
|
N/A
|
330,000
|
| 6
|
7
|
8
|
9
|
Percentage share of selected financial metric
aligned in the reporting year (%)
|
Percentage share of selected financial metric
planned to align in 2025 (%)
|
Percentage share of selected financial metric
planned to align in 2030 (%)
|
Describe the methodology used to identify
spending/revenue that is aligned
|
| 2
|
4
|
30
|
Our automobile manufacturing business currently
produces both vehicles with internal combustion engines and electric vehicles.
We have accounted as ‘aligned with our climate transition plan’ the revenue
generated from sales of electric vehicles only. We estimate that our revenue
from EVs will increase in the future due to regulatory requirements and
shifting consumer preferences. To estimate the percentage share in 2025 and
2030 we modelled the results from a recent consumer survey. To estimate the
demand of EV vehicles in different jurisdictions we carried out a policy
analysis and modelled the emergence of future regulations. In our calculation
we excluded revenues from ICE vehicles and revenues from sales of equipment
used in both ICE and EVs, as we classed such equipment as neutral.
|
Company B Response
| 1
|
2
|
3
|
4
|
5
|
| Financial Metric
|
Type of alignment being reported for this financial metric |
Taxonomy under which information is being reported* |
Objective under which alignment is being reported*
|
Amount of selected financial metric that is aligned in the reporting year (unit currency as selected in C0.4) |
| CAPEX
|
Alignment with our climate
transition plan
|
N/A
|
N/A
|
600,000
|
| CAPEX
|
Alignment with a
sustainable taxonomy
|
EU Taxonomy for Sustainable
Activities
|
Total across all objectives
|
480,000
|
| 6
|
7
|
8
|
9
|
Percentage share of selected financial metric aligned in the reporting year (%)
|
Percentage share of selected financial metric planned to align in 2025 (%)
|
Percentage share of selected financial metric planned to align in 2030 (%)
|
Describe the methodology used to identify spending/revenue that is aligned
|
| 10
|
23
|
42
|
We currently generate energy from both renewable
energy and fossil fuel energy generation facilities. We have accounted only the
CAPEX associated with our renewable energy assets as ‘aligned with our climate
transition plan’. As part of our net-zero by 2045 commitment, we intend to
triple our renewable energy capacity by 2030 and exit our coal generation by
2025 and gas generation by 2040. We are therefore planning to increase the
CAPEX associated with renewables from 10% to 42% of our total CAPEX by 2030.
|
| 8
|
20
|
40
|
We have also assessed the alignment of our renewable energy and fossil
fuel activities with the EU Taxonomy. The 8% figure disclosed represents the
proportion of our total CAPEX associated with the substantial contribution of
our onshore wind and thermal power generation activities to climate change
mitigation and climate change adaptation in the reporting year. CAPEX
associated with our onshore wind and thermal power plants, plant machinery and
grid equipment are included. Our fossil fuel power generation activities
did not meet the technical screening criteria prescribed under the EU Taxonomy
Complementary Delegated Act
As part of our net-zero commitment to triple our renewable energy assets and
phase out fossil fuel by 2045, we plan to increase our taxonomy-aligned CAPEX
to 20% in 2025 and 40% in 2030. In calculating the figure as a total across
both climate-related objectives, we followed the EU Commission’s guidance to
avoid double counting by separately counting CAPEX associated with activities
contributing to climate mitigation and climate adaptation at the activity
level.
|
Company C response
| 1
|
2
|
3
|
4
|
5
|
| Financial Metric
|
Type of alignment being reported for this financial metric |
Taxonomy under which information is being reported* |
Objective under which alignment is being reported* |
Amount of selected financial metric that is aligned in the reporting year (unit currency as selected in C0.4) |
| Other, please specify (OPEX
- R&D expenses)
|
Alignment with our climate
transition plan
|
N/A
|
N/A
|
60,000
|
| 6
|
7
|
8
|
9
|
| Percentage share of selected financial metric planned to align in 2025 (%)
|
Percentage share of selected financial metric planned to align in 2025 (%)
|
Percentage share of selected financial metric planned to align in 2030 (%)
|
Describe the methodology used to identify spending/revenue that is aligned
|
| 18
|
30
|
60
|
Alongside our dairy business, we produce
plant-based milks and yogurt. We have accounted the R&D expenses related to
these plant-based products as ‘aligned with our climate transition plan’.
R&D expenses are accounted for in our financial statements as a subset of
OPEX. Based on trends over the last ten years, we anticipate consumer demand
for our plant-based products to continue to increase over time. Therefore, we
estimate that the share of our total R&D that is on plant-based dairy
alternatives will increase to 60% by 2030 to meet this demand.
|
Company D response
| 1
|
2
|
3
|
4
|
5
|
| Financial Metric
|
Type of alignment being reported for this financial metric |
Taxonomy under which information is being reported* |
Objective under which alignment is being reported* |
Amount of selected financial metric that is aligned in the reporting year (unit currency as selected in C0.4) |
| Revenue/Turnover
|
Alignment with a sustainable finance taxonomy
|
EU Taxonomy for Sustainable Activities
|
Climate change mitigation
|
800,500
|
| 6
|
7
|
8
|
9
|
| Percentage share of selected financial metric planned to align in 2025 (%)
|
Percentage share of selected financial metric planned to align in 2025 (%)
|
Percentage share of selected financial metric planned to align in 2030 (%)
|
Describe the methodology used to identify spending/revenue that is aligned
|
| 15
|
20
|
35
|
Our company’s operations include clinker and cement manufacturing activities which are eligible under the
EU Taxonomy. In the reporting year, 15% of our total turnover was attributable to the manufacture of grey cement clinker and cement from alternative
hydraulic binder – activities which met all criteria to
contribute substantially to climate change mitigation under the EU Taxonomy by enabling the transition to 1.5C. Our operations in these activities are expected to expand by 2030 as we phase out our conventional
cement manufacturing units. Therefore, we expect the proportion of our total turnover which substantially contributes to climate change mitigation under the taxonomy to increase to 35% by 2030.
|
(C3.5b) Quantify
the percentage share of your spending/revenue that was associated with eligible
and aligned activities under the sustainable finance taxonomy in the reporting
year.
Question dependencies
This question only appears if “At both the company and activity level” is selected in response to column 2 of C3.5.
Change from last year
New question
Rationale
This question allows companies to provide evidence of the extent to which their spending and revenue is directed at/derived from activities defined as sustainable by a sustainable finance taxonomy.
Ambition: Companies align their spending and revenue with activities defined as sustainable by a sustainable finance taxonomy.
Connection to other frameworks
S&P Global Corporate Sustainability Assessment
Alignment with EU Taxonomy for sustainable activities - Capital Expenditure
Alignment with EU Taxonomy for sustainable activities - Operating Expenditure
Alignment with EU Taxonomy for sustainable activities - Revenues
Response options
Please complete the following table. You
are able to add rows by using the “Add Row” button at the bottom of the table.
*Column/row appearance is dependent on selections in this or other questions.
| 1
|
2
|
3
|
4
|
5
|
6
|
7
|
| Economic activity
|
Taxonomy under which information is being reported
|
Taxonomy alignment
|
Financial metric(s)
|
Taxonomy-aligned turnover from this
activity in the reporting year (unit currency as selected in C0.4)*
|
Taxonomy-aligned turnover from this activity as % of total turnover in the reporting year*
|
Taxonomy-aligned turnover from this activity that substantially contributed to climate change mitigation as a % of total turnover in the reporting year*
|
|
Select from drop-down options below
|
Select from:
- EU
Taxonomy for Sustainable Activities
- Other,
please specify
|
Select from:
- Taxonomy-aligned
- Taxonomy-eligible but not aligned
|
Select all that apply:
|
Numerical field [enter a number from 0-999,999,999,999,999 using a maximum of 2 decimal places]
|
Percentage field [enter a percentage from 0-100 using a maximum of 2 decimal places]
|
Percentage field [enter a percentage from 0-100 using a maximum of 2 decimal places]
|
| 8
|
9
|
10
|
11
|
12
|
13
|
14
|
| Taxonomy-aligned turnover from this activity that substantially contributed to climate change adaptation as a % of total turnover in the reporting year*
|
Taxonomy-eligible but not aligned turnover from this activity in the reporting year (unit currency as selected in C0.4)*
|
Taxonomy-eligible but not aligned turnover from this activity as % of total turnover in the reporting year*
|
Taxonomy-aligned CAPEX from this activity in the reporting year (unit currency as selected in C0.4)*
|
Taxonomy-aligned CAPEX from this activity as % of total CAPEX in the reporting year*
|
Taxonomy-aligned CAPEX from this activity that substantially contributed to climate change mitigation as a % of total CAPEX in the reporting year*
|
Taxonomy-aligned CAPEX from this activity that substantially contributed to climate change adaptation as a % of total CAPEX in the reporting year*
|
| Percentage field [enter a percentage from 0-100 using a maximum of 2 decimal places]
|
Numerical field [enter a number from 0-999,999,999,999,999 using a maximum of 2 decimal places]
|
Percentage field [enter a percentage from 0-100 using a maximum of 2 decimal places]
|
Numerical field [enter a number from 0-999,999,999,999,999 using a maximum of 2 decimal places]
|
Percentage field [enter a percentage from 0-100 using a maximum of 2 decimal places]
|
Percentage field [enter a percentage from 0-100 using a maximum of 2 decimal places]
|
Percentage field [enter a percentage from 0-100 using a maximum of 2 decimal places]
|
| 15
|
16
|
17
|
18
|
19
|
20
|
21
|
| Taxonomy-eligible but not aligned CAPEX associated with this activity in the reporting year (unit currency as selected in C0.4)*
|
Taxonomy-eligible but not aligned CAPEX associated with this activity as % of total CAPEX in the reporting year*
|
Taxonomy-aligned OPEX from this activity in the reporting year (unit currency as selected in C0.4)*
|
Taxonomy-aligned OPEX from this activity as % of total OPEX in the reporting year*
|
Taxonomy-aligned OPEX from this activity that substantially contributed to climate change mitigation as a % of total OPEX in the reporting year*
|
Taxonomy-aligned OPEX from this activity that substantially contributed to climate change adaptation as a % of total OPEX in the reporting year*
|
Taxonomy-eligible but not aligned OPEX associated with this activity in the reporting year (unit currency as selected in C0.4)*
|
| Numerical field [enter a number from 0-999,999,999,999,999 using a maximum of 2 decimal places]
|
Percentage field [enter a percentage from 0-100 using a maximum of 2 decimal places]
|
Numerical field [enter a number from 0-999,999,999,999,999 using a maximum of 2 decimal places]
|
Percentage field [enter a percentage from 0-100 using a maximum of 2 decimal places]
|
Percentage field [enter a percentage from 0-100 using a maximum of 2 decimal places]
|
Percentage field [enter a percentage from 0-100 using a maximum of 2 decimal places]
|
Numerical field [enter a number from 0-999,999,999,999,999 using a maximum of 2 decimal places]
|
| 22
|
23
|
24
|
25
|
26
|
27
|
28
|
| Taxonomy-eligible but not aligned OPEX associated with this activity as % total OPEX in the reporting year*
|
Type(s) of substantial contribution*
|
Calculation methodology and supporting information
|
Technical screening criteria met
|
Details of technical screening criteria analysis
|
Do no significant harm requirements met
|
Details of do no significant harm analysis
|
| Percentage field [enter a percentage from 0-100 using a maximum of 2 decimal places]
|
Select all that apply:
- Own performance
- Adapted activity
- Transitional activity
- Activity enabling mitigation
- Activity enabling adaptation
|
Text field [maximum 2,500 characters]
|
Select from:
|
Text field [maximum 2,500 characters]
|
Select from:
|
Text field [maximum 2,500 characters]
|
| 29 | 30 |
| Minimum safeguards compliance requirements met | Details of minimum safeguards compliance analysis |
|---|
| Select from: | Text field [maximum 2,500 characters] |
[Add row]
Economic activity (column 1) drop-down options
Select one of the following options:
- Afforestation
- Rehabilitation and restoration of forests, including reforestation and natural forest regeneration after an extreme event
- Forest management
- Conservation forestry
- Restoration of wetlands
- Manufacture of renewable energy technologies
- Manufacture of equipment for the production and use of hydrogen
- Manufacture of low carbon technologies for transport
- Manufacture of batteries
- Manufacture of energy efficiency equipment for buildings
- Manufacture of other low carbon technologies
- Manufacture of cement
- Manufacture of aluminium
- Manufacture of iron and steel
- Manufacture of hydrogen
- Manufacture of carbon black
- Manufacture of soda ash
- Manufacture of chlorine
- Manufacture of organic basic chemicals
- Manufacture of anhydrous ammonia
- Manufacture of nitric acid
- Manufacture of plastics in primary form
- Electricity generation using solar photovoltaic technology
- Electricity generation using concentrated solar power (CSP) technology
- Electricity generation from wind power
- Electricity generation from ocean energy technologies
- Electricity generation from hydropower
- Electricity generation from geothermal energy
- Electricity generation from renewable non-fossil gaseous and liquid fuels
- Electricity generation from bioenergy
|
- Transmission and distribution of electricity
- Storage of electricity
- Storage of thermal energy
- Storage of hydrogen
- Manufacture of biogas and biofuels for use in transport and of bioliquids
- Transmission and distribution networks for renewable and low-carbon gases
- District heating/cooling distribution
- Installation and operation of electric heat pumps
- Cogeneration of heat/cool and power from solar energy
- Cogeneration of heat/cool and power from geothermal energy
- Cogeneration of heat/cool and power from renewable non-fossil gaseous and liquid fuels
- Cogeneration of heat/cool and power from bioenergy
- Production of heat/cool from solar thermal heating
- Production of heat/cool from geothermal energy
- Production of heat/cool from renewable non-fossil gaseous and liquid fuels
- Production of heat/cool from bioenergy
- Production of heat/cool using waste heat
- Construction, extension and operation of water collection, treatment and supply systems
- Renewal of water collection, treatment and supply systems
- Construction, extension and operation of waste water collection and treatment
- Renewal of waste water collection and treatment
- Collection and transport of non-hazardous waste in source segregated fractions
|
- Anaerobic digestion of sewage sludge
- Anaerobic digestion of bio-waste
- Composting of bio-waste
- Material recovery from non-hazardous waste
- Landfill gas capture and utilization
- Transport of CO2
- Underground permanent geological storage of CO2
- Passenger interurban rail transport
- Freight rail transport
- Urban and suburban transport, road passenger transport
- Operation of personal mobility devices, cycle logistics
- Transport by motorbikes, passenger cars and light commercial vehicles
- Freight transport services by road
- Inland passenger water transport
- Inland freight water transport
- Retrofitting of inland water passenger and freight transport
- Sea and coastal freight water transport, vessels for port operations and auxiliary activities
- Sea and coastal passenger water transport
- Retrofitting of sea and coastal freight and passenger water transport
- Infrastructure for personal mobility, cycle logistics
- Infrastructure for rail transport
- Infrastructure enabling low-carbon road transport and public transport
- Infrastructure enabling low carbon water transport
- Infrastructure for water transport
- Infrastructure enabling road transport and public transport
- Airport infrastructure
- Low carbon airport infrastructure
- Construction of new buildings
- Renovation of existing buildings
- Installation, maintenance and repair of energy efficiency equipment
- Installation, maintenance and repair of charging stations for electric vehicles in buildings (and parking spaces attached to buildings)
- Installation, maintenance and repair of instruments and devices for measuring, regulation and controlling energy performance of buildings
|
- Installation, maintenance and repair of renewable energy technologies
- Acquisition and ownership of buildings
- Data processing, hosting and related activities
- Computer programming, consultancy and related activities
- Programming and broadcasting activities
- Data-driven solutions for GHG emissions reductions
- Close to market research, development and innovation
- Research, development and innovation for direct air capture of CO2
- Professional services related to energy performance of buildings
- Engineering activities and related technical consultancy dedicated to adaptation to climate change
- Non-life insurance: underwriting of climate-related perils
- Reinsurance
- Education
- Residential care activities
- Creative, arts and entertainment activities
- Libraries, archives, museums and cultural activities
- Motion picture, video and television program production, sound recording and music publishing activities
- Pre-commercial stages of advanced technologies to produce energy from nuclear processes with minimal waste from the fuel cycle
- Construction and safe operation of
new nuclear power plants, for the generation of electricity or heat, including
for hydrogen production, using best-available technologies
- Electricity generation from nuclear energy in existing installations
- Electricity generation from fossil gaseous fuels
- High-efficiency co-generation of heat/cool and power from fossil gaseous fuels
- Production of heat/cool from fossil gaseous fuels in an efficient district heating and cooling system
|
Requested content
General
- This question requests information on the numerical amount and percentage of your organization’s total turnover, CAPEX, and, where applicable, OPEX in the reporting year which, in relation to a selected activity, is:
- Taxonomy-aligned: meets the criteria prescribed under a sustainable finance taxonomy; and
- Taxonomy-eligible but not aligned: does not meet the criteria prescribed under a sustainable finance taxonomy
- Note that the information provided in this question should be limited to activities which are eligible (or aligned) under a sustainable finance taxonomy (i.e., activities which are eligible to be classified as environmentally sustainable under the taxonomy). You will have the opportunity to provide information on non-eligible activities in C3.5c.
- If you are disclosing information under the EU Taxonomy for Sustainable Activities, you should report each of Revenue/Turnover, CAPEX, and, where applicable, OPEX for your selected activities.
- If you have obtained third party verification/assurance for your taxonomy-alignment data, you will have the opportunity to indicate this in C3.5c and C10.2a.
- See “Explanation of terms” for more information.
Economic activity (column 1)
- Select the option that best describes the activity for which you are disclosing financial information on taxonomy-eligibility or -alignment.
- The list of economic activities corresponds to the classification of environmentally sustainable economic activities included within the Climate Delegated Act to the EU Taxonomy Regulation. Companies reporting against taxonomies other than the EU Taxonomy should select the closest approximation of the activity for which you wish to report information, based on their given description within the Climate Delegated Act. Whilst the EU Taxonomy list of activities are largely based on the Nomenclature of Economic Activities (NACE), note that these references are only indicative and not exhaustive. Therefore, even in the absence of a NACE sector reference in the Climate Delegated Act, an economic activity that you wish to report on may yet match the activity description laid out by the Act and be eligible for reporting.
- If an activity comprises elements that are both taxonomy-aligned and taxonomy-eligible but not aligned (e.g., the activity meets the criteria prescribed under the taxonomy for some of your organization’s facilities but not others), add two separate rows for that activity. In one row, provide financial information for the proportion that is taxonomy-aligned, and in the other, provide financial information for the proportion that is taxonomy-eligible but not aligned. Select the relevant option in column 3 to indicate which type of taxonomy alignment you are reporting for each row.
Taxonomy under which information is being reported (column 2)
- If you wish to provide financial information on your organization’s alignment with an activity-level sustainable finance taxonomy that is not listed, select “Other, please specify” and provide the name of the taxonomy.
Taxonomy Alignment (column 3)
- Select “Taxonomy-aligned" to report financial information for an activity (or a proportion of an activity) which meets the criteria prescribed under the sustainable finance taxonomy selected in column 2 in the reporting year.
- Select “Taxonomy-eligible but not aligned” to report financial information for an activity (or a proportion of an activity) which does not meet the criteria prescribed under the sustainable finance taxonomy selected in column 2 in the reporting year.
- If you are disclosing information under the EU Taxonomy for Sustainable Activities, selecting “Taxonomy-aligned” in this column indicates that you are able to provide information in columns 25-30 as per the requirements of Article 3 of the EU Taxonomy Regulation.
- Your selection in this column will drive the appearance of subsequent columns.
Financial metric(s) (column 4)
- Select the financial metric(s) you would like to provide information for.
- If you are disclosing information under the EU Taxonomy for Sustainable Activities, you should select turnover, CAPEX, and, if relevant, OPEX for each row reported, i.e., for each taxonomy-aligned activity (or proportion of an activity) and each taxonomy-eligible but not aligned activity (or proportion of an activity).
- Your selection in this column will drive the appearance of subsequent columns.
Taxonomy-aligned [turnover/CAPEX/OPEX] from this activity in the reporting year (unit currency as selected in C0.4) (columns 5, 11, 17)
- These columns are presented if “Taxonomy-aligned” is selected in column 3 “Taxonomy alignment”. The relevant column(s) (5, 11, and/or 17) will be presented based on your selection(s) in column 4 “Financial metric(s)”.
- Enter the absolute value of taxonomy-aligned [turnover/CAPEX/OPEX] associated with the activity selected in column 1 in the reporting year.
- The figures provided in these columns should be based on your company-wide financial statement for the reporting year, consistent with your organizational boundary as disclosed in C0.5, and in the same currency that you selected in question C0.4 for all financial information disclosed throughout your response.
- Unless your organization is disclosing alignment against a sustainable finance taxonomy which requires data to be provided for a specific reporting year, the figures provided should be consistent with the reporting year defined by your answer to C0.2.
- Companies disclosing alignment against the EU Taxonomy for Sustainable Activities should provide figures for a January to December reporting period.
Taxonomy-aligned [turnover/CAPEX/OPEX] from this activity as % of total [turnover/CAPEX/OPEX] in the reporting year (columns 6, 12, 18)
- These columns are presented if “Taxonomy-aligned” is selected in column 3 “Taxonomy alignment”. The relevant column(s) (6, 12, and/or 18) will be presented based on your selection(s) in column 4 “Financial metric(s)”.
- Enter the taxonomy-aligned [turnover/CAPEX/OPEX] associated with the activity selected in column 1 as a percentage of your total [turnover/CAPEX/OPEX] in the reporting year.
- Unless your organization is disclosing alignment against a sustainable finance taxonomy which requires data to be provided for a specific reporting year, the figures provided in these columns should be consistent with the reporting year defined by your answer to C0.2.
- Companies disclosing alignment against the EU Taxonomy for Sustainable Activities should provide figures for a January to December reporting period, and should refer to Annex I of the Disclosure Delegated Act (pg. 17-22) and sections II, III and IV of the EU Commission FAQs (pg. 25-30) for detailed guidance on calculation of these figures, referred to as the ‘turnover KPI’, ‘CapEx KPI’ and ‘OpEx KPI’. See the Explanation of Terms for more information.
Taxonomy-aligned [turnover/CAPEX/OPEX] from this activity that substantially contributed to [climate change mitigation/climate change adaptation] as a % of total [turnover/CAPEX/OPEX] in the reporting year (columns 7, 8, 13, 14, 19, 20)
- These columns are presented if “Taxonomy-aligned” is selected in column 3 “Taxonomy alignment”. The relevant column(s) (7 & 8, 13 & 14, and/or 19 & 20) will be presented based on your selection(s) in column 4 “Financial metric(s)”.
- Enter separately the percentage of your organization’s taxonomy-aligned [turnover/CAPEX/OPEX] associated with the activity selected in column 1 that contributed substantially to climate change mitigation (columns 7, 13, 19) and climate change adaptation (columns 8, 14, 19) in the reporting year.
- For example:
- if 23% your organization’s total turnover from the activity in the reporting year contributed to climate change mitigation, but the activity did not contribute to climate change adaptation, enter “23” in column 7, and “0” in column 8; or
- if the activity did not contribute to climate change mitigation, but 7% your organization’s OPEX associated with the activity in the reporting year contributed to climate change adaptation, enter “0” in column 19 and “7” in column 20.
- If 14% your organization's total CAPEX associated with the activity in the reporting year contributed to climate change mitigation, and 3% your organization's total CAPEX associated with the activity in the reporting year contributed to climate change adaptation, enter "14" in column 13 and "3" in column 14.
- If you are disclosing information under the EU Taxonomy for Sustainable Activities and the activity selected in column 1 substantially contributed to both climate change mitigation and climate change adaptation in the reporting year, depending on the specific nature of the activity, a percentage figure for taxonomy-aligned [turnover/CAPEX/OPEX] may be reported under both objectives. Note that turnover from adapted activities may not be assessed for climate change adaptation except in specific scenarios. For more information on addressing double counting, refer to the examples provided in the EU Commission FAQs (p15-17).
- Unless your organization is disclosing alignment against a sustainable finance taxonomy which requires data to be provided for a specific reporting year, the figures provided should be consistent with the reporting year defined by your answer to C0.2.
- Companies disclosing alignment against the EU Taxonomy for Sustainable Activities should provide figures for a January to December reporting period.
Taxonomy-eligible but not aligned [turnover/CAPEX/OPEX] from this activity in the reporting year (columns 9, 15, 21)
- These columns are presented if “Taxonomy-eligible but not aligned” is selected in column 3 “Taxonomy alignment”. The relevant column(s) (9, 15, and/or 21) will be presented based on your selection(s) in column 4 “Financial metric(s)”.
- Enter the absolute value of taxonomy-eligible but not aligned [turnover/CAPEX/OPEX] associated with the activity selected in column 1 in the reporting year.
- Unless your organization is disclosing alignment against a sustainable finance taxonomy which requires data to be provided for a specific reporting year, the figures provided should be consistent with the reporting year defined by your answer to C0.2.
- Companies disclosing alignment against the EU Taxonomy for Sustainable Activities should provide figures for a January to December reporting period.
Taxonomy-eligible but not aligned [turnover/CAPEX/OPEX] from this activity as % of total [turnover/CAPEX/OPEX] in the reporting year (columns 10, 16, 22)
- These columns are presented if “Taxonomy-eligible but not aligned” is selected in column 3 “Taxonomy alignment”. The relevant column(s) (10, 16, and/or 22) will be presented based on your selection(s) in column 4 “Financial metric(s)”.
- Enter the taxonomy-eligible but not aligned [turnover/CAPEX/OPEX] associated with the activity selected in column 1 as a percentage of your total [turnover/CAPEX/OPEX] in the reporting year.
- Unless your organization is disclosing alignment against a sustainable finance taxonomy which requires data to be provided for a specific reporting year, the figures provided in these columns should be consistent with the reporting year defined by your answer to C0.2.
- Companies disclosing alignment against the EU Taxonomy for Sustainable Activities should provide figures for a January to December reporting period.
Type(s) of substantial contribution (column 23)
- This column is presented if “Taxonomy-aligned” is selected in column 3 “Taxonomy alignment”
- Select the type(s) of substantial contribution to climate change mitigation and/or climate change adaptation you are disclosing for the activity selected in column 1:
- Own performance: the activity is being performed in a way that it itself contributes substantially by making a positive impact or removing a negative impact on climate change mitigation. For example, where the activity is already low-carbon. If you are disclosing alignment against the EU Taxonomy for Sustainable Activities, note that activities are considered substantially contributing through own performance if they meet the corresponding technical screening criteria established by the Climate Delegated Act (Annex I- pg. 12- 140).
- Adapted activity: the activity is being performed in a way that it itself contributes substantially by making a positive impact or removing a negative impact on climate change adaptation. For example, where the activity adopts adaptation solutions. If you are disclosing alignment against the EU Taxonomy for Sustainable Activities, note that activities may qualify as substantially contributing through own performance if they meet the corresponding technical screening criteria established by the Climate Delegated Act (Annex II- pg. 146- 346).
- Transitional activity: the activity does not have a technologically or economically feasible low-carbon alternative, but substantially contributes to climate change mitigation by supporting the transition to a net-zero carbon economy consistent with a pathway to limit the temperature increase to 1.5C above preindustrial levels.
- Activity enabling climate change mitigation: the activity enables a substantial contribution to be made to climate change mitigation in other activities. For example, the activity enables other activities to achieve emissions reductions.
- Activity enabling climate change adaptation: the activity enables a substantial contribution to be made to climate change adaptation in other activities. For example, the activity is developing adaptation solutions.
- If you are disclosing against the EU Taxonomy for Sustainable Activities, you are encouraged to use the EU Taxonomy Compass tool developed by the EU Commission, to determine whether an activity is enabling or transitional.
- If the activity substantially contributes to both climate change mitigation and climate change adaptation, select all types of substantial contribution across both objectives. For example, an activity may contribute substantially to climate change mitigation based on its own performance, and also enable climate change adaptation.
Calculation methodology and supporting information (column 24)
- Disclose the basis on which figures reported in this question for the activity selected in column 1 were calculated, including any assessment of the allocation of revenues and expenditures to the activity, and its CAPEX plan (as per the Disclosure Delegated Act (Annex I- pg. 19-22) in the case of the EU Taxonomy).
- Provide any other supporting information, such as the basis on which the turnover, CAPEX, and, if relevant, OPEX were calculated, and any inclusions or exclusions thereof.
- Indicate whether any operations within the activity selected in column 1 are non-eligible under the sustainable finance taxonomy. If you are reporting against the EU Taxonomy for Sustainable Activities use this column to indicate non-eligible activities under the Complementary Delegated Act (Annex III- pg. 43-44).
Technical screening criteria met (column 25)
- Select whether the activity selected in column 1 meets the technical screening criteria for substantial contribution to climate change mitigation and/or climate change adaptation established under the sustainable finance taxonomy (the Climate Delegated Act (Annexes I and II) in the case of the EU Taxonomy).
- If an activity selected in column 1 substantially contributes to both climate change mitigation and climate change adaptation, select ‘Yes’ in this column only if the technical screening criteria for the activity set against both objectives under the sustainable finance taxonomy have been met.
- For activities that are both taxonomy-aligned and taxonomy-eligible but not aligned (i.e. that you are reporting in two separate rows), select whether the proportion of the activity reported in this row meets the technical screening criteria, as per your selection in column 3 “Taxonomy Alignment”.
Details of technical screening criteria analysis (column 26)
- If you selected “Yes” in column 25, describe how the activity meets the technical screening criteria for substantial contribution to climate change mitigation and/or climate change adaptation.
- If you selected “No”, in column 25, explain why the activity does not meet the technical screening criteria for substantial contribution to climate change mitigation and/or climate change adaptation.
Do no significant harm requirements met (column 27)
- Select whether the activity selected in column 1 meets the criteria set out under the sustainable finance taxonomy (the Climate Delegated Act (Annexes I and II) in the case of the EU Taxonomy) to demonstrate no significant harm to other environmental objectives.
- You should take into account both the environmental impact of the activity itself and of the products and services provided by that activity.
- If an activity selected in column 1 substantially contributes to both climate change mitigation and climate change adaptation, select ‘Yes’ in this column only if no significant harm is demonstrated against both objectives under the sustainable finance taxonomy.
- For activities that are reported as both taxonomy-aligned and taxonomy-eligible but not aligned (i.e., that you are reporting under two separate rows), select whether the proportion of the activity reported in this row meets the do no significant harm criteria, as per your selection in column 3 “Taxonomy alignment”.
- Companies disclosing alignment against the EU Taxonomy for Sustainable Activities should refer to Section III of the EU Commission FAQs (p67- 76) for further guidance on the do no significant harm criteria.
Details of do no significant harm analysis (column 28)
- If you selected “Yes” in column 27, describe how the activity met the do no significant harm criteria for climate change mitigation and/or climate change adaptation.
- If you selected “No”, in column 27, explain why the activity did not meet the do no significant harm criteria for climate change mitigation and/or climate change adaptation.
Minimum safeguards compliance requirements met (column 29)
- Select whether the activity selected in column 1 complies with international best practices for sustainable business and social safeguards such as the:
- OECD Guidelines for Multinational Enterprises,
- UN Guiding Principles on Business and Human Rights,
- ILO Declaration on the Fundamental Principles and Rights at Work; and
- International Bill of Human Rights.
- For activities that are both taxonomy-aligned and taxonomy-eligible but not aligned (i.e., that you are reporting under two separate rows), select whether the proportion of the activity reported in this row complies with international best practices for sustainable business and social safeguards, as per your selection in column 3 “Taxonomy Alignment”.
Details of minimum safeguards compliance analysis (column 30)
- If you selected “Yes” in column 29, describe how the activity complies with international best practices for sustainable business and social safeguards.
- If you selected “No”, in column 29, you may wish to explain why the activity does not comply with international best practices for sustainable business and social safeguards.
Explanation of terms
- Turnover: 'net turnover' means the amounts derived from the sale of products and the provision of services after deducting sales rebates and value added tax and other taxes directly linked to turnover, as per Article 2(5) of Directive 2013/34/EU (The Accounting Directive). In case of reporting to the EU Taxonomy, please refer the explanation for ‘Key Performance Indicators’ below, for further information on the exact reporting requirements of the Turnover KPI.
- CAPEX: A measure of the value of purchases of fixed assets such as property, buildings, an industrial plant, technology, or equipment. Put differently, CapEx is any type of expense that a company capitalizes, or shows on its balance sheet as an investment, rather than on its income statement as an expenditure. In case of reporting to the EU Taxonomy, please refer the explanation for ‘Key Performance Indicators’ below, for further information on the exact reporting requirements of the CAPEX KPI.
- OPEX: Operating expenditure includes direct non-capitalized costs that relate to research and development, building renovation measures, short-term lease, maintenance and repair, and any other direct expenditures relating to the day-to-day servicing of assets of property, plant and equipment by the undertaking or third party to whom activities are outsourced that are necessary to ensure the continued and effective functioning of such assets. In case of reporting to the EU Taxonomy, please refer the explanation for ‘Key Performance Indicators’ below, for further information on the exact reporting requirements of the OPEX KPI.
- Taxonomy-eligible but not aligned: An activity is considered ‘taxonomy-eligible but not aligned’ if your organization generates turnover or invests in capital or operating expenditure corresponding to an activity listed in column 1, but the activity does not meet the technical screening criteria and/or do no significant harm criteria prescribed by the sustainable finance taxonomy and/or does not comply with international best practices for sustainable business and social safeguards.
- Taxonomy-aligned: An activity is considered ‘taxonomy-eligible but not aligned’ if, your organization generates turnover or invests in capital or operating expenditure corresponding to such activities in column 1, and the activity meets the technical screening criteria and do no significant harm criteria prescribed by the sustainable finance taxonomy and complies with international best practices for sustainable business and social safeguards.
- Substantial contribution: A taxonomy-eligible activity is said to substantially contribute to one or more environmental objectives under a taxonomy when it, through its own performance, meets the corresponding technical screening criteria set out by the relevant taxonomy. In relation to the EU Taxonomy for Sustainable Activities this refers to the technical screening criteria established by the Climate Delegated Act (Annexes I and II).
- Do no significant harm: A taxonomy-eligible activity that substantially contributes to one or more of the taxonomy’s objectives and complies with international best practices for sustainable business and social safeguards may only qualify as an environmentally sustainable (i.e., ‘taxonomy-aligned’) if it does not cause significant harm to any other environmental objective. In relation to the EU Taxonomy for Sustainable Activities, this refers to the conditions specified under Article 17 of the EU Taxonomy Regulation.
- Minimum safeguards: A taxonomy-eligible activity that substantially contributes to one or more of the taxonomy’s objectives and does not cause significant harm to any other environmental objective may only qualify as an environmentally sustainable (i.e., ‘taxonomy-aligned’) if it complies with international best practices for sustainable business and social safeguards. In relation to the EU Taxonomy for Sustainable Activities, these refer to the OECD Guidelines for Multinational Enterprises and the UN Guiding Principles on Business and Human Rights, including the principles and rights set out in the eight fundamental conventions identified in the Declaration of the International Labour Organization on Fundamental Principles and Rights at Work and the International Bill of Human Rights.
- Key Performance Indicators (KPIs): In relation to the EU Taxonomy for Sustainable Activities, the KPIs refer to the proportion of the turnover, capital expenditure (CAPEX) and operating expenditure (OPEX) related to assets or processes associated with environmentally sustainable economic activities. For each of the Turnover KPI, CAPEX KPI, OPEX KPI this refers to the numerator divided by the denominator as specified by the Disclosure Delegated Act (Annex I pg 17- 19).
Example Response
Example 1: Company A reports turnover associated with an activity which is taxonomy eligible but not aligned with the EU Taxonomy. The activity is not aligned as it does not meet the DNSH requirements prescribed under the taxonomy.
| 1
|
2
|
3
|
4
|
9
|
10
|
| Economic activity
|
Taxonomy under which information is being reported
|
Taxonomy Alignment
|
Financial metric(s)
|
Taxonomy-eligible but not aligned turnover from this activity in the reporting year (unit currency as selected in C0.4)*
|
Taxonomy-eligible but not aligned turnover from this activity as % of total turnover in the reporting year*
|
| Manufacture of renewable energy technologies
|
EU Taxonomy
for Sustainable Activities
|
Taxonomy-eligible but not aligned
|
Turnover
|
250,500
|
9
|
| 24
|
25
|
26
|
27
|
28
|
29
|
30
|
| Calculation
methodology and supporting information
|
Technical
screening criteria met
|
Details
of technical screening criteria analysis
|
Do
no significant harm requirements met
|
Details
of do no significant harm analysis
|
Minimum safeguards compliance requirements met
|
Details
of minimum safeguards compliance analysis
|
| Based on a detailed analysis of our economic activities and products in solar PVC and CSP manufacturing, we have assigned them to the EU Taxonomy activity ‘Manufacture of renewable energy technologies’. We generate 9% of our total turnover from the manufacture of renewable energy technologies eligible under the taxonomy, such as solar PV cells, inverters, and thermal storage systems. This figure represents our net turnover from products or services associated with PVC and CSP manufacturing, including intangible assets, IP licensing, and R&D, divided by our total net turnover. The solar PVC and CSP activities considered here are found to be fully taxonomy-eligible, without any operations that are non-eligible.
|
Yes
|
Solar PVC and CSP fall within the definition of ‘renewable energy’ under Directive (EU) 2018/2001. Therefore, the manufacture of solar PVC and CSP technologies meets the technical screening criteria requirement for activities falling under ‘Manufacture of renewable energy technologies’ outlined in Annex I of the Climate Delegated Act.
|
No
|
To address the DNSH criteria under ‘Manufacture of renewable energy technologies’, we performed a detailed climate risks and vulnerability assessment based on climate projections appropriate to the lifespan and scale of our business activities. We assessed physical risks from the manufacture of CSP and solar PV cells such as water stress and the emission of toxic chemicals to water, and installed water treatment and recycling equipment as adaptation measures to address these risks.
We also performed an environmental impact assessment to identify threats of habitat loss and fragmentation and implemented measures based on the mitigation hierarchy, to avoid operations in biodiversity sensitive areas and mitigate damage where necessary. Please refer to our annual sustainability report (attached) to find a detailed summary of our EIA.
Due to limited resources, our vulnerability assessment report does not, at this stage, include an assessment of the scope for reuse and use of secondary raw material components in our manufactured products, which is a DNSH requirement for transition to a circular economy. We therefore do not meet all the DNSH requirements outlined in the Climate Delegated Act. However, we have included plans for assessing and adopting waste management measures to prioritize recycling over disposal of material.
|
Yes
|
We assessed compliance across 12 manufacturing sites in 3 countries. We adhere to the minimum safeguards criteria through a human rights risk assessment based on the UN Guiding Principles on Business and Human Rights. Risk specific measures identified from the analysis will be implemented by the end of 2023.
|
Example 2: Company B reports turnover and CAPEX associated with an activity which is aligned with the EU Taxonomy because it meets all the criteria prescribed under the taxonomy to make a substantial contribution to climate change mitigation based on own performance.
| 1
|
2
|
3
|
4
|
5
|
6
|
8
|
| Economic activity
|
Taxonomy under which information is being reported
|
Taxonomy Alignment
|
Financial
metric(s)
|
Taxonomy-aligned turnover from this activity in the reporting year (unit currency as selected in C0.4)*
|
Taxonomy-aligned turnover from this activity as % of total turnover in the reporting year*
|
Taxonomy-aligned turnover from this activity that substantially contributed to climate change adaptation as a % of total turnover in the reporting year*
|
| Electricity generation from bioenergy
|
EU Taxonomy for Sustainable Activities
|
Taxonomy- aligned
|
|
520,500
|
14
|
14
|
| 11
|
12
|
13
|
14
|
23
|
24
|
| Taxonomy-aligned
CAPEX from this activity in the reporting year (unit currency as selected in
C0.4)*
|
Taxonomy-aligned
CAPEX from this activity as % of total CAPEX in the reporting year*
|
Taxonomy-aligned
CAPEX from this activity that substantially contributed to climate change
mitigation as a % of total CAPEX in the reporting year*
|
Taxonomy-aligned
CAPEX from this activity that substantially contributed to climate change
adaptation as a % of total CAPEX in the reporting year*
|
Type(s)
of substantial contribution*
|
Calculation
methodology and supporting information
|
| 35,000
|
12
|
12
|
0
|
Own performance
|
14%
our total turnover in the reporting year can be attributed to the sale of
renewable electricity generated from biogas and bioliquids. 12% of our total
CAPEX in the reporting year was also associated with the construction of new
bioenergy power generation plants.
|
| 25
|
26
|
27
|
28
|
29
|
30
|
| Technical
screening criteria met
|
Details
of technical screening criteria analysis
|
Do
no significant harm requirements met
|
Details
of do no significant harm analysis
|
Minimum safeguards compliance requirements met
|
Details
of minimum safeguards compliance analysis
|
| Yes
|
Our electricity generation installations generate a total rated thermal
input of 90 MW which meets the energy efficiency level associated with the best
available techniques (BAT) conclusions for large combustion plants, as per the
technical screening criteria outlined in Annex I of the Climate Delegated Act.
|
Yes
|
Plants which are located within zones that do not comply with the
air quality limit values prescribed by Directive 2008/50/EC implement measures
to reduce emission levels, taking into account the results of the information
exchange published by the EU Commission in accordance with Directive (EU)
2015/2193. A climate risk and
vulnerability assessment proportionate to the scale of the plants was conducted
and the results published in our sustainability report (attached).
Environmental degradation risks related to preserving water quality and
avoiding water stress are identified and addressed in an Environmental Impact
Assessment report (also attached), along with mitigation and compensation
measures identified for biodiversity areas affected.
|
Yes
|
We have 20 production sites in 4 countries. We
adhere to the minimum safeguards criteria through a human rights risk
assessment based on the UN Guiding Principles on Business and Human Rights.
Risk-specific measures identified from the analysis will be implemented by the
end of 2023.
|
Example 3: Company C reports turnover associated with an activity which is aligned with the EU Taxonomy because it meets all the criteria prescribed under the taxonomy to make a substantial contribution to multiple objectives – contributing to climate change mitigation based on own performance, and enabling climate change adaptation.
| 1
|
2
|
3
|
4
|
5
|
6
|
8
|
| Economic activity
|
Taxonomy under which information is being reported
|
Taxonomy alignment
|
Financial metric(s)
|
Taxonomy-aligned turnover from this activity in the reporting year (unit currency as selected in C0.4)*
|
Taxonomy-aligned turnover from this activity as % of total turnover in the reporting year*
|
Taxonomy-aligned turnover from this activity that substantially contributed to climate change adaptation as a % of total turnover in the reporting year*
|
| Afforestation
|
EU Taxonomy for Sustainable Activities
|
Taxonomy- aligned
|
Turnover
|
80,000
|
5
|
4
|
| 23 | 24 | 25 | 26 | 28 | 28 |
| Type(s) of substantial contribution* | Calculation methodology and supporting information | Technical screening criteria met | Details of technical screening criteria analysis | Do no significant harm requirements met | Details of do no significant harm analysis
|
|---|
- Own performance
- Activity enabling
climate change mitigation
| Of the
taxonomy-eligible revenue from our activities, we assess the taxonomy-aligned
sales from silviculture and logging associated with the category of
‘Afforestation’ under the EU Taxonomy to be 4% of the total net turnover from
our activities. Additionally, we assess 1% turnover resulting from the sale of
drought-resistant seeds and saplings, given that the afforested land is
classified as a drought prone area as per the national remote sensing records.
In our
assessment of taxonomy-eligible turnover, we only consider external sale of
forestry products and not internal revenue generated by sale of products within
the value chain of our enterprise. We have accounted for this latter revenue as
part of the total taxonomy non-eligible turnover.
| Yes | We have complied with the technical screening criteria by publishing a detailed afforestation plan and a subsequent forest management plan, fully aligned with the national laws on environmental impact assessment (available on our website). We have also published a detailed climate benefit analysis which demonstrates below-baseline GHG emissions since the start of the activity 10 years ago, when compared to a business-as-usual scenario in the absence of the afforestation activity over the same time period. The climate benefit analysis report (attached) also details the benefits to the local farming community during dry months from the sale of drought-prone seeds and saplings. We have also published the latest external audit report conducted by the FSC on our website.
| Yes | We comply with the DNSH requirement for pollution prevention and control by implementing and monitoring alternative techniques and approaches to minimize the use of chemical fertilizers and pesticides. We also document records of chemical pesticides to verify our compliance with EU Regulation 2019/1021 and international legal frameworks such as the Rotterdam Convention.
We also comply with the DNSH requirement for protection and restoration of biodiversity and ecosystems. Our forest management plan outlines a plan for enhancing biodiversity in accordance with the national law, including measures to tackle the spread of invasive species. We have also published our EIA report on our website.
We also comply with DNSH requirement for both climate change mitigation and adaptation by meeting the TSC for these objectives.
|
| 29
|
30
|
| Minimum safeguards compliance requirements met
|
Details
of minimum safeguards compliance analysis
|
| Yes
|
We have 10 afforestation sites across 2
countries. We adhere to the minimum safeguards criteria through a human rights
risk assessment based on the UN Guiding Principles on Business and Human
Rights. Risk-specific measures identified from the analysis will be implemented
by the end of 2023.
|
(C3.5c) Provide any additional contextual and/or verification/assurance information relevant to your organization’s taxonomy alignment.
Question dependencies
This question only appears if “Yes, we identify alignment with a sustainable finance taxonomy” or “Yes, we identify alignment with both our climate transition plan and a sustainable finance taxonomy” is selected in response to column 1 of C3.5.
Change from last year
New question
Rationale
This question helps CDP data users interpret the information companies provide on the alignment of their spending/revenue with a sustainable finance taxonomy. Assurance and verification provides confidence in the accuracy of data reported.
Ambition: Companies are transparent about their approach to assessing alignment with sustainable finance taxonomies and the alignment is verified/assured by a third party.
This is an open text question with a limit of 5,000 characters.
General
- You may use this question to report, for example:
- Information related to the scope of your activities subjected to taxonomy evaluation. You may report information on your activities that do not fall within the scope of taxonomy-eligible activities listed in column 1 of C3.5b.
- Any underlying assumptions made to determine your taxonomy-eligible activities.
- The financial accounting system used to calculate the figures for turnover, CAPEX and, where relevant, OPEX in questions C3.5a and C3.5b.
- A self-assessment of your overall alignment with the sustainable finance taxonomy.
- Any other information you see as relevant to data users. If you are disclosing against the EU Taxonomy for Sustainable Activities, you may report contextual information on the turnover, CAPEX and OPEX KPIs as specified by the Disclosure Delegated Act (Annex I, p20).
- You may also use this question to indicate whether any of the information provided in question C3.5a and/or C3.5b has been verified/assured by a third party, and the level of assurance thereof. You should also indicate this in question C10.2a.
C4 Targets and performance
Module Overview
Questions in this module focus on emissions and low-carbon energy targets, additional climate-related targets, net-zero targets, and details on emission reduction initiatives and low-carbon products.
Target setting provides direction and structure to environmental strategy. Providing information on quantitative targets and qualitative goals, and progress made against these targets, can demonstrate your organization’s commitment to improving climate-related issues management at a corporate level. This information is relevant to investors’ understanding of how your company is addressing and monitoring progress regarding the risks and opportunities disclosed.
Questions on emission reduction initiatives allow CDP data users to understand the organization’s commitment to reducing emissions beyond business-as-usual scenario.
Questions on low-carbon products provide valuable information to investors who are seeking to increase their investment in companies providing low-carbon and climate resilient goods and services.
Note for agricultural sectors:
The ‘Land management practices’ section includes questions around both adaptation and mitigation mechanisms adopted by companies to address climate change. This information demonstrates that organizations are committed to using practices that help reducing emissions and improve their resilience. Organizations can report up to 20 practices adopted on their land. Those practices that have brought or are expected to bring the largest benefits should be prioritized.
Key changes
- Modified questions:
- C4.1a – new columns requesting a breakdown of target coverage by scope 3 category, and whether the target includes land-related or bioenergy emissions.
- C4.1b – new columns requesting a breakdown of target coverage by scope 3 category, and whether the target includes land-related or bioenergy emissions.
- [Financial Services Only] C-FS4.1d – new columns added on portfolio coverage metrics and frequency of target reviews.
- Modified guidance:
- C4.2a – clarification that in the “Please explain…” column, companies should state whether their target covers all electricity consumption or only purchased electricity.
- C-CO4.2d and C-CO4.2d – guidance updated to request that companies reporting a separate methane reduction target in C4.1a/b provide details of the target in C-CO4.2d/C-OG4.2d.
- C4.3b – has additional guidance that companies reporting biofuels or biogas initiatives should indicate if they are using bioenergy with carbon capture and storage (BECCS).
- C-CO4.8 and C-OG4.8 – guidance updated to request that where flaring is not relevant to a company’s operations, they include examples and timelines in their explanation of why it is not relevant.
Click here for a list of all changes made this year.
Sector-specific content
Additional questions on targets, initiatives, and best available techniques for the following high-impact sectors:
- Agricultural commodities
- Cement
- Coal
- Electric utilities
- Food, beverage & tobacco
- Oil & gas
- Paper and forestry
- Steel
Pathway diagram - questions
This diagram shows the general questions contained in module C4. To access question-level guidance, use the menu on the left to navigate to the question.
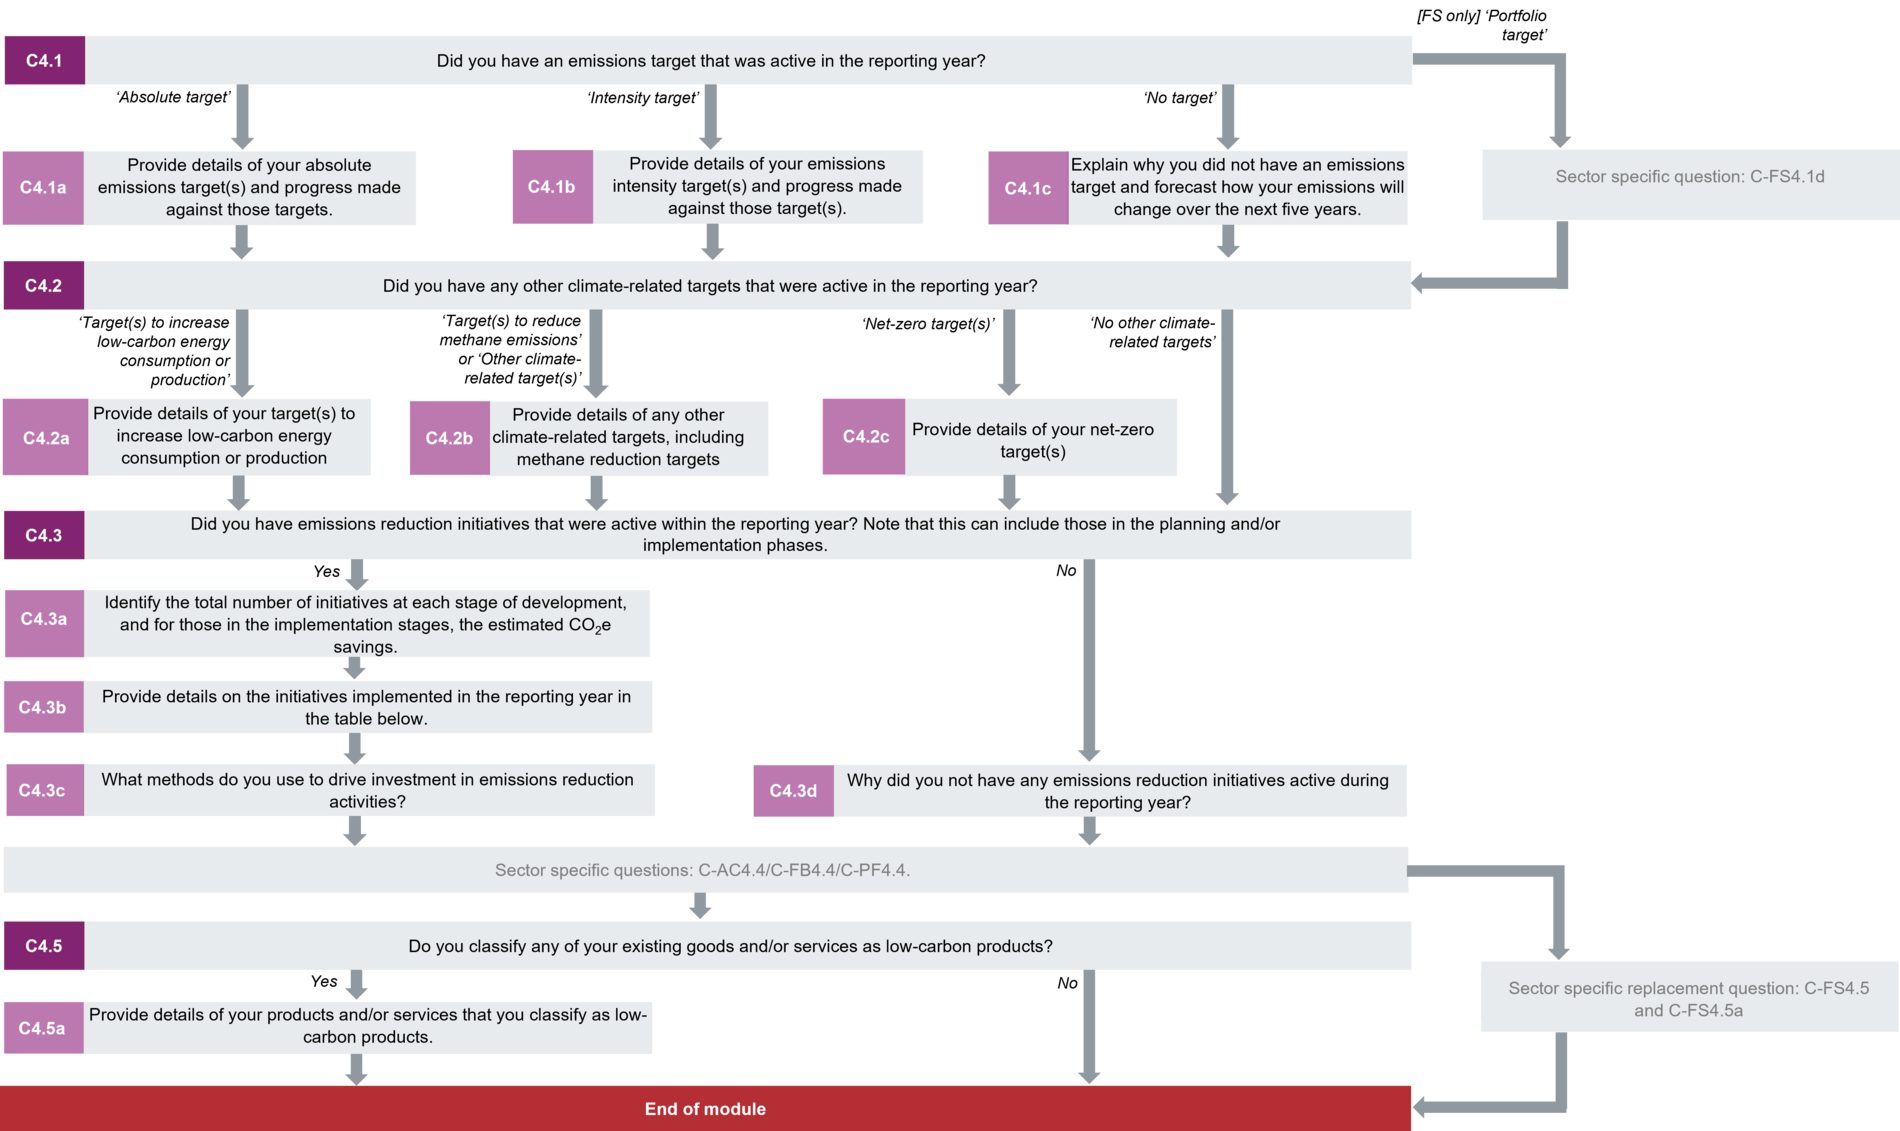
Emissions targets
(C4.1) Did you have an emissions target that was active in the reporting year?
Change from last year
No change
Rationale
Target setting provides direction and structure to environmental strategy. CDP data users want to understand companies' commitments to reducing emissions and whether the organization has a goal towards which they are harmonizing and focusing emissions-related efforts.
Connection to other frameworks
SDG
Goal 7: Affordable and clean energy
Goal 12: Responsible consumption and production
TCFD
Metrics & Targets recommended disclosure c) Describe the targets used by the organization to manage climate related risks and opportunities and performance against targets.
S&P Global Corporate Sustainability Assessment
TCFD Disclosure
NZAM (FS Only)
Commitment 1
Response options
Select all that apply:
- Absolute target
- Intensity target
- Portfolio target [FS only]
- No target
Requested content
General
- Targets that are based on a future “business as usual” year are not equivalent to emissions reduction targets and therefore should not be reported here. Acceptable targets must determine emissions reductions through comparison to a set base year in the past, not to a projected “business as usual” emissions figure in the future.
- You have an “active target” if the target ends in or after the reporting year and the target is to reduce absolute emissions or emissions intensity.
- Absolute target: an absolute target describes a reduction in actual emissions in a future year when compared to a base year. The target can relate to your Scope 1, Scope 2 and/or Scope 3 emissions in full or in part.
- Intensity target: an intensity target describes a future reduction in emissions that have been normalized to a business metric when compared to the same normalized business metric emissions in a base year. The target can relate to your Scope 1, Scope 2 and/or Scope 3 emissions in full or in part.
- [Financial Services only] Portfolio target: a portfolio target describes a reduction of the impact of your lending, investment and/or insurance underwriting portfolios (e.g. portfolio emissions) on the climate.
Note for oil and gas sector companies:
- Investors request that companies disclose both company-wide targets and targets at the divisional level.
Note for electric utility sector companies:
- Investors request that companies disclose company-wide targets and, where applicable, at divisional level, and that intensity targets are also expressed as absolute targets where possible.
Note for transport OEMs sector companies:
- In addition to any absolute targets, companies should disclose company-wide CO2 and/or fuel economy targets for products and, where relevant, for specific markets. Targets should be expressed in grams of CO2 per kilometer.
Note for financial services sector companies:
- Consider any target types related to your lending, investment and insurance portfolios, in addition to targets related to Scope 1, Scope 2 and other Scope 3 emissions.
Note for capital goods sector companies:
- Companies should consider reporting company-wide and/or product-level Scope 3 targets, and in particular, Scope 3 targets relating to the use of sold products.
Additional information
Examples of emissions reduction targets
The following are examples of absolute targets:
- Metric tons CO2e or % reduction from base year
- Metric tons CO2e or % reduction in product use phase relative to base year
- Metric tons CO2e or % reduction in supply chain relative to base year
- Metric tons CO2e or % reduction per year
- Metric tons CO2e or % reduction relative to 5 year rolling average of emissions
- Cap on emissions in metric CO2e
The following are examples of intensity targets:
- Metric tons CO2e or % reduction per unit revenue (also per unit turnover; per unit gross sales) relative to base year
- Metric tons CO2e or % reduction per full-time employee equivalent (also per hours worked; per operating hour; per guest night; per capita; per patient days) relative to base year
- Metric tons CO2e or % reduction per unit of product (e.g. metric ton of paper; metric ton of aluminum) relative to base year
- Metric tons CO2e or % reduction per passenger kilometer (also per km; per nautical mile) relative to base year
- Metric tons CO2e or % reduction per square foot relative to base year
- Cap on emissions relative to an activity (e.g. stabilizing emissions at x metric tons CO2e per metric to of steel produced)
- Metric tons CO2e or % reduction per MWh
- Metric tons CO2e or % reduction in emissions from business flights per employee
(C4.1a) Provide details of your absolute emissions target(s) and progress made against those targets.
Question dependencies
This question only appears if you select “Absolute target” in response to C4.1.
Change from last year
Modified question
Rationale
The question is aimed at encouraging best practice in target setting, such as the use of science-based targets where available.
Ambition: Companies make progress against emissions targets that reflect their full emissions inventory, and are line with SBTi criteria.
Connection to other frameworks
SDG
Goal 7: Affordable and clean energy
Goal 12: Responsible consumption and production
Goal 13: Climate action
TCFD
Metrics & Targets recommended disclosure c) Describe the targets used by the organization to manage climate related risks and opportunities and performance against targets.
S&P Global Corporate Sustainability Assessment
Climate-Related Targets
TCFD Disclosure
NZAM (FS only)
Commitment 1
Response options
Please complete the following table. The table is displayed over several rows for readability. You are able to add rows by using the “Add Row” button at the bottom of the table.
| 1
|
2
|
3
|
4
|
5
|
6
|
7
|
| Target reference number
|
Is this a science-based target?
|
Target ambition*
|
Year target was set
|
Target coverage
|
Scope(s)
|
Scope 2 accounting method
|
| Abs1-Abs100
|
Select from drop-down options below
|
Select from:
- 1.5°C aligned
- Well-below 2°C aligned
- 2°C aligned
- Other, please specify
|
Numerical field [enter a number between 1900- 2023]
|
Select from:
- Company-wide
- Business division
- Business activity
- Site/facility
- Country/area/region
- Product-level
- Other, please specify
|
Select all that apply:
|
Select from:
- Location-based
- Market-based
|
| 8
|
9
|
10
|
11
|
12-28
|
29
|
30
|
Scope 3 category(ies)
|
Base year
|
Base year Scope 1 emissions covered by target (metric tons CO2e)
|
Base year Scope 2 emissions covered by target (metric tons CO2e)
|
Base year Scope 3, Category […] emissions covered by target (metric tons CO2e)* [One column for each Scope 3 category]
|
Base year total Scope 3 emissions covered by target (metric tons CO2e)
|
Total base year emissions covered by target in all selected Scopes (metric tons CO2e)
|
Select all that apply:
- Category 1: Purchased goods and services
- Category 2: Capital goods
- Category 3: Fuel-and-energy-related activities (not included in Scopes 1 or 2)
- Category 4: Upstream transportation and distribution
- Category 5: Waste generated in operations
- Category 6: Business travel
- Category 7: Employee commuting
- Category 8: Upstream leased assets
- Category 9: Downstream transportation and distribution
- Category 10: Processing of sold products
- Category 11: Use of sold products
- Category 12: End-of-life treatment of sold products
- Category 13: Downstream leased assets
- Category 14: Franchises
- Category 15: Investments [does not appear to FS]
- Other (upstream)
- Other (downstream)
|
Numerical field [enter a number between 1900- 2023]
|
Numerical field [enter a number from 0-999,999,999,999 using a maximum of 3 decimal places and no commas]
|
Numerical field [enter a number from 0-999,999,999,999 using a maximum of 3 decimal places and no commas]
|
Numerical field [enter a number from 0-999,999,999,999 using a maximum of 3 decimal places and no commas]
|
Numerical field [enter a number from 0-999,999,999,999 using a maximum of 3 decimal places and no commas]
|
Numerical field [enter a number from 0-999,999,999,999 using a maximum of 3 decimal places and no commas]
|
| 31
|
32
|
33-49
|
50
|
51
|
| Base year Scope 1 emissions covered by target as % of total base year emissions in Scope 1
|
Base year Scope 2 emissions covered by target as % of total base year emissions in Scope 2
|
Base year Scope 3, Category […] emissions covered by target as
% of total base year emissions in Scope 3, Category […] (metric tons CO
2e)* [One column for each Scope 3 category]
|
Base year Scope 3 emissions covered by target as % of total base year emissions in Scope 3 (in all Scope 3 categories)
|
Base year emissions covered by target in all selected Scopes as % of total base year emissions in all selected Scopes
|
| Percentage field [enter a percentage from 0-100 using a maximum of 3 decimal places]
|
Percentage field [enter a percentage from 0-100 using a maximum of 3 decimal places]
|
Percentage field [enter a percentage from 0-100 using a maximum of 3 decimal places]
|
Percentage field [enter a percentage from 0-100 using a maximum of 3 decimal places]
|
Percentage field [enter a percentage from 0-100 using a maximum of 3 decimal places]
|
| 52
|
53
|
54
|
55
|
56
|
57-73
|
74
|
| Target year
|
Targeted reduction from base year (%)
|
Total emissions in target year covered by target in all selected Scopes (metric tons CO2e)
[auto-calculated]
|
Scope 1 emissions in reporting year covered by target (metric tons CO2e)
|
Scope 2 emissions in reporting year covered by target (metric tons CO2e)
|
Scope 3, Category […] emissions in reporting year covered by target (metric tons CO2e) [One column for each Scope 3 category]
|
Total Scope 3 emissions in reporting year covered by target (metric tons CO2e)
|
| Numerical field [enter a whole number between 2018- 2100]
|
Percentage field [enter a percentage from 0-100 using a maximum of 2 decimal places]
|
Numerical field [0-999,999,999,999]
|
Numerical field [enter a number from 0-999,999,999,999 using a maximum of 3 decimal places and no commas]
|
Numerical field [enter a number from 0-999,999,999,999 using a maximum of 3 decimal places and no commas]
|
Numerical field [enter a number from 0-999,999,999,999 using a maximum of 3 decimal places and no commas]
|
Numerical field [enter a number from 0-999,999,999,999 using a maximum of 3 decimal places and no commas]
|
| 75
|
76
|
77
|
78
|
79
|
80
|
81
|
| Total emissions in reporting year covered by target in all selected scopes (metric tons CO2e)
|
Does this target cover any land-related emissions?
|
% of target achieved relative to base year
[auto-calculated]
|
Target status in reporting year
|
Please explain target coverage and identify any exclusions
|
Plan for achieving target, and progress made to the end of the reporting year
|
List the emissions reduction initiatives which contributed most to achieving this target
|
| Numerical field [enter a number from 0-999,999,999,999 using a maximum of 3 decimal places and no commas]
|
Select from:
- Yes, it covers land-related emissions only (e.g. FLAG SBT)
- Yes, it covers land-related and non-land related emissions (e.g. SBT approved before the release of FLAG target-setting guidance)
- Yes, it covers land-related CO2 emissions/removals associated with bioenergy and non-land related emissions (e.g. non-FLAG SBT with bioenergy)
- No, it does not cover any land-related emissions (e.g. non-FLAG SBT)
|
Percentage field
|
Select from:
- New
- Underway
- Achieved
- Expired
- Revised
- Replaced
- Retired
|
Text field [maximum 5,000 characters]
|
Text field [maximum 2,500 characters]
|
Text field [maximum 2,500 characters]
|
[Add Row]
*This column only appears if you select one of the “Yes…” options in column “Is this a science-based target?”
Is this a science-based target? (column 2) drop-down options:
Select one of the following options:
- Yes, and this target has been approved by the Science Based Targets initiative
- Yes, we consider this a science-based target, and the target is currently being reviewed by the Science Based Targets initiative
- Yes, we consider this a science-based target, and we have committed to seek validation of this target by the Science Based Targets initiative in the next two years
- Yes, we consider this a science-based target, but we have not committed to seek validation of this target by the Science Based Targets initiative within the next two years
- No, but we are reporting another target that is science-based
- No, but we anticipate setting one in the next two years
- No, and we do not anticipate setting one in the next two years
Requested content
General
- Note that CDP is requesting data on gross emissions targets. Gross means total emissions before any deductions or other adjustments are made to take account of offset credits, avoided emissions, and/or reductions attributable to the sequestration or transfer of GHGs (except in a specific case of bioenergy use for science-based targets and SBTi-approved FLAG targets, which include both emissions and removals from land – see “Additional information” for more details).
- If you have a target that will be met in part by offsetting (including carbon neutrality targets), or CO2 removals except for the bioenergy and SBTi-approved FLAG target cases specified in “Additional information”, only the proportion of the target that relates to emissions reductions (and not offset purchases or CO2 removals) should be reported here. If you are uncertain of the proportion that will be achieved through emissions reductions, make an estimation based on the initiatives that you have in place or planned. Targets to reduce emissions in the product use phase or to reduce emissions from the supply chain should be captured as scope 3 targets.
- If the details of your target differ between the scopes (e.g. if the temperature alignment of your scope 1+2 target is consistent with a 1.5°C-aligned pathway and the temperature alignment of your scope 3 target is consistent with a well-below 2°C-aligned pathway), report separate rows for the scope(s) for which the target differs.
- If you intend to report a net-zero target in C4.2c, you should report both the near-term and long-term emissions reduction target(s) associated with your net-zero target either in this question or in C4.1b, and link them to your net zero target in column 3 of C4.2c. Please refer to the SBTi Net-Zero Standard for information on science-based net-zero targets.
Target reference number (column 1)
- Select a unique target reference from the drop-down menu provided to identify the target in subsequent questions and to track progress against the target in subsequent reporting years.
- If you reported a target to CDP last year and will be reporting progress against the same target this year, ensure you use the same target reference number as last year. For any new targets you are adding, always use a new reference number that you have not used previously.
Is this a science-based target? (column 2)
- A brief description of science-based targets and why CDP is asking companies to set them is provided as additional information to this question.
- In addition, refer to the CDP Technical Note on Science-Based Targets for what qualifies as a science-based target and how to assess your target against the Science Based Targets initiative’s criteria.
- Companies with activities in the oil and gas sector for which there is no available sector methodology to determine whether a target is science-based should select the most appropriate ‘No…” option in this column. For more information on sector-specific requirements, see pages 14-21 of the SBTi Criteria.
- Yes, and this target has been approved by the Science Based Targets initiative – Companies are very strongly encouraged to have their targets officially evaluated by the Science Based Targets initiative (SBTi). CDP considers targets approved by the initiative to reflect best practice in science-based target setting. Select this option only if the target has been approved by the SBTi.
- Yes, we consider this a science-based target, and the target is currently being reviewed by the Science Based Targets initiative – If your company has set a target and has self-assessed it to be science-based, it has been submitted to the SBTi for validation and is currently being reviewed by the SBTi, you should select this option. You should use the “Please explain target coverage and identify any exclusions” column to explain why you consider your target to be science-based.
- Yes, we consider this a science-based target, and we have committed to seek validation of this target by the Science Based Targets initiative in the next two years – Not all companies have had their target assessed by the SBTi. If your company has set a target and has self-assessed it to be science-based but has not yet submitted it to the SBTi for validation, you should select this option. You should use the “Please explain target coverage and identify any exclusions” column to explain why you consider your target to be science-based. If you are currently in the process of revising your target to meet SBTi criteria, indicate this by selecting “No, but we anticipate setting one in the next two years.
- Yes, we consider this a science-based target, but we have not committed to seek validation of this target by the Science Based Targets initiative within the next two years – Not all companies intend to have their target assessed by the SBTi. If your company has set a target and has self-assessed it to be science-based but has not committed to submit it to the SBTi for validation, you should select this option. You should use the “Please explain target coverage and identify any exclusions” column to explain why you consider your target to be science-based. If you are a supplier to a company with a supplier engagement target, as part of which you have set a target in line with SBTi resources but are not planning to seek SBTi approval, select this option.
- No, but we are reporting another target that is science-based – Another target (absolute or intensity) disclosed is science-based, either in another row in this table, or in C4.1b.
- No, but we anticipate setting one in the next two years – While not necessary, it is recommended that the company publicly state this by submitting a Science Based Target initiative commitment letter.
- No, and we do not anticipate setting one in the next two years – No science-based targets have been set and there are no plans in place to set one in the next two years.
Target ambition (column 3)
- This column only appears if you select any “Yes” option in column 2 “Is this a science-based target?”.
- Select the level of ambition of your science-based target. Note that as of July 2022, the SBTi requires Scope 1 and 2 targets to be consistent with the level of decarbonization required to keep global temperature increase to 1.5°C compared to pre-industrial temperatures, and Scope 3 targets to be consistent with the level of decarbonization required to keep global temperature increase to well-below 2°C compared to pre-industrial temperatures.
- If your target is aligned with below 1.5°C compared to pre-industrial temperature temperatures, select “1.5°C aligned”.
Year target was set (column 4)
- Enter the year in which your company set the target.
- This must be either before or during the reporting year, but cannot be after the reporting year. It also cannot be after the target year.
- If the target is science-based and has been submitted to the SBTi for validation or has been approved by the SBTi (as indicated by your response to column 2), enter the year in which your organization submitted the target for validation by the SBTi.
- If you have a year-on-year rolling target, enter the year in which your company first set the target. This can be before the base year.
- If you set the target based on financial years, enter the year that applies to the end of your financial year and specify this in the “Please explain target coverage and identify any exclusions” column.
Target coverage (column 5)
- If the target applies to the whole company, select “Company-wide”. Note that “company” refers collectively to all the companies, businesses, organizations, other entities or groups that fall within your definition of the reporting boundary.
- It is considered best practice to report one overarching target covering total company-wide Scope 1 and 2 emissions. Sub-targets may also be reported in additional rows.
- If the target does not apply to the whole company, select the option that best describes the coverage of the target, and provide further details in the “Please explain target coverage and identify any exclusions” column. E.g. if your target applies only to your European operations, select “Country/area/region” in this column and specify the country/area/region in the “Please explain target coverage and identify any exclusions” column.
Scope(s) (column 6)
- This refers to the Scope(s) of emissions to which the target relates. Note that the target does not have to comprise all emissions within a particular Scope.
Scope 2 accounting method (column 7)
- This column only appears if you select “Scope 2” in column 6 “Scope(s)”.
- Indicate whether the target relates to your location-based or market-based Scope 2 emissions.
Scope 3 category(ies) (column 8)
- This column only appears if you select “Scope 3” in column 6 “Scope(s)”.
- Select the Scope 3 emissions category(ies) that relate to this target.
- For each Scope 3 category selected in this column, a corresponding column will appear for you to provide the category’s emissions in the base year (columns 12-28), % of total base year emissions covered (columns 33-49) and emissions in the reporting year (columns 57-73).
- The categories of Scope 3 emissions have been taken from the Greenhouse Gas Protocol’s Corporate Value Chain (Scope 3) Accounting and Reporting Standard. Refer to the Standard for additional information on the sources that each category comprises and how to calculate these emissions. If you are specifying a Scope 3 source under “Other, please specify” please make it clear whether it is an upstream or downstream source.
Base year (column 9)
- The base year is the year against which you are comparing your emissions reduction target.
- The base year cannot be after the reporting year
- If you have a year-on-year rolling target, the base year will be the previous reporting year.
- If you have a target based on financial years, enter the year that applies to the end of your financial year and specify this in the “Please explain target coverage and identify any exclusions” column.
- If you have a target based on average emissions over a period of time (e.g. 5-year average), enter the year that applies to the end of the average period and specify this in the “Please explain target coverage and identify any exclusions” column.
Base year Scope 1 emissions covered by target (metric tons CO2e) (column 10)
- This column only appears if you select “Scope 1” in column 6 “Scope(s)”.
- If the target encompasses multiple Scopes, this figure should be based upon the Scope 1 proportion only.
- E.g. if your target is to reduce Scope 1+2 emissions arising from your European operations, enter the base year Scope 1 emissions for your European operations in this column.
Base year Scope 2 emissions covered by target (metric tons CO2e) (column 11)
- This column only appears if you select “Scope 2” in column 6 “Scope(s)”.
- If the target encompasses multiple Scopes, this figure should be based upon the Scope 2 proportion only.
- E.g. if your target relates to Scope 1+2+3 company-wide emissions, enter your Scope 2 company-wide base year emissions in this column.
Base year Scope 3, Category […] emissions covered by target (metric tons CO2e) (column 12-28)
- A column will appear for each Scope 3 category selected in column 8.
Base year total Scope 3 emissions covered by target (metric tons CO2e) (column 29)
- This column only appears if you select “Scope 3” in column 6 “Scope(s)”.
- This figure should be the total Scope 3 base year emissions covered by the target for the Scope 3 category(ies) selected in column 8. It should equal the sum of the base year emissions you have entered for each Scope 3 category.
- If the target encompasses multiple Scopes, this figure should be based upon the Scope 3 proportion only.
- E.g. if your target relates to Scope 1+2+3 emissions of a particular business activity (e.g. office-based operations, etc.), enter the base year Scope 3 emissions relating to that business activity for the Scope 3 category(ies) selected in column 8 in this column.
Total base year emissions covered by target in all selected Scopes (metric tons CO2e) (column 30)
- This figure should be the total base year emissions covered by the target in all Scopes selected in column 6.
- E.g. if your target relates to Scope 1+2+3 company-wide emissions, enter your Scope 1+2+3 company-wide base year emissions in this column.
- If the target relates to a single Scope, this figure will be the same as the figure reported in either column 10, column 11, or column 29.
- If the target encompasses multiple Scopes, this figure will be equal to the sum of the figures reported in columns 10, 11 and/or 29.
Base year Scope 1 emissions covered by target as % of total base year emissions in Scope 1 (column 31)
- This column only appears if you select “Scope 1” in column 6 “Scope(s)”.
- Enter the base year Scope 1 emissions covered by the target (reported in column 10) as a percentage of your total company-wide base year emissions in Scope 1.
- If the target encompasses multiple Scopes, this percentage should be based upon the Scope 1 proportion only.
- E.g. if your target is to reduce Scope 1+2 emissions arising from your European operations, and the Scope 1 emissions from your European operations accounted for 80% of your total, company-wide Scope 1 emissions in the base year, then you should enter 80 into this column.
- Note that entering a value of 100% indicates that the target covers your company’s total, global gross emissions in the base year for Scope 1.
Base year Scope 2 emissions covered by target as % of total base year emissions in Scope 2 (column 32)
- This column only appears if you select “Scope 2” in column 6 “Scope(s)”.
- Enter the base year Scope 2 emissions covered by the target (reported in column 11) as a percentage of your total company-wide base year emissions in Scope 2.
- If the target encompasses multiple Scopes, this percentage should be based upon the Scope 2 proportion only.
- E.g. if your target relates to Scope 1+2+3 emissions of a particular business activity (e.g. office-based operations, etc.), and the Scope 2 emissions from that business activity accounted for 20% your total, company-wide Scope 2 emissions in the base year, then you should enter 20 into this column.
- Note that entering a value of 100% indicates that the target covers your company’s total, global gross emissions in the base year for Scope 2.
Base year Scope 3, Category […] covered by target as % of total base year emissions in Scope 3, Category […] (metric tons CO2e) (column 33-49)
- A column will appear for each Scope 3 category selected in column 8.
- Enter the base year Scope 3 category emissions covered by the target (reported in columns 12-18) as a percentage of your total company-wide base year emissions in that Scope 3 category.
- E.g. if your target covers the Scope 3 Category 1 emissions of one region which accounts for 50% of your total base year Scope 3 emissions in Category 1, enter “50”.
Base year total Scope 3 emissions covered by target as % of total base year emissions in Scope 3 (in all Scope 3 categories) (column 50)
- This column only appears if you select “Scope 3” in column 6 “Scope(s)”.
- Enter the base year Scope 3 emissions covered by the target (reported in column 29) as a percentage of your total company-wide base year emissions for all Scope 3 categories calculated in the base year.
- E.g. If you have selected only one Scope 3 category in column 8 (e.g. “Business travel”), you should enter the base year emissions in that category covered by the target as a percentage of your total base year Scope 3 emissions as a whole.
- If the target encompasses multiple Scopes, this percentage should be based upon the Scope 3 proportion only.
- Note that entering a value of 100% indicates that the target covers your company’s total, global gross emissions in the base year for Scope 3.
Base year emissions covered by target in all selected Scopes as % of total base year emissions in all selected Scopes (column 51)
- Enter the total base year emissions covered by the target (reported in column 30) as a percentage of your total company-wide base year emissions in all Scopes selected in column 6.
- If the target encompasses multiple Scopes, note that you should not sum the percentages reported in columns 31, 32 and/or 50.
- E.g. if your target relates to Scope 1+2+3 emissions for your UK operations, and the Scope 1+2+3 emissions from your UK operations accounted for 10% your total, company-wide Scope 1+2+3 emissions in the base year, then you should enter 10 into this column.
- If the target relates to a single Scope, this figure will be the same as the figure reported in either column 31, column 32, or column 50.
- Note that entering a value of 100% indicates that the target covers your company’s total, global gross emissions in the base year for all Scopes selected in column 6.
Target year (column 52)
- Enter the year that the target ends. For example, if the target is to reduce emissions by 50% by 2030, the target year is 2030.
- If you have a year-on-year rolling target, the target year will be the reporting year.
- If you have a target based on financial years, enter the year that applies to the end of your financial year and specify in the “Please explain target coverage and identify any exclusions” column.
- If you have a target based on average emissions over a period of time (e.g. 5-year average), enter the year that applies to the end of the average period and specify this in the “Please explain target coverage and identify any exclusions” column.
- You should not report any target that was achieved before the start of the reporting year.
Targeted reduction from base year (%) (column 53)
- Enter your targeted emissions reduction as a percentage reduction in emissions in all Scopes relevant to the target to be achieved in the target year, when compared to the base year.
- E.g. if your target is to reduce your Scope 1+2 emissions by 3000 metric tons CO2e and your base year Scope 1+2 emissions were 150,000 metric tons CO2e, you should enter 2 into this column (i.e. (3000/150000)=0.02; then multiply by 100 for percentage value).
- If your target is to stabilize emissions at the base year level, you should enter 0 in this column.
- Note that this column is intended to describe the targeted percentage reduction from the base year that is to be achieved in the target year, and not the percentage reduction from the base year observed in the reporting year.
Total emissions in target year covered by target in all selected Scopes (metric tons CO2e) [auto-calculated] (column 54)
- This column will be auto-calculated in the ORS.
- The total emissions in your target year covered by the target will be calculated from the “Total base year emissions covered by target in all selected Scopes” (column 30) and the “Targeted reduction from base year” (column 53) columns. Ensure that you have entered data into these columns.
- E.g. if your base year emissions were 150,000 metric tons CO2e, and your targeted reduction is 2%, this column will display 147,000.
Scope 1 emissions in reporting year covered by target (metric tons CO2e) (column 55)
- This column only appears if you select “Scope 1” in column 6 “Scope(s)”.
- If the target encompasses multiple Scopes, this figure should be based upon the Scope 1 proportion only.
- E.g. if your target is to reduce Scope 1+2 emissions arising from your European operations, enter the Scope 1 emissions in the reporting year for your European operations in this column.
Scope 2 emissions in reporting year covered by target (metric tons CO2e) (column 56)
- This column only appears if you select “Scope 2” in column 6 “Scope(s)”.
- If the target encompasses multiple Scopes, this figure should be based upon the Scope 2 proportion only.
- E.g. if your target relates to Scope 1+2+3 company-wide emissions, enter your Scope 2 company-wide emissions in the reporting year in this column.
Scope 3, Category […] emissions in reporting year covered by target (metric tons CO2e) (columns 57-73)
- A column will appear for each Scope 3 category selected in column 8.
- Note that emissions for all Scope 3 categories covered by a target should be reported every year.
Total Scope 3 emissions in reporting year covered by target (metric tons CO2e) (column 74)
- This column only appears if you select “Scope 3” in column 6 “Scope(s)”.
- This figure should be the total Scope 3 emissions in the reporting year covered by the target for the Scope 3 category(ies) selected in column 8. It should equal the sum of emissions in the reporting year you have entered for each Scope 3 category.
- If the target encompasses multiple Scopes, this figure should be based upon the Scope 3 proportion only.
- E.g. if your target relates to Scope 1+2+3 emissions of a particular business activity (e.g. office-based operations, etc.), enter the Scope 3 emissions in the reporting year relating to that business activity for the Scope 3 category(ies) selected in column 8 in this column.
Total emissions in reporting year covered by target in all selected Scopes (metric tons CO2e) (column 75)
- This figure should be the total emissions in the reporting year covered by the target in all Scopes selected in column 6.
- E.g. if your target relates to Scope 1+2+3 company-wide emissions, enter your Scope 1+2+3 company-wide emissions in the reporting year in this column.
- If the target relates to a single Scope, this figure will be the same as the figure reported in either column 55, column 56, or column 74.
- If the target encompasses multiple Scopes, this figure will be equal to the sum of the figures reported in columns 55, 56 and/or 74.
Does this target cover any land-related emissions? (column 76)
- A brief description of land-related emissions (i.e., GHG emissions from Agriculture, Forestry and Other Land Use (AFOLU)) is provided as additional information to this question.
- In addition, refer to the CDP Technical Note on Science-Based Targets for further detail and how to assess your target against the Science Based Targets initiative’s criteria.
- Yes, it covers land-related emissions only (e.g. FLAG SBT) – Select this option if your target only covers GHG emissions related to land and agriculture and excludes emissions and removals associated with bioenergy, in line with SBTi guidance. Companies that have followed the SBTi Forests, Land and Agriculture (FLAG) guidance to set their target should select this option. This option will primarily be applicable to companies in the Agricultural Commodities, Food, Beverage & Tobacco, and Paper & Forestry CDP sectors.
- Yes, it covers land-related and non-land related emissions (e.g. SBT approved before the release of FLAG target-setting guidance) – Select this option if your target covers both GHG emissions related to land and agriculture and non-land related emissions from energy/industry. This option will be primarily applicable to companies in the Agricultural Commodities, Food, Beverage & Tobacco and Paper and Forestry CDP sectors whose target was approved by the SBTi before the release of the SBTi FLAG target-setting guidance.
- Yes, it covers land-related CO2 emissions/removals associated with bioenergy and non-land related emissions (e.g. non-FLAG SBT with bioenergy) – Select this option if your target covers CO2 emissions from the combustion, processing and distribution phase of bioenergy and/or land use emissions and removals associated with bioenergy feedstocks, in addition to non-land related emissions from energy/industry. This option could apply to companies in any CDP sector with a target that includes emissions from bioenergy.
- No, it does not cover any land-related emissions (e.g. non-FLAG SBT) – Select this option if your target only covers non-land related emissions from energy/industry.
- If you select any “Yes…” option, specify the types of land-related emissions covered by the target in the “Please explain target coverage and identify any exclusions” column.
% of target achieved relative to base year [auto-calculated] (column 77)
- This column will be auto-calculated in the ORS.
- The target’s percentage completion (in terms of emissions) relative to the base year will be calculated from the “Total base year emissions covered by target in all selected Scopes” (column 30), “Targeted reduction from base year” (column 53) and the “Total emissions in reporting year covered by target in all selected Scopes” (column 75) columns. Ensure that you have entered data into these columns.
- E.g. if your target is to reduce your Scope 1 emissions by 10% and in the reporting year your Scope 1 emissions had reduced by 3% compared to the base year, this column will display 30 as your target is 30% complete.
- Negative values indicate an increase in emissions relative to the base year.
- Values greater than 100 indicate that you have exceeded your target.
- This column will not appear if you set a target to stabilize your greenhouse gas emissions at the base year level, i.e. if you have entered 0 (zero) in column “Targeted reduction from base year (%)” (column 53).
Target status in reporting year (column 78)
- New – Select this option for targets that have been set in the reporting year and are still in progress.
- Underway – Select this option for targets that were set before the reporting year, with a target year in the future, that have not been achieved and continue to be pursued.
- Achieved – Select this option for targets that have been achieved or exceeded in the reporting year.
- Expired – Select this option for targets with a target year of the reporting year, that have not been achieved and have therefore expired in the reporting year.
- Revised – Select this option for targets that were set before the reporting year but a revision has been made to any of the elements in columns 2 to 76 in the reporting year, for example due to a recalculation of the base year emissions or a change to the target year.
- Replaced – Select this option for previously reported targets that have been replaced with another target in the reporting year, for example where a facility target has been incorporated into a company-wide target.
- Retired – Select this option for targets with a target year in the future, that have not been achieved, but will no longer be pursued. Provide more information as to why this target was retired in the “Please explain target coverage and identify any exclusions” column.
Please explain target coverage and identify any exclusions (column 79)
- If the target is not company-wide (i.e. it does not apply to the whole company in line with your definition of the reporting boundary), provide further details of your target coverage in this column. E.g. if you have selected “Country/area/region” in column 5, please specify which countries/areas/regions your target covers.
- If you have excluded any relevant Scopes or Scope 3 categories from your target, state the reason for omitting these Scopes or Scope 3 categories and outline any steps you are taking to enable target-setting for relevant Scopes or Scope 3 categories.
- If you selected any “Yes…” option in column 76, specify the types of land-related emissions that are covered by the target from those listed below. Refer to the additional information and the SBTi FLAG Guidance for more information.
- Direct land use change emissions – All direct emissions from land use change, including those associated with livestock feed and conversion of natural forests to plantation. Includes CO2 emissions from land use change associated with deforestation and forest degradation, including conversion of natural forest to plantation following GHG Protocol definitions, and CO2 emissions from land use change associated with conversion of coastal wetlands (mangroves, seagrass and marshes); conversion, draining and/or burning of peatlands; and conversion of savannas and natural grasslands.
- Indirect land use change emissions – Carbon stock loss due to land conversion on lands not owned or controlled by the company or in its supply chain, induced by change in demand for products produced or sourced by the company.
- Land management emissions – All emissions from land management; CO2 emissions related to on-farm vehicles and fertilizer production are also included, as they are commonly embedded in accounting tools and emission factors associated with land management. Includes methane emissions from manure management, enteric fermentation, and flooded soil (for lowland rice); direct and indirect N2O emissions from manure management, crop residue, fertilizer application and fertilizer leaching, runoff and volatilization; methane and N2O emissions from agricultural waste burning; CO2 emissions from machinery used on farm and transport of biomass; and CO2 and N2O emissions from fertilizer production.
- Biological carbon removals and storage not associated with bioenergy feedstocks – Carbon sequestration from improved forest management, agroforestry, forest restoration, silvopasture, soil organic carbon and biochar, excluding removals from the production and end use of bioenergy.
- Biogenic emissions and associated removals from bioenergy feedstocks – CO2, CH4 and N2O emissions from the combustion, processing and distribution phase of bioenergy and the land use emissions and removals associated with bioenergy feedstocks.
- You can use this column to identify where you have a financial year or average year based target.
- If your target was originally in a different format, you may wish to give the original target before it was converted into the format required for the purposes of this table.
- If your target is part of a wider carbon neutrality goal, a regulatory requirement, or a longer term target, you can also explain this here.
Plan for achieving target, and progress made to the end of the reporting year (column 80)
- This column only appears if you select “Underway”, “Revised”, or “New” in column 78 “Target status in reporting year”.
- Describe how you plan to achieve the target, including any emissions reduction initiatives your organization plans to implement.
- List the emissions reduction initiatives which have contributed most to any progress towards the target to the end of the reporting year.
- If you are not on track to achieve the target, explain how you plan to get back on track.
- If possible, specify your anticipated and/or observed progress curve in this column, i.e.:
- Linear – the rate of progress towards the target is anticipated and/or observed to be steady over time
- Logarithmic – the rate of progress towards the target is anticipated and/or observed to be faster at the start
- Exponential – the rate of progress towards the target is anticipated and/or observed to be faster at the end
- Variable – the rate of progress towards the target is anticipated and/or observed to change from year to year
List the emissions reduction initiatives which contributed most to achieving this target (column 81)
- This column only appears if you select “Achieved” in column 78 “Target status in reporting year”.
- List the initiatives which contributed most to the emissions reductions achieved over the lifetime of the target.
Example response
Worked example of absolute target table
The following table shows two absolute target examples:
- A target to reduce covered Scope 1 and 2 emissions by 80% in 2026 compared with the base year (ID=Abs1);
- A target to reduce covered Scope 3 emissions by 75% in 2027 compared with the base year (ID=Abs2);
Target reference number
|
Is this a science-based target?
|
Target ambition*
|
Year target was set
|
Target coverage
|
Scope(s)
|
Scope 2 accounting method
|
Abs 1
|
Yes, and this target has been approved by the Science -Based Targets initiative
|
1.5°C aligned
|
2019
|
Company-wide
|
|
Market-based
|
Abs 2
|
Yes, and this target has been approved by the Science -Based Targets initiative
|
1.5°C aligned
|
2019
|
Company-wide
|
Scope 3
|
N/A
|
Scope 3 category(ies)
|
Base year
|
Base year Scope 1 emissions covered by target (metric tons CO2e)
|
Base year Scope 2 emissions covered by target (metric tons CO2e)
|
Base year Scope 3, Category 1: Purchased goods and services emissions covered by target (metric tons CO2e)
|
Base year Scope 3, Category 6: Business travel emissions covered by target (metric tons CO2e)
|
Base year Scope 3, Category 7: Employee commuting emissions covered by target (metric tons CO2e)
|
N/A
|
2018
|
830000
|
450000
|
N/A
|
N/A
|
N/A
|
- Category 1: Purchased goods and services
- Category 6: Business travel
- Category 7: Employee commuting
|
2017
|
N/A
|
N/A
|
700000
|
100000
|
75000
|
Base year total Scope 3 emissions covered by target (metric tons CO2e)
|
Total base year emissions covered by target in all selected Scopes (metric tons CO2e)
|
Base year Scope 1 emissions covered by target as % of total base year emissions in Scope 1
|
Base year Scope 2 emissions covered by target as % of total base year emissions in Scope 2
|
Base year Scope 3, Category 1: Purchased goods and services emissions covered by target as % of total base year emissions in Scope 3, Category 1 (metric tons CO2e)
|
Base year Scope 3, Category 6: Business travel emissions covered by target as % of total base year emissions in Scope 3, Category 1 (metric tons CO2e)
|
Base year Scope 3, Category 7: Employee commuting emissions covered by target as % of total base year emissions in Scope 3, Category 1 (metric tons CO2e)
|
N/A
|
1280000
|
95
|
95
|
N/A
|
N/A
|
N/A
|
875000
|
875000
|
N/A
|
N/A
|
95%
|
100%
|
100%
|
|
Base year Scope total 3 emissions covered by target as % of total base year emissions in Scope 3 (in all Scope 3 categories)
|
Base year emissions covered by target in all selected Scopes as % of total base year emissions in all selected Scopes
|
Target year
|
Targeted reduction from base year (%)
|
Total emissions in target year covered by target in all selected Scopes (metric tons CO2e)
[auto-calculated]
|
Scope 1 emissions in reporting year covered by target (metric tons CO2e)
|
Scope 2 emissions in reporting year covered by target (metric tons CO2e)
|
|
N/A
|
95
|
2026
|
80
|
256000
|
332000
|
180000
|
|
70
|
70
|
2027
|
75
|
218750
|
N/A
|
N/A
|
|
Scope 3, Category 1: Purchased goods and services emissions in reporting year covered by target (metric tons CO2e)
|
Scope 3, Category 6: Business travel emissions in reporting year covered by target (metric tons CO2e)
|
Scope 3, Category 7: Employee commuting emissions in reporting year covered by target (metric tons CO2e)
|
Total Scope 3 emissions in reporting year covered by target (metric tons CO2e)
|
Total emissions in reporting year covered by target in all selected scopes (metric tons CO2e)
|
Does this target cover any land-related CO2 emissions?
|
% of target achieved relative to base year
[auto-calculated]
|
|
N/A
|
N/A
|
N/A
|
N/A
|
512000
|
No, it does not cover any land-related emissions (SBT)
|
75
|
|
525000
|
75000
|
56250
|
656250
|
656250
|
No, it does not cover any land-related emissions (SBT)
|
33
|
Target status in reporting year
|
Please explain target coverage and identify any exclusions
|
Plan for achieving target, and progress made to the end of the reporting year
|
List the emissions reduction initiatives which contributed most to achieving this target
|
Underway
|
This target is company-wide and covers 95% of both our Scope 1 and 2 emissions, with some small exclusion due to poor data availability from some of our smaller sites and leased spaces in Southeast Asia. We have not included any land-related emissions within the target boundary.
|
By the reporting year we have achieved most of our target. To achieve further reductions we plan to keep improving our operational and logistics efficiency alongside electrification of our domestic vehicle fleet to achieve deep cuts to emissions. Alongside this we will continue to increase our sourcing of zero-carbon electricity. The progress curve is likely to be variable.
|
N/A
|
Underway
|
This company-wide target covers 70% of all our Scope 3 emissions, focusing on the largest categories most relevant to our business activities (Employee commuting, Business travel) while exclusing several minor categories which we aim to reduce through separate measures.
|
We are changing our procurement processes to include environmental criteria and therefore incentivize the purchase of lower-emissions products, reducing emissions.
We are also pursuing remote working opportunities where possible for our administrative staff. We are also minimizing business travel where possible. Our biggest measure in this category is to encourage and support our employees to switch to low-carbon modes of transport. We have implemented a program which helps employees purchase season tickets for public transport and are trialing leasing electric vehicles for some employees.
|
N/A
|
Additional information
Science-based targets
- Nearly 200 nations at COP21 wrote into the Paris Agreement that globally we will aim to limit warming to below 2°C and pursue efforts to limit warming to under 1.5°C. However, there is a large gap between the level of ambition of the country/area commitments and targeted temperatures. Companies, which are responsible for a vast majority of the world’s emissions, must play a critical role in filling the gap left by country/area commitments by raising the level of ambition in their target setting and reducing their emissions in line with climate science.
- Science-based target setting methods enable companies to set emissions targets that are consistent with conserving the remaining global emissions budget. A number of factors are taken into consideration in order to determine what is most appropriate for a given company. Please see the Technical Note on Science Based Targets and the 2023 climate change scoring methodology for information on best practices in target setting and what CDP considers a science-based target.
- Companies are very strongly encouraged to have their targets officially evaluated by the Science Based Targets initiative (SBTi). CDP considers targets approved by the initiative to reflect best practices in science-based target setting. Due to the waiting list for target validation, companies are encouraged to book a validation slot and submit their targets to the SBTi as early as possible in order for these targets to be used for scoring in CDP’s 2023 climate change questionnaire.
- Regardless of submission to SBTi, companies are expected to report emissions reductions targets in their CDP response. Targets that did not pass the SBTi’s review process or that have not been submitted for review prior to the deadline will still be evaluated using the information disclosed by each company in their CDP response. See the Technical Note for more details.
Science-based targets — land-based emissions and removals accounting
- As per the GHG Protocol Corporate Standard, GHG Protocol Corporate Value Chain (Scope 3) Standard and GHG Protocol Scope 2 Guidance, biogenic CO2 emissions and removals shall be reported alongside a company’s GHG inventory, separately from the Scopes. However, SBTi criterion 10 requires CO2 emissions from the combustion, processing and distribution of bioenergy and the land use emissions and removals associated with bioenergy feedstocks to be included in the target boundary when setting a science-based target (in Scopes 1, 2 and/or 3, as relevant) and when reporting progress against that target, even though such CO2 emissions and/or removals are reported separately in a company’s GHG inventory. Additionally, companies are expected to account for land-based emissions and removals and set FLAG targets to address these emissions. Land-based emissions and removals should be included within the boundary of an SBTi-approved FLAG target when reporting progress against that target. Companies should select whether their targets cover land-based emissions and removals in column 76. Companies are expected to adhere to any additional GHG Protocol Guidance on accounting for land-based emissions when released in order to maintain compliance with the SBTi criteria.
(C4.1b) Provide details of your emissions intensity target(s) and progress made against those target(s).
Question dependencies
This question only appears if you select “Intensity target” in response to C4.1.
Change from last year
Modified question
Rationale
The question is aimed at encouraging best practice in target setting, such as the use of science-based targets where available.
Ambition: Companies make progress against emissions targets that reflect their full emissions inventory, and are line with SBTi criteria.
Connection to other frameworks
SDG
Goal 7: Affordable and clean energy
Goal 12: Responsible consumption and production
Goal 13: Climate action
TCFD
Metrics & Targets recommended disclosure c) Describe the targets used by the organization to manage climate related risks and opportunities and performance against targets.
S&P Global Corporate Sustainability Assessment
Climate-Related Targets
TCFD Disclosure
NZAM (FS only)
Commitment 1
Response options
Please complete the following table. The table is displayed over several rows for readability. You are able to add rows by using the “Add Row” function at the bottom of the table.
| 1
|
2
|
3
|
4
|
5
|
6
|
7
|
8
|
9
|
| Target reference number
|
Is this a science-based target?
|
Target ambition*
|
Year target was set
|
Target coverage
|
Scope(s)
|
Scope 2 accounting method
|
Scope 3 category(ies)
|
Intensity metric
|
| Int1-Int100
|
Select from drop-down options below
|
Select from:
- 1.5°C aligned
- Well-below 2°C aligned
- 2°C aligned
- Other, please specify
|
Numerical field [enter a number between 1900-
2023]
|
Select from:
- Company-wide
- Business division
- Business activity
- Site/facility
- Country/area/region
- Product level
- Other, please specify
|
Select all that apply:
|
Select from:
- Location-based
- Market-based
|
Select all that apply:
- Category 1: Purchased goods and services
- Category 2: Capital goods
- Category 3: Fuel-and-energy-related activities (not included in Scopes 1 or 2)
- Category 4: Upstream transportation and distribution
- Category 5: Waste generated in operations
- Category 6: Business travel
- Category 7: Employee commuting
- Category 8: Upstream leased assets
- Category 9: Downstream transportation and distribution
- Category 10: Processing of sold products
- Category 11: Use of sold products
- Category 12: End-of-life treatment of sold products
- Category 13: Downstream leased assets
- Category 14: Franchises
- Category 15: Investments [does not appear to FS]
- Other (upstream)
- Other (downstream)
|
Select from drop-down options below
|
| 10
|
11
|
12
|
13-29
|
30
|
31
|
32
|
33
|
| Base year
|
Intensity figure in base year for Scope 1 (metric tons CO2e per unit of activity)
|
Intensity figure in base year for Scope 2 (metric tons CO2e per unit of activity)
|
Intensity figure in base year for Scope 3, Category […] (metric tons CO2e per unit of activity)* [One column for each Scope 3 category]
|
Intensity figure in base year for total Scope 3 (metric tons CO2e per unit of activity)
|
Intensity figure in base year for all selected Scopes (metric tons CO2e per unit of activity)
|
% of total base year emissions in Scope 1 covered by this Scope 1 intensity figure
|
% of total base year emissions in Scope 2 covered by this Scope 2 intensity figure
|
| Numerical field [enter a number between 1900- 2023]
|
Numerical field [enter a number from 0- 999,999,999,999 using a maximum of 10 decimal places and no commas]
|
Numerical field [enter a number from 0- 999,999,999,999 using a maximum of 10 decimal places and no commas]
|
Numerical field [enter a number from 0- 999,999,999,999 using a maximum of 10 decimal places and no commas]
|
Numerical field [enter a number from 0- 999,999,999,999 using a maximum of 10 decimal places and no commas]
|
Numerical field [enter a number from 0- 999,999,999,999 using a maximum of 10 decimal places and no commas]
|
Percentage field [enter a percentage from 0-100 using a maximum of 2 decimal places]
|
Percentage field [enter a percentage from 0-100 using a maximum of 2 decimal places]
|
| 34-50
|
51
|
52
|
53
|
54
|
55
|
56
|
57
|
| % of total base year emissions in Scope 3, Category […] covered by this Scope 3, Category […] intensity figure* [One column for each Scope 3 category]
|
% of total base year emissions in Scope 3 (in all Scope 3 categories) covered by this total Scope 3 intensity figure
|
% of total base year emissions in all selected Scopes covered by this intensity figure
|
Target year
|
Targeted reduction from base year (%)
|
Intensity figure in target year for all selected Scopes (metric tons CO2e per unit of activity)
[auto-calculated]
|
% change anticipated in absolute Scope 1+2 emissions
|
% change anticipated in absolute Scope 3 emissions
|
| Percentage field [enter a percentage from 0-100 using a maximum of 2 decimal places]
|
Percentage field [enter a percentage from 0-100 using a maximum of 2 decimal places]
|
Percentage field [enter a percentage from 0-100 using a maximum of 2 decimal places]
|
Numerical field [enter a number between 2018- 2100]
|
Percentage field [enter a percentage from 0-100 using a maximum of 2 decimal places]
|
Numerical field [0-999,999,999,999]
|
Percentage field [enter a percentage from -999-999 using a maximum of 2 decimal places]
|
Percentage field [enter a percentage from -999-999 using a maximum of 2 decimal places]
|
| 58
|
59
|
60-76
|
77
|
78
|
79
|
80
|
81
|
| Intensity figure in reporting year for Scope 1 (metric tons CO2e per unit of activity)
|
Intensity figure in reporting year for Scope 2 (metric tons CO2e per unit of activity)
|
Intensity figure in reporting year for Scope 3, Category […] (metric tons CO2e per unit of activity)* [One column for each Scope 3 category]
|
Intensity figure in reporting year for total Scope 3 (metric tons CO2e per unit of activity)
|
Intensity figure in reporting year for all selected Scopes (metric tons CO2e per unit of activity)
|
Does this target cover any land-related emissions?
|
% of target achieved relative to base year [auto-calculated]
|
Target status in reporting year
|
| Numerical field [enter a number from 0-999,999,999,999 using a maximum of 10 decimal places and no commas]
|
Numerical field [enter a number from 0-999,999,999,999 using a maximum of 10 decimal places and no commas]
|
Numerical field [enter a number from 0-999,999,999,999 using a maximum of 10 decimal places and no commas]
|
Numerical field [enter a number from 0-999,999,999,999 using a maximum of 10 decimal places and no commas]
|
Numerical field [enter a number from 0-999,999,999,999 using a maximum of 10 decimal places and no commas]
|
Select from:
- Yes, it covers land-related emissions only (e.g. FLAG SBT)
- Yes, it covers land-related and non-land related emissions (e.g. SBT approved before the release of FLAG target-setting guidance)
- Yes, it covers land-related CO2 emissions/removals associated with bioenergy and non-land related emissions (e.g. non-FLAG SBT with bioenergy)
- No, it does not cover any land-related emissions (e.g. non-FLAG SBT)
|
Percentage field
|
Select from:
- New
- Underway
- Achieved
- Expired
- Revised
- Replaced
- Retired
|
| 82
|
83
|
84
|
| Please explain target coverage and identify any exclusions
|
Plan for achieving target, and progress made to the end of the reporting year
|
List the emissions reduction initiatives which contributed most to achieving this target
|
| Text field [maximum 5,000 characters]
|
Text field [maximum 2,400 characters]
|
Text field [maximum 2,400 characters]
|
[Add row]
*This column only appears if you select one of the “Yes…” options in column “Is this a science-based target?”
Intensity metric drop-down options:
Select one of the following options:
- Grams CO2e per revenue passenger kilometer
- Metric tons CO2e per USD($) value-added
- Metric tons CO2e per square meter
- Metric tons CO2e per metric ton of aluminum
- Metric tons CO2e per metric ton of steel
- Metric tons CO2e per metric ton of cement
- Metric tons CO2e per metric ton of cardboard
- Grams CO2e per kilometer
- Metric tons CO2e per unit revenue
- Metric tons CO2e per unit FTE employee
- Metric tons CO2e per unit hour worked
- Metric tons CO2e per metric ton of product
- Metric tons of CO2e per liter of product
- Metric tons CO2e per unit of production
- Metric tons CO2e per unit of service provided
- Metric tons CO2e per square foot
- Metric tons CO2e per kilometer
- Metric tons CO2e per passenger kilometer
- Metric tons CO2e per megawatt hour (MWh)
- Metric tons CO2e per barrel of oil equivalent (BOE)
- Metric tons CO2e per vehicle produced
- Metric tons CO2e per metric ton of ore processed
- Metric tons CO2e per ounce of gold
- Metric tons CO2e per ounce of platinum
- Metric tons of CO2e per metric ton of aggregate
- Metric tons of CO2e per billion (currency) funds under management
- Other, please specify
Is this a science-based target? Drop-down options:
Select one of the following options:
- Yes, and this target has been approved by the Science Based Targets initiative
- Yes, we consider this a science-based target, and the target is currently being reviewed by the Science Based Targets initiative
- Yes, we consider this a science-based target, and we have committed to seek validation of this target by the Science Based Targets initiative in the next two years
- Yes, we consider this a science-based target, but we have not committed to seek validation of this target by the Science Based Targets initiative within the next two years
- No, but we are reporting another target that is science-based
- No, but we anticipate setting one in the next two years
- No, and we do not anticipate setting one in the next two years
Requested content
General
- Note that CDP is requesting data on gross emissions targets. Gross means total emissions before any deductions or other adjustments are made to take account of offset credits, avoided emissions, and/or reductions attributable to the sequestration or transfer of GHGs (except in a specific case of bioenergy use for science-based targets – see “Additional information” for more details).
- If you have a target that will be met in part by offsetting (including carbon neutrality targets), or CO2 removals except for the bioenergy case specified in “Additional information”, only the proportion of the target that relates to emissions reductions (and not offset purchases or CO2 removals) should be reported here. If you are uncertain of the proportion that will be achieved through emissions reductions, make an estimation based on the initiatives that you have in place or planned.
- Targets to reduce emissions in the product use phase or to reduce emissions from the supply chain should be captured as Scope 3 targets.
- If the details of your target differ between the Scopes (e.g. if the temperature alignment of your Scope 1+2 target is consistent with a 1.5°C-aligned pathway and the temperature alignment of your Scope 3 target is consistent with a well-below 2°C-aligned pathway), it is recommended to report separate rows for the Scope(s) for which the target differs.
- If you intend to report a net-zero target in C4.2c, you should report both the near-term and long-term emissions reduction target(s) associated with your net-zero target either in this question or in C4.1a, and link them to your net zero target in column 3 of C4.2c. Please refer to the Science Based Targets initiative’s Net-Zero Standard for information on science-based net-zero targets.
Target reference number (column 1)
- Select a unique target reference from the drop-down menu provided to identify the target in subsequent questions and to track progress against the target in subsequent reporting years.
- If you reported a target to CDP last year and will be reporting progress against the same target this year, ensure you use the same target reference number as last year. For any new targets you are adding, always use a new reference number that you have not used previously.
Is this a science-based target? (column 2)
- A brief description of science-based targets and why CDP is asking companies to set them is provided as additional information to this question.
- In addition, refer to the CDP Technical Note on Science-Based Targets for what qualifies as a science-based target and how to assess your target against the Science Based Targets initiative’s criteria.
- Companies with activities in the oil and gas sector for which there is no available sector methodology to determine whether a target is science-based should select the most appropriate ‘No…” option in this column. For more information on sector-specific requirements, see pages 14-21 of the SBTi Criteria.
- Yes, and this target has been approved by the Science Based Targets initiative – Companies are very strongly encouraged to have their targets officially evaluated by the Science Based Targets initiative (SBTi). CDP considers targets approved by the initiative to reflect best practice in science-based target setting. Select this option only if the target has been approved by the SBTi.
- Yes, we consider this a science-based target, and the target is currently being reviewed by the Science Based Targets initiative – If your company has set a target and has self-assessed it to be science-based, and it has been submitted to the SBTi for validation and is currently being reviewed by the SBTi, you should select this option. You should use the “Please explain target coverage and identify any exclusions” column to explain why you consider your target to be science-based.
- Yes, we consider this a science-based target, and we have committed to seek validation of this target by the Science Based Targets initiative in the next two years – Not all companies have had their target assessed by the SBTi. If your company has set a target and has self-assessed it to be science-based but has not yet submitted it to the SBTi for validation, you should select this option. You should use the “Please explain target coverage and identify any exclusions” column to explain why you consider your target to be science-based. If you are currently in the process of revising your target to meet SBTi criteria, indicate this by selecting “No, but we anticipate setting one in the next two years.
- Yes, we consider this a science-based target, but we have not committed to seek validation of this target by the Science Based Targets initiative within the next two years – Not all companies intend to have their target assessed by the SBTi. If your company has set a target and has self-assessed it to be science-based but has not committed to submit it to the SBTi for validation, you should select this option. You should use the “Please explain target coverage and identify any exclusions” column to explain why you consider your target to be science-based. If you are a supplier to a company with a supplier engagement target, as part of which you have set a target in line with SBTi resources but are not planning to seek SBTi approval, select this option.
- No, but we are reporting another target that is science-based – Another target (absolute or intensity) disclosed is science-based, either in another row in this table, or in C4.1b.
- No, but we anticipate setting one in the next two years – While not necessary, it is recommended that the company publicly state this by submitting a Science Based Target initiative commitment letter.
- No, and we do not anticipate setting one in the next two years – No science-based targets have been set and there are no plans in place to set one in the next two years.
Target ambition (column 3)
- This column only appears if you select any “Yes” option in “Is this a science-based target” (column 2).
- Select the level of ambition of your science-based target. Note that as of July 2022, the SBTi requires Scope 1 and 2 targets to be consistent with the level of decarbonization required to keep global temperature increase to 1.5°C compared with pre-industrial temperatures, and Scope 3 targets to be conistent with the level of decarbonization required to keep global temperature increase to well-below 2°C compared to pre-industrial temperatures.
Year target was set (column 4)
- Enter the year in which your company set the target.
- This must be either before or during the reporting year but cannot be after the reporting year or after the target year.
- If the target is science-based and has been submitted to the SBTi for validation or has been approved by the SBTi (as indicated by your response to column 2), enter the year in which your organization submitted the target for validation by the SBTi.
- If you have a year-on-year rolling target, enter the year you first set the target. This can be before the base year.
- If you set the target based on financial years, enter the year that applies to the end of your financial year and specify this in the “Please explain target coverage and identify any exclusions” column.
Target coverage (column 5)
- If the target applies to the whole company, select “Company-wide”. Note that “company” refers collectively to all the companies, businesses, organizations, other entities or groups that fall within your definition of the reporting boundary.
- It is considered best practice to report one overarching target covering total company-wide Scope 1 and 2 emissions. Sub-targets may also be reported in additional rows.
- If the target does not apply to the whole company, select the option that best describes the coverage of the target, and provide further details in the “Please explain target coverage and identify any exclusions” column. E.g. if your target applies only to your European operations, select “Country/area/region” in this column and specify the country/area/region in the “Please explain target coverage and identify any exclusions” column.
Scope(s) (column 6)
- This refers to the Scope(s) of emissions to which the target relates. Note that the target does not have to comprise all emissions within a particular Scope.
Scope 2 accounting method (column 7)
- This column only appears if you select “Scope 2” in column 6 “Scope(s)”.
- Indicate whether the target relates to your location-based or market-based Scope 2 emissions.
Scope 3 category(ies) (column 8)
- This column only appears if you select “Scope 3” in column 6 “Scope(s)”.
- Select the Scope 3 emissions category(ies) that relate to this target.
- For each Scope 3 category selected in this column, a corresponding column will appear for you to provide the category’s Scope 3 intensity figure in the base year (columns 13-29), % of total base year emissions covered (columns 34-40) and intensity figure in the reporting year (columns 60-76).
- The categories of Scope 3 emissions have been taken from the Greenhouse Gas Protocol’s Corporate Value Chain (Scope 3) Accounting and Reporting Standard. Refer to the Standard for additional information on the sources that each category comprises and how to calculate these emissions. If you are specifying a Scope 3 source under “Other, please specify” please make clear whether it is an upstream or downstream source.
Intensity metric (column 9)
- If you select “Other, please specify,” provide a label for the metric.
- This should be in the format “mass CO2 per activity,” as in the drop-down options above.
Base year (column 10)
- The base year is the year against which you are comparing your emissions reduction target.
- The base year cannot be after the reporting year.
- If you have a year-on-year rolling target, the base year will be the previous reporting year.
- If you have a target based on financial years, enter the year that applies to the end of your financial year and specify this in the “Please explain target coverage and identify any exclusions” column.
- If you have a target based on average emissions over a period of time (e.g. 5-year average), enter the year that applies to the end of the average period and specify this in the “Please explain target coverage and identify any exclusions” column.
Intensity figure in base year for Scope 1 (metric tons CO2e per unit of activity) (column 11)
- This column only appears if you select “Scope 1” in column 6 “Scope(s)”.
- If the target encompasses multiple Scopes, this figure should be based upon the Scope 1 proportion only.
- Note that the base year Scope 1 emissions intensity figure should be calculated by dividing the base year Scope 1 emissions covered by the target by the intensity metric denominator (e.g. unit revenue, metric ton of product etc).
- E.g. if your target is to reduce your company-wide Scope 1+2 emissions per full time equivalent (FTE) employee by 22%, using 2015 as the base year and 2025 as the target year, calculate what your company-wide Scope 1 emissions were per FTE in 2015 and enter that figure in this column.
Intensity figure in base year for Scope 2 (metric tons CO2e per unit of activity) (column 12)
- This column only appears if you select “Scope 2” in column 6 “Scope(s)”.
- If the target encompasses multiple Scopes, this figure should be based upon the Scope 2 proportion only.
- Note that the base year Scope 2 emissions intensity figure should be calculated by dividing the base year Scope 2 emissions covered by the target by the intensity metric denominator (e.g. unit revenue, metric ton of product etc).
- E.g. if your target is to reduce your company-wide Scope 1+2 emissions per full time equivalent (FTE) employee by 22%, using 2015 as the base year and 2025 as the target year, calculate what your company-wide Scope 2 emissions were per FTE in 2015 and enter that figure in this column.
Intensity figure in base year for Scope 3, Category […] (metric tons CO2e per unit of activity) (column 13-29)
- A column will appear for each Scope 3 category selected in column 8.
- If your target covers only certain activities within a Scope 3 category (as indicated in column 5 “Target coverage”), you should calculate the base year intensity figure using the base year emissions relating to those activities only, rather than the emissions for the Scope 3 category as a whole.
Intensity figure in base year for total Scope 3 (metric tons CO2e per unit of activity) (column 30)
- This column only appears if you select “Scope 3” in column 6 “Scope(s)”.
- Enter the total Scope 3 emissions intensity figure in the base year covered by the target in this column.
- If the target encompasses multiple Scopes, this figure should be based upon the Scope 3 proportion only.
- Note that the base year total Scope 3 emissions intensity figure should be calculated by dividing the base year total Scope 3 emissions covered by the target for the Scope 3 category(ies) selected in column 8 by the intensity metric denominator (e.g. unit revenue, metric ton of product etc).
- E.g. if your target is to reduce your company-wide Scope 1+2+3 emissions per unit revenue by 46%, using 2018 as the base year and 2027 as the target year, calculate what your company-wide emissions per unit revenue were in 2018 for the Scope 3 category(ies) selected in column 8, and enter this figure in this column.
Intensity figure in base year for all selected Scopes (metric tons CO2e per unit of activity) (column 31)
- Enter the emissions intensity figure in the base year covered by the target for all selected Scopes in this column.
- Note that this figure should be calculated by dividing the total base year emissions covered by the target in all selected Scopes by the intensity metric denominator (e.g. unit revenue, metric ton of product etc).
- E.g. if your target is to reduce your company-wide Scope 1+2 emissions per full time equivalent (FTE) employee by 22%, using 2015 as the base year and 2025 as the target year, calculate what your company-wide Scope 1+2 emissions were per FTE in 2015 and enter this figure in this column
- If the target relates to a single Scope, this figure will be the same as the figure reported in either column 11, column 12, or column 30.
% of total base year emissions in Scope 1 covered by this Scope 1 intensity figure (column 32)
- This column only appears if you select “Scope 1” in column 6 “Scope(s)”.
- Enter the base year Scope 1 emissions covered by the target as a percentage of your total company-wide base year emissions in Scope 1.
- If the target encompasses multiple Scopes, the percentage should be based upon the Scope 1 proportion only.
- Note that for this calculation you should use the absolute base year Scope 1 emissions covered by the target (i.e. metric tons CO2e), not the Scope 1 intensity figure you reported in column 11 (i.e. metric tons CO2e per unit activity).
- E.g. if your target is to reduce your Scope 1+2 emissions per FTE employee in your European operations only, and the Scope 1 emissions from your European operations accounted for 80% of your total Scope 1 emissions in the base year, then you should enter 80 into this column.
- Note that entering a value of 100% indicates that the target covers your company’s total, global gross emissions in the base year for Scope 1.
% of total base year emissions in Scope 2 covered by this Scope 2 intensity figure (column 33)
- This column only appears if you select “Scope 2” in column 6 “Scope(s)”.
- Enter the base year Scope 2 emissions covered by the target as a percentage of your total company-wide base year emissions in Scope 2.
- If the target encompasses multiple Scopes, the percentage should be based upon the Scope 2 proportion only.
- Note that for this calculation you should use the absolute base year Scope 2 emissions covered by the target (i.e. metric tons CO2e), not the Scope 2 intensity figure you reported in column 12 (i.e. metric tons CO2e per unit activity).
- E.g. if your target is to reduce your Scope 1+2 emissions per FTE employee in your European operations only, and the Scope 2 emissions from your European operations accounted for 30% of your total Scope 2 emissions in the base year, then you should enter 30 into this column.
- Note that entering a value of 100% indicates that the target covers your company’s total, global gross emissions in the base year for Scope 2.
% of total base year emissions in Scope 3, Category […] covered by this Scope 3, Category […] intensity figure (column 34-50)
- A column will appear for each Scope 3 category selected in column 8.
- Enter the base year Scope 3 emissions covered by the intensity figure in the Scope 3 category as a percentage of your total company-wide base year emissions in that Scope 3 category.
- E.g., if your intensity figure covers only the Scope 3 Category 1 emissions of one region which accounts for 50% of your total base year Scope 3 emissions in Category 1, enter “50”.
% of total base year emissions in Scope 3 (in all Scope 3 categories) covered by this total Scope 3 intensity figure (column 51)
- This column only appears if you select “Scope 3” in column 6 “Scope(s)”.
- Enter the base year Scope 3 emissions covered by the target as a percentage of your total company-wide base year emissions for all Scope 3 categories calculated in the base year.
- E.g. if you have selected only one Scope 3 category (e.g. Business travel), you should enter the base year emissions in that category as a percentage of your total base year Scope 3 emissions in all categories.
- If the target encompasses multiple Scopes, the percentage should be based upon the Scope 3 proportion only.
- Note that for this calculation you should use the absolute base year Scope 3 emissions covered by the target (i.e. metric tons CO2e), not the total Scope 3 intensity figure you reported in column 30 (i.e. metric tons CO2e per unit activity).
- E.g. if your target is to reduce your Scope 1+2+3 emissions per unit revenue for a particular business activity only (e.g. office-based operations, etc.), and the total Scope 3 emissions from that business activity accounted for 20% your total Scope 3 emissions in the base year, then you should enter 20 into this column.
- Note that entering a value of 100% indicates that the target covers your company’s total, global gross emissions in the base year for Scope 3.
% of total base year emissions in all selected Scopes covered by this intensity figure (column 52)
- Enter the total base year emissions covered by the target as a percentage of your total company-wide base year emissions in all Scopes selected in column 6.
- Note that for this calculation you should use the absolute base year emissions covered by the target in all selected Scopes (i.e. metric tons CO2e), not the intensity figure you reported in column 31 (i.e. metric tons CO2e per unit activity).
- E.g. if your target is to reduce your Scope 1+2+3 emissions per FTE employee for your UK operations, and the Scope 1+2+3 emissions from your UK operations accounted for 10% your total, company-wide Scope 1+2+3 emissions, then you should enter 10 into this column.
- Note that entering a value of 100% indicates that the target covers your company’s total, global gross emissions in the base year for all Scopes selected in column 6.
Target year (column 53)
- Enter the year that the target ends. For example if the target is to reduce emissions intensity by 50% by 2030, the target year is 2030.
- If you have a year-on-year rolling target, the target year will be the reporting year.
- If you have a target based on financial years, enter the year that applies to the end of your financial year and specify this in the “Please explain target coverage and identify any exclusions” column.
- If you have a target based on average emissions over a period of time (e.g. 5-year average), enter the year that applies to the end of the average period and specify this in the “Please explain target coverage and identify any exclusions” column.
- You should not report any target that has been achieved before the start of the reporting year.
Targeted reduction from base year (%) (column 54)
- Enter your targeted emissions intensity reduction as a percentage reduction of the emissions intensity figure in all Scopes relevant to the target to be achieved in the target year, when compared to the base year.
- E.g. if your target is to reduce your Scope 1+2 emissions per FTE employee to 7 metric tons CO2e per FTE employee and your base year Scope 1+2 intensity figure was 9 metric tons CO2e per FTE employee, you should enter 22 into this column (i.e. ((9-7)/9)=0.22; then multiply by 100 for percentage value).
- If your target is to stabilize your emissions intensity at the base year level, you should enter 0 in this column.
- Note that this column is intended to describe the targeted percentage reduction from the base year that is to be achieved in the target year, not the percentage reduction from the base year observed in the reporting year.
Intensity figure in target year for all selected Scopes (metric tons CO2e per unit of activity) [auto-calculated] (column 55)
- This column will be auto-calculated in the ORS.
- The intensity figure in your target year covered by the target will be calculated from the “Intensity figure in base year for all selected Scopes” and the “Targeted reduction from base year” columns. Ensure that you have entered data into these columns.
- E.g. if your base year Scope 1+2 intensity figure was 9 metric tons CO2e per FTE employee, and your targeted reduction is 22%, this column will display 7.
% change anticipated in absolute Scope 1+2 emissions (column 56)
- Complete this column if your target relates to Scope 1 and/or Scope 2 emissions. If your target does not relate to Scope 1 and/or Scope 2 emissions, enter 0 (zero) in this column.
- Enter the percentage change in your total absolute gross global Scope 1+2 emissions anticipated, based on the information provided in the previous columns. A positive figure indicates that you anticipate an increase in emissions.
- Note that even if your target only relates to one Scope (i.e. Scope 1 or 2), enter the change anticipated in your Scope 1+2 emissions.
% change anticipated in absolute Scope 3 emissions (column 57)
- Complete this column if your target relates to Scope 3 emissions. If your target does not include Scope 3 emissions, enter 0 (zero) in this column.
- Enter the percentage change in your total absolute global Scope 3 emissions (in all Scope 3 categories) expected, based on the information provided in the previous columns. A positive figure indicates that you anticipate an increase in emissions.
Intensity figure in reporting year for Scope 1 (metric tons CO2e per unit of activity) (column 58)
- This column only appears if you select “Scope 1” in column 6 “Scope(s)”.
- If the target encompasses multiple Scopes, this figure should be based upon the Scope 1 proportion only.
- Note that the Scope 1 emissions intensity figure in the reporting year should be calculated by dividing your reporting year Scope 1 emissions covered by the target by the intensity metric denominator (e.g. unit revenue, metric ton of product etc).
- E.g. if your target is to reduce your Scope 1+2 emissions per full time equivalent (FTE) employee from 9 metric tons CO2e to 7 metric tons CO2e and in the reporting year your Scope 1 emissions per FTE employee were 5 metric tons CO2e, enter 5 in this column.
Intensity figure in reporting year for Scope 2 (metric tons CO2e per unit of activity) (column 59)
- This column only appears if you select “Scope 2” in column 6 “Scope(s)”.
- If the target encompasses multiple Scopes, the percentage should be based upon the Scope 2 proportion only.
- Note that the Scope 2 emissions intensity figure in the reporting year should be calculated by dividing your reporting year Scope 2 emissions covered by the target by the intensity metric denominator (e.g. unit revenue, metric ton of product etc).
- E.g. if your target is to reduce your Scope 1+2 emissions per full time equivalent (FTE) employee from 9 metric tons CO2e to 7 metric tons CO2e and in the reporting year your Scope 2 emissions per FTE employee were 3 metric tons CO2e, enter 3 in this column.
Intensity figure in reporting year for Scope 3, Category […] (metric tons CO2e per unit of activity) (columns 60-76)
- A column will appear for each Scope 3 category selected in column 8.
- Note that an intensity figure for all Scope 3 categories covered by a target should be calculated every year.
Intensity figure in reporting year for total Scope 3 (metric tons CO2e per unit of activity) (column 77)
- This column only appears if you select “Scope 3” in column 6 “Scope(s)”.
- Enter the Scope 3 emissions intensity figure in the reporting year covered by the target in this column.
- If the target encompasses multiple Scopes, the percentage should be based upon the Scope 3 proportion only.
- Note that the Scope 3 emissions intensity figure in the reporting year should be calculated by dividing your total reporting year Scope 3 emissions covered by the target for the Scope 3 category(ies) selected in column 8 by the intensity metric denominator (e.g. unit revenue, metric ton of product etc).
- E.g. if your target is to reduce your company-wide Scope 1+2+3 emissions per unit revenue from from 16 metric tons CO2e to 5 metric tons CO2e and in the reporting year your Scope 3 emissions per unit revenue for the Scope 3 category(ies) selected in column 8 were 2 metric tons CO2e, enter 2 in this column.
- If your target covers only certain activities within a Scope 3 category (as indicated in column 5 “Target coverage”), you should calculate the intensity figure in the reporting year using the reporting year emissions relating to those activities only, rather than the emissions for the Scope 3 category as a whole.
Intensity figure in reporting year for all selected Scopes (metric tons CO2e per unit of activity) (column 78)
- Enter the emissions intensity figure in the reporting year covered by the target for all selected Scopes in this column.
- Note that this intensity figure should be calculated by dividing your total reporting year emissions covered by the target in all selected Scopes by the intensity metric denominator (e.g. unit revenue, metric ton of product etc).
- E.g. if your target is to reduce your company-wide Scope 1+2 emissions per full time equivalent (FTE) employee from 9 metric tons CO2e to 7 metric tons CO2e and in the reporting year your Scope 1+2 emissions per FTE employee were 8 metric tons CO2e, enter 8 in this field.
- If the target relates to a single Scope, this figure will be the same as the figure reported in either column 58, column 59, or column 77.
Does this target cover any land-related emissions? (column 79)
- A brief description of land-related emissions (i.e., GHG emissions from Agriculture, Forestry and Other Land Use (AFOLU)) is provided as additional information to this question.
- In addition, refer to the CDP Technical Note on Science-Based Targets for further detail and how to assess your target against the Science Based Targets initiative’s criteria.
- Yes, it covers land-related emissions only (e.g. FLAG SBT) – Select this option if your target only covers GHG emissions related to land and agriculture and excludes emissions and removals associated with bioenergy, in line with SBTi guidance. Companies that have followed the SBTi Forests, Land and Agriculture (FLAG) guidance to set their target should select this option. This option will primarily be applicable to companies in the Agricultural Commodities, Food, Beverage & Tobacco, and Paper & Forestry CDP sectors.
- Yes, it covers land-related and non-land related emissions (e.g. SBT approved before the release of FLAG target-setting guidance) – Select this option if your target covers both GHG emissions related to land and agriculture and non-land related emissions from energy/industry. This option will be primarily applicable to companies in the Agricultural Commodities, Food, Beverage & Tobacco and Paper and Forestry CDP sectors whose target was approved by the SBTi before the release of the SBTi FLAG target-setting guidance.
- Yes, it covers land-related CO2 emissions/removals associated with bioenergy and non-land related emissions (e.g. non-FLAG SBT with bioenergy) – Select this option if your target covers CO2 emissions from the combustion, processing and distribution phase of bioenergy and/or land use emissions and removals associated with bioenergy feedstocks, in addition to non-land related emissions from energy/industry. This option could apply to companies in any CDP sector with a target that includes emissions from bioenergy.
- No, it does not cover any land-related emissions (e.g. non-FLAG SBT) – Select this option if your target only covers non-land related emissions from energy/industry.
- If you select any “Yes…” option, specify the types of land-related emissions covered by the target in the “Please explain target coverage and identify any exclusions” column.
% of target achieved relative to base year [auto-calculated] (column 80)
- This column will be auto-calculated in the ORS.
- The target’s percentage completion (in terms of emissions) relative to the base year will be calculated from the “Intensity figure in base year for all selected Scopes” (column 31), “Targeted reduction from base year” (column 54), and the “Intensity figure in reporting year for all selected Scopes” (column 78) columns. Ensure you have entered data into these columns.
- E.g. if your target is to reduce your Scope 1+2 emissions per FTE employee by 22% and in the reporting year your Scope 1+2 emissions per FTE employee had reduced by 11% compared to the base year, this column will display 50 as your target is 50% complete.
- Negative values indicate an increase in the emissions intensity figure compared to the base year.
- Values greater than 100 incidate that you have exceeded your target.
- This column will not appear if you set a target to stabilize your emissions intensity at the base year level, i.e. if you have entered 0 (zero) in column “Targeted reduction from base year (%)” (column 54).
Target status in reporting year (column 81)
- New – Select this option for targets that have been set in the reporting year and are still in progress.
- Underway – Select this option for targets that were set before the reporting year, with a target year in the future, that have not been achieved and continue to be pursued.
- Achieved – Select this option for targets that have been achieved or exceeded in the reporting year.
- Expired – Select this option for targets with a target year of the reporting year, that have not been achieved and have therefore expired in the reporting year.
- Revised – Select this option for targets that were set before the reporting year but a revision has been made to any of the elements in columns 2 to 79 in the reporting year, for example due to a recalculation of the base year emissions intensity or a change to the target year.
- Replaced – Select this option for previously reported targets that have been replaced with another target in the reporting year, for example where a facility target has been incorporated into a company-wide target.
- Retired – Select this option for targets with a target year in the future, that have not been achieved, but will no longer be pursued. Provide more information as to why this target was retired in the “Please explain target coverage and identify any exclusions” column.
Please explain target coverage and identify any exclusions (column 82)
- If the target is not company-wide (i.e. it does not apply to the whole company in line with your definition of the reporting boundary) provide further details of your target coverage in this column. E.g. if you have selected “Country/area/region” in column 5, please specify which countries/areas/regions your target covers.
- If you have excluded any relevant Scopes or Scope 3 categories from your target, state the reason for omitting these Scopes or Scope 3 categories and outline any steps you are taking to enable target-setting for relevant Scopes or Scope 3 categories.
- If you selected any “Yes…” option in column 76, specify the types of
land-related emissions that are covered by the target from those listed
below. Refer to the additional information and the
SBTi FLAG Guidance for more information.
- Direct land use change emissions – All direct emissions from land
use change, including those associated with livestock feed and
conversion of natural forests to plantation. Includes CO
2
emissions from land use change associated with deforestation and forest
degradation, including conversion of natural forest to plantation
following GHG Protocol definitions, and CO
2
emissions from land use change associated with conversion of coastal
wetlands (mangroves, seagrass and marshes); conversion, draining and/or
burning of peatlands; and conversion of savannas and natural grasslands.
- Indirect land use change emissions – Carbon stock loss due to land
conversion on lands not owned or controlled by the company or in its
supply chain, induced by change in demand for products produced or
sourced by the company.
- Land management emissions – All emissions from land management; CO2 emissions
related to on-farm vehicles and fertilizer production are also
included, as they are commonly embedded in accounting tools and emission
factors associated with land management. Includes methane emissions
from manure management, enteric fermentation, and flooded soil (for
lowland rice); direct and indirect N
2O
emissions from manure management, crop residue, fertilizer application
and fertilizer leaching, runoff and volatilization; methane and N
2O emissions from agricultural waste burning; CO2 emissions from machinery used on farm and transport of biomass; and CO2 and N2O emissions from fertilizer production.
- Biological carbon removals and storage not associated with
bioenergy feedstocks – Carbon sequestration from improved forest
management, agroforestry, forest restoration, silvopasture, soil organic
carbon and biochar, excluding removals from the production and end use
of bioenergy.
- Biogenic emissions and associated removals from bioenergy feedstocks – CO2, CH4 and N2O
emissions from the combustion, processing and distribution phase of
bioenergy and the land use emissions and removals associated with
bioenergy feedstocks.
- You can use this column to identify where you have a financial year or average year based target.
- If your target was originally in a different format, you may wish to give the original target before it was converted into the format required for the purposes of this table.
- If your target is part of a wider carbon neutrality goal, a regulatory requirement, or a longer term target, you can also explain this here.
Plan for achieving target, and progress made to the end of the reporting year (column 83)
- This column only appears if you select “Underway”, “Revised”, or “New” in column 81 “Target status in reporting year”.
- Describe how you plan to achieve the target, including any emissions reduction initiatives your organization plans to implement.
- List the emissions reduction initiatives which have contributed most to any progress towards the target to the end of the reporting year.
- If you are not on track to achieve the target, explain how you plan to get back on track.
- If possible, specify your anticipated and/or observed progress curve in this column, i.e.:
- Linear – the rate of progress towards the target is anticipated and/or observed to be steady over time
- Logarithmic – the rate of progress towards the target is anticipated and/or observed to be faster at the start
- Exponential – the rate of progress towards the target is anticipated and/or observed to be faster at the end
- Variable – the rate of progress towards the target is anticipated and/or observed to change from year to year
List the emissions reduction initiatives which have contributed most to achieving this target since it was set (column 84)
- This column only appears if you select “Achieved” in column 81 “Target status in reporting year”.
- List the initiatives which contributed most to the emissions reductions achieved over the lifetime of the target.
Example response
The table below shows two intensity target examples:
Int 1: a target to reduce total emissions (scope 1 and market-based scope 2) per US$ revenue from company-wide operations by 40% by 2025, from a base year of 2019. The emissions in the base year are 0.0005 tCO2e/USD. The target emission intensity reduction would then be 0.0005 x 0.6 = 0.0003 tCO2e/USD. The target was set in 2020.
Int 2: a target to reduce emissions from business flights per FTE employee by 50% by 2026, from a base year of 2015. Emissions from flights account for 25% of all Scope 3 emissions. The emissions in the base year are 2.6 tCO2e/FTE. The target emission reduction would then be 2.6 x 0.5 = 1.3 tCO2e/FTE . The target was set in 2016.
| Target reference number
|
Is this a science-based target?
|
Target ambition*
|
Year target was set
|
Target coverage
|
Scope(s)
|
Scope 2 accounting method
|
| Int1
|
Yes, we consider this a science-based target, and we have committed to seek validation of this target by the Science-based target initiative in the next two years
|
1.5°C aligned
|
2020
|
Company-wide
|
|
Market-based
|
| Int2
|
No, and we do not anticipate setting one in the next two years
|
N/A
|
2016
|
Company-wide
|
Scope 3
|
N/A
|
|
Scope 3 category(ies)
|
Intensity metric
|
Base year
|
Intensity figure in base year for Scope 1 (metric tons CO2e per unit of activity)
|
Intensity figure in base year for Scope 2 (metric tons CO2e per unit of activity)
|
Intensity figure in base year for Scope 3, Category 6: Business travel (metric tons CO2e per unit of activity)
|
Intensity figure in base year for total Scope 3 (metric tons CO2e per unit of activity)
|
|
N/A
|
Metric tons CO2e per unit revenue
|
2019
|
0.0004
|
0.0001
|
N/A
|
N/A
|
|
Category 6: Business Travel
|
Metric tons CO2e per FTE employee
|
2015
|
N/A
|
N/A
|
2.6
|
2.6
|
| Intensity figure in base year for all selected Scopes (metric tons CO2e per unit of activity)
|
% of total base year emissions in Scope 1 covered by this Scope 1 intensity figure
|
% of total base year emissions in Scope 2 covered by this Scope 2 intensity figure
|
% of total base year emissions in Scope 3, Category 6: Business travel covered by this Scope 3, Category 6 intensity figure
|
% of total base year emissions in Scope 3 (in all Scope 3 categories) covered by this total Scope 3 intensity figure
|
% of total base year emissions in all selected Scopes covered by this intensity figure
|
Target year
|
| 0.0005
|
97
|
95
|
N/A
|
N/A
|
96
|
2025
|
| 2.6
|
N/A
|
N/A
|
100
|
25
|
25
|
2026
|
|
Targeted reduction from base year (%)
|
Intensity figure in target year for all selected Scopes (metric tons CO2e per unit of activity)
[auto-calculated]
|
% change anticipated in absolute Scope 1+2 emissions
|
% change anticipated in absolute Scope 3 emissions
|
Intensity figure in reporting year for Scope 1 (metric tons CO2e per unit of activity)
|
Intensity figure in reporting year for Scope 2 (metric tons CO2e per unit of activity)
|
Intensity figure in reporting year for Scope 3, Category 6: Business travel (metric tons CO2e per unit of activity)
|
| 40
|
0.0003
|
-25
|
N/A
|
0.00030
|
0.00003
|
N/A
|
| 50
|
1.3
|
N/A
|
-10
|
N/A
|
N/A
|
2
|
| Intensity figure in reporting year for total Scope 3 (metric tons CO2e per unit of activity)
|
Intensity figure in reporting year for all selected Scopes (metric tons CO2e per unit of activity) |
Does this target cover any land-related CO2 emissions?
|
% of target achieved
relative to base year [auto-calculated]
|
Target status in reporting year
|
Please explain target coverage and identify any exclusions
|
Plan for achieving target, and progress made to the end of the reporting year
|
List the emissions reduction initiatives which contributed most to achieving this target
|
| N/A
|
0.00033
|
No, it does not cover any land-related emissions (SBT)
|
85
|
Underway
|
The target covers most of our operations as per reporting boundary disclosed in C0.5. We have excluded a small amount of Scope 1 and 2 emissions from two small sites in South America (less than 700sqm) for which we don’t currently have data.
CO2 emissions and removals from bioenergy are not relevant to our organization.
|
Energy efficiency measures and operational improvements implemented at our offices in the US have already helped us reduce some of our emissions per unit revenue. However, most of the emissions reductions per unit revenue will be achieved by implementing our new company strategy that will change our business model to make it more sustainable and adapt to the needs of the 21st century. Please see details disclosed in module 3.
|
N/A
|
| 2
|
2
|
No, it does not cover any land-related emissions (SBT)
|
46
|
Underway
|
This target is based on financial year reporting: base year financial year 2015, reporting year financial year 2022, target year 2026.
CO2 emissions and removals from
bioenergy are not relevant to our organization. |
We have been taking advantage of videoconferencing opportunities where possible, but still interact with a number of clients where in person meetings and thus travel is still required. We are planning on scaling this back where possible and providing support for our clients to implement better videoconferencing where feasible.
However, this has not been enough to keep us on track to meet our targets. In order to get back on track, we are exploring options to compensate emissions from flights with our travel providers.
|
N/A
|
Additional information
Science-based targets
- Nearly 200 nations at COP21 wrote into the Paris Agreement that
globally we will aim to limit warming to below 2°C and pursue efforts to
limit warming to under 1.5°C. However, there is a large gap between the
level of ambition of the country/area commitments and targeted
temperatures. Companies, which are responsible for a vast majority of
the world’s emissions, must play a critical role in filling the gap left
by country/area commitments by raising the level of ambition in their
target setting and reducing their emissions in line with climate
science.
- Science-based target setting methods enable companies to set
emissions targets that are consistent with conserving the remaining
global emissions budget. A number of factors are taken into
consideration in order to determine what is most appropriate for a given
company. Please see the
Technical Note on Science Based Targets
and the 2023 climate change scoring methodology for information on best
practices in target setting and what CDP considers a science-based
target.
- Companies are very strongly encouraged to have their targets
officially evaluated by the Science Based Targets initiative (SBTi). CDP
considers targets approved by the initiative to reflect best practices
in science-based target setting. Due to the waiting list for target
validation, companies are encouraged to book a validation slot and
submit their targets to the SBTi as early as possible in order for these
targets to be used for scoring in CDP’s 2032 climate change
questionnaire.
- Regardless of submission to SBTi, companies are expected to report
emissions reductions targets in their CDP response. Targets that did not
pass the SBTi’s review process or that have not been submitted for
review prior to the deadline will still be evaluated using the
information disclosed by each company in their CDP response. See the
Technical Note for more details.
Science-based targets — bioenergy accounting
- As per the GHG Protocol Corporate Standard, GHG Protocol Corporate Value Chain (Scope 3) Standard and GHG Protocol Scope 2 Guidance, biogenic CO2 emissions and removals shall be reported alongside a company’s GHG inventory, separately from the Scopes. However, SBTi criterion 10 requires CO2
emissions from the combustion, processing and distribution of bioenergy
and the land use emissions and removals associated with bioenergy
feedstocks to be included in the target boundary when setting a
science-based target (in Scopes 1, 2 and/or 3, as relevant) and when
reporting progress against that target, even though such CO
2
emissions and/or removals are reported separately in a company’s GHG
inventory. Additionally, companies are expected to account for
land-based emissions and removals and set FLAG targets to address these
emissions. Land-based emissions and removals should be included within
the boundary of an SBTi-approved FLAG target when reporting progress
against that target. Companies should select whether their targets cover
land-based emissions and removals in column 76. Companies are expected
to adhere to any additional
GHG Protocol Guidance on accounting for land-based emissions when released in order to maintain compliance with the SBTi criteria.
(C4.1c) Explain why you did not have an emissions target, and forecast how your emissions will change over the next five years.
Question dependencies
This question only appears if you select “No target” in response to C4.1.
Change from last year
No change
Rationale
As setting a target is a pre-requisite for leadership in environmental practice, data users need to understand why companies do not have active targets guiding environmental strategy.
Response options
Please complete the following table:
| Primary reason | Five-year forecast | Please explain |
| Select from: - We are planning to introduce a target in the next two years
- Important but not an immediate business priority
- Judged to be unimportant, explanation provided
- Lack of internal resources
- Insufficient data on operations
- No instruction from management
- Other, please specify
| Text field [maximum 2,400 characters] | Text field [maximum 2,400 characters] |
Requested content
General
- If you select “Other, please specify,” provide a label for the "Primary reason".
Five-year forecast (column 2)
- Provide a qualitative and quantitative description of how you forecast your emissions will change over the next five years.
- It is acknowledged that this forecast will be an estimate, but it is expected that companies will:
- forecast the expected direction of change (e.g. whether their emissions will increase, decrease or experience no change overall over the next five years).
- provide a quantitative description of the forecasted change in emissions (e.g. Scope 1 emissions forecasted to decrease by 30 metric tons CO2e/ Scope 1 and Scope 2 emissions forecasted to increase by 10%/ Scope 3 emissions forecasted to decrease by 20%).
- provide a brief description of the reasons you forecast this change, or in the unlikely event no change, in emissions over the next five years. For example, this could be due to forecasted changes in output or expected emissions reduction activities.
Please explain (column 3)
- Provide an explanation of why you do not have a target and the timeline to implement one, if applicable.
Other climate-related targets
(C4.2) Did you have any other climate-related targets that were active in the reporting year?
Change from last year
No change
Rationale
Emissions reduction targets are not the only type of relevant targets that organizations use to drive change. CDP asks this question to allow companies to report climate goals separate from emissions reductions, recognizing that there are multiple types of targets.
Connection to frameworks
TCFD
Metrics & Targets recommended disclosure a) Disclose the metrics used by the organization to assess climate-related risks and opportunities in line with its strategy and risk management process.
Metrics & Targets recommended disclosure c) Describe the targets used by the organization to manage climate related risks and opportunities and performance against targets.
SDG
Goal 7: Affordable and clean energy
Goal 12: Responsible consumption and production
Goal 13: Climate action
Response options
Select all that apply from the following options:
- Target(s) to increase low-carbon energy consumption or production
- Target(s) to reduce methane emissions
- Net-zero target(s)
- Other climate-related target(s)
- No other climate-related targets
Requested content
Note for oil and gas and coal sectors:
- If you have a methane-specific emissions reduction target that was not reported in C4.1a/b, select “Target(s) to reduce methane emissions”. You will then receive a follow up question C4.2b where you can provide details of your methane-specific emissions reduction target.
- If you engage in oil and gas or coal mining activities and have not selected “Target(s) to reduce methane emissions” in this question, you will receive a follow up question C-CO4.2d/C-OG4.2d requesting information on why you do not have a methane-specific emissions reduction target and will be asked to forecast how your methane emissions will change.
- If methane emissions are not applicable to your organization, you will be given the opportunity to explain this in C-CO4.2d/C-OG4.2d.
Explanation of terms
- Target to reduce methane emissions, or “methane-specific target” is any target to reduce specifically methane (CH4) emissions e.g. reduction of leakage, venting or flaring of methane.
- Net-zero target: the SBTi Net-Zero Standard defines corporate net-zero as:
- reducing Scope 1, 2 and 3 emissions to zero or to a residual level that is consistent with reaching net-zero emissions at the global or sector level in eligible 1.5°C scenarios or sector pathways and;
- neutralizing any residual emissions at the net-zero target date and any GHG emissions released into the atmosphere thereafter.
(C4.2a) Provide details of your target(s) to increase low-carbon energy consumption or production.
Question dependencies
This question only appears if you select “Target(s) to increase low-carbon energy consumption or production” in response to C4.2.
Change from last year
Modified guidance
Rationale
Targets related to increasing low-carbon energy consumption or production can be an important element of organizations’ strategy to reduce their emissions.
Connection to other frameworks
SDG
Goal 7: Affordable and clean energy
Goal 12: Responsible consumption and production
Goal 13: Climate action
TCFD
Metrics & Targets recommended disclosure a) Disclose the metrics used by the organization to assess climate-related risks and opportunities in line with its strategy and risk management process.
Metrics & Targets recommended disclosure c) Describe the targets used by the organization to manage climate related risks and opportunities and performance against targets.
S&P Global Corporate Sustainability Assessment
Climate-Related Targets
TCFD Disclosure
RE100
Response options
Please complete the following table. The table is displayed over several rows for readability. You are able to add rows by using the “Add Row” button at the bottom of the table.
| 1
|
2
|
3
|
4
|
5
|
6
|
| Target reference number
|
Year target was set
|
Target coverage
|
Target type: energy carrier
|
Target type: activity
|
Target type: energy source
|
| Low1 – Low100
|
Numerical field [enter a number between 1900- 2023]
|
Select from:
- Company-wide
- Business division
- Business activity
- Site/facility
- Country/area/region
- Product level
- Other, please specify
|
Select from:
- Electricity
- Heat
- Steam
- Cooling
- All energy carriers
- Other, please specify
|
Select from:
|
Select from:
- Low-carbon energy source(s)
- Renewable energy source(s) only
|
| 7
|
8
|
9
|
10
|
11
|
12
|
13
|
| Base year
|
Consumption or production of selected energy carrier in base year (MWh)
|
% share of low-carbon or renewable energy in base year
|
Target year
|
% share of low-carbon or renewable energy in target year
|
% share of low-carbon or renewable energy in reporting year
|
% of target achieved relative to base year
[auto-calculated]
|
| Numerical field [enter a number between 1900- 2023]
|
Numerical field [enter a number from 0- 999,999,999,999 using a maximum of 10 decimal places and no commas]
|
Percentage field [enter a percentage from 0-100 using a maximum of 2 decimal places]
|
Numerical field [enter a number between 2018- 2100]
|
Percentage field [enter a percentage from 0-100 using a maximum of 2 decimal places]
|
Percentage field [enter a percentage from 0-100 using a maximum of 2 decimal places]
|
Percentage field
|
| 14
|
15
|
16
|
17
|
18
|
19
|
| Target status in reporting year
|
Is this target part of an emissions target?
|
Is this target part of an overarching initiative?
|
Please explain target coverage and identify any exclusions
|
Plan for achieving target, and progress made to the end of the reporting year
|
List the actions which contributed most to achieving this target
|
Select from:
- New
- Underway
- Achieved
- Expired
- Revised
- Replaced
- Retired
|
Text field [maximum 2,400 characters]
[Emissions reduction target ID]
|
Select all that apply:
- RE100
- Science Based Targets initiative
- No, it's not part of an overarching initiative
- Other, please specify
|
Text field [maximum 2,400 characters]
|
Text field [maximum 2,500 characters]
|
Text field [maximum 2,500 characters]
|
[Add Row]
Requested content
General
- If you are a member of the RE100 initative, you can use this question to self-report your progress towards achieving your RE100 target. Note that RE100 will use the data you report in module C8 (Energy) to come to its own assessment of your progress towards your RE100 target. If you have interim targets, they can be reported in this question in additional rows.
- If you have a renewable electricity procurement target approved by the SBTi, you can report progress towards achieving that target in this question.
Target reference number (column 1)
- Select a unique target reference from the drop-down menu provided to track progress against this target in subsequent reporting years.
Year target was set (column 2)
- Enter the year in which your company set the target.
- This must be either before or during the reporting year, but cannot be after the reporting year. It also cannot be after the target year.
- For year-on-year rolling targets, enter the year that you first set the target. This can be before the base year.
- If the target was set based on financial years, enter the year that applies to the end of your financial year and specify this in the “Please explain target coverage and identify any exclusions” column.
Target coverage (column 3)
- If the target applies to the whole company, select “Company-wide”. Members of the RE100 initiative should select this option to report their RE100 target. Note that “company” refers collectively to all the companies, businesses, organizations, other entities or groups that fall within your definition of the reporting boundary.
- If the target does not apply to the whole company, select the option that best describes the coverage of the target, and provide further details in the “Please explain target coverage and identify any exclusions” column. E.g. if your target applies only to your European operations, select “Country/area/region” in this column and specify the country/area/region in the column “Please explain target coverage and identify any exclusions”
Target type: energy carrier (column 4)
- Select the energy carrier to which your target relates.
- If your target relates to electricity, heat, steam and cooling combined, select “All energy carriers”
- If your target relates to multiple, but not all, energy carriers, select “Other, please specify” and indicate the energy carriers your target relates to.
- Members of the RE100 initiative should select “Electricity” to report their RE100 target.
Target type: activity (column 5)
- Members of the RE100 initiative should select “Consumption” in this column to report their RE100 target.
Target type: energy source (column 6)
- Select whether the target relates to increasing consumption or production of low-carbon energy, or of renewable energy specifically. Definitions are provided in the explanation of terms below.
- Members of the RE100 initative should select “Renewable energy source(s) only” to report their RE100 target.
Base year (column 7)
- The base year is the year against which you are comparing your target.
- The base year cannot be after the reporting year.
- For RE100 targets, the base year is usually the year that your organization committed to the RE100 initiative. This may be the same as the “Year target was set” (column 2).
- If you have a year-on-year rolling target, the base year will be the previous reporting year.
- If you have a target based on financial years, enter the year that applies to the end of your financial year and specify this in the “Please explain target coverage and identify any exclusions” column.
- If you have a target based on an average over a period of time (e.g. 5-year average), enter the year that applies to the end of the average period and specify this in the “Please explain target coverage and identify any exclusions” column.
Consumption or production of selected energy carrier in base year (MWh) (column 8)
- Enter the absolute base year value for the target in megawatt hours (MWh). Note that this figure should be consistent with your selections in columns 3-6.
- E.g. if your target is to achieve 100% renewable electricity consumption in your European operations by a target year of 2025 compared with a base year of 2015, enter in MWh the absolute renewable electricity consumed by your European operations in 2015 in this column.
- E.g. for RE100 members, if your company-wide RE100 target is to achieve 100% renewable electricity consumption for your entire operations by a target year of 2025, enter in MWh the absolute renewable electricity consumed across all of your operations in the base year (i.e. the year that your organization committed to the RE100 intiaitve as specified in column 7).
- If your target relates to multiple energy carriers, enter the total MWh in the base year for all energy carriers.
% share of low-carbon or renewable energy in base year (column 9)
- Enter percentage share of low-carbon or renewable energy in the base year covered by the target.
- This is the low-carbon or renewable energy in the base year covered by the target (reported in column 8) as a percentage of the total energy in the base year covered by the target.
- E.g. if your target is to achieve 100% renewable electricity consumption in your European operations by a target year of 2025 compared with a base year of 2015, and in 2015 the renewable proportion of the total electricity consumed by your European operations was 40%, you should enter 40 in this column.
- E.g. for RE100 members, if your company-wide RE100 target is to achieve 100% renewable electricity consumption for your entire operations by a target year of 2025, and the renewable proportion of the total electricity consumed across all of your operations in the base year (i.e. the year that your organization committed to the RE100 intiaitve as specified in column 7) was 60%, you should enter 60 in this column.
Target year (column 10)
- Enter the year that the target ends. For example, if the target is to increase renewable energy production by 200% by 2030, the target year is 2030.
- If you have a target based on financial years, enter the year that applies to the end of your financial year and specify in the “Please explain target coverage and identify any exclusions” column.
- If you have a target based on an average over a period of time (e.g. 5-year average), enter the year that applies to the end of the average period and specify this in the “Please explain target coverage and identify any exclusions” column.
- You should not report any target that was achieved before the start of the reporting year.
% share of low-carbon or renewable energy in target year (column 11)
- Enter the percentage share of low-carbon or renewable energy covered by the target to be achieved in the target year. This indicates your target ambition.
- E.g. if your target is to achieve 100% renewable electricity consumption in your European operations by a target year of 2025 compared with a base year of 2015, enter 100 in this column.
- Members of the RE100 initiative should enter “100” in this column to report their RE100 target.
% share of low-carbon or renewable energy in reporting year (column 12)
- Enter the percentage share of low-carbon or renewable energy covered by the target in the reporting year.
- E.g. if your target is to achieve 100% renewable electricity consumption in your European operations by a target year of 2025 compared with a base year of 2015, and in the reporting year the renewable proportion of the total electricity consumed by your European operations was 80%, you should enter 80 in this column.
- If you are a member of the RE100 initiative, this column allows you to self-report progress against achieving your RE100 target. Note that RE100 will use the data you report in module C8 (Energy) to come to its own assessment of your progress towards your RE100 target.
- E.g. for RE100 members, if your company-wide RE100 target is to achieve 100% renewable electricity consumption for your entire operations by a target year of 2025, and in the reporting year the renewable proportion of the total electricity consumed across all of your operations was 90%, you should enter 90 in this column.
% of target achieved relative to base year [auto-calculated] (column 13)
- This column will be auto-calculated in the ORS.
- The target’s percentage completion compared with the base year will be calculated from the “% share of low-carbon or renewable energy in base year” (column 9), ‘% share of low-carbon or renewable energy in target year” (column 11), and “% share of low-carbon or renewable energy in reporting year” (column 12) columns. Ensure you have entered data into these columns.

- E.g. if your target is to achieve 100% renewable electricty consumption in your European operations by 2025 compared with 40% renewable electricity consumption in a base year of 2015, and in the reporting year you achieved 80% renewable electricty consumption, this column will display 66 as you have achieved 66% of your targeted increase in renewable electricty compared with the base year.
- Negative values indicate a decrease in low carbon or renewable energy consumption or production compared to the base year.
- Values greater than 100 incidate that you have exceeded your target.
- If you are a member of the RE100 initiative, note that this column is not used to assess progress against your RE100 target. The RE100 target is considered to be achieved when the % share of renewable electricity in the reporting year is equal to 100%.
Target status in reporting year (column 14)
- New – Select this option for targets that have been set in the reporting year and are still in progress.
- Underway – Select this option for targets that were set before the reporting year, with a target year in the future, that have not been achieved and continue to be pursued.
- Achieved – Select this option for targets that have been achieved or exceeded in the reporting year.
- Expired – Select this option for targets with a target year of the reporting year, that have not been achieved and have therefore expired in the reporting year.
- Revised – Select this option for targets that were set before the reporting year but a revision has been made to any of the elements in columns 2 to 12 in the reporting year, for example due to a recalculation or a change to the target year.
- Replaced – Select this option for previously reported targets that have been replaced with another target in the reporting year, for example where a facility target has been incorporated into a company-wide target.
- Retired – Select this option for targets with a target year in the future, that have not been achieved, but will no longer be pursued. Provide more information as to why this target was retired in the “Please explain target coverage and identify any exclusions” column.
Is this target part of an emissions target? (column 15)
- If the target is part of an emissions reduction target reported in C4.1a or C4.1b, enter the emissions reduction target reference number here.
Is this target part of an overarching initiative? (column 16)
- If the target is part of an overarching initaive, select the initative or select “Other, please specify” to outline the initiative.
- If you are a member of the RE100 initiative, ensure to select “RE100” here.
Please explain target coverage and identify any exclusions (column 17)
- If the target does not apply to the whole organization (i.e. the target coverage is not “Company-wide”), provide further details of your target coverage in this column. E.g. if you have selected “Country/area/region” in column 3, please specify which countries/areas/regions your target covers.
- If the target relates to low-carbon or renewable energy consumption, indicate whether the target covers all low-carbon or renewable energy consumption (i.e., the consumption of both self-generated and purchased/acquired energy) or only the consumption of purchased/acquired low-carbon or renewable energy.
- If you reported a renewable energy consumption or production target in C4.2 last year and are reporting progress against the same target this year, indicate this in this column.
- You can use this column to identify where you have a financial year or average year based target.
- If your target was originally in a different format, you may wish to give the original target before it was converted into the format required for the purposes of this table.
- If your target is part of a wider carbon neutrality goal, a regulatory requirement, or a longer term target, you can also explain this here.
Plan for achieving target, and progress made to the end of the reporting year (column 18)
- This column is only presented if “Underway”, Revised”, or “New” is selected in column 14 “Target status in reporting year”.
- Describe how you plan to achieve the target, and list the actions which have contributed most to any progress towards the target.
- If you are not on track to achieve the target, explain how you plan to get back on track.
List the actions which contributed most to achieving this target (column 19)
- This column is only presented if “Achieved” is selected in column 14 “Target status in reporting year”.
Explanation of terms
- Low-carbon energy: In line with the IEA definition, low-carbon technologies are technologies that produce low – or zero – greenhouse-gas emissions while operating. In the power sector this includes fossil-fuel plants fitted with carbon capture and storage, nuclear plants and renewable-based generation technologies. Natural gas, combined cycle gas turbine and fossil fuel-based combined heat and power (cogeneration), despite being less carbon intensive than other means of electricity production like coal, are not considered low-carbon.
- Renewable energy: CDP follows the definition of renewable energy given in the GHG Protocol, i.e. “energy taken from sources that are inexhaustible, e.g. wind, water, solar, geothermal energy and biofuels”.
Example response
The table below shows three low-carbon energy target examples:
1. Low 1: a company-wide RE100 target to increase the proportion of electricity consumed from renewable sources from 30% to 100% within 10 years from 2015. This target is part of the company’s absolute Scope 2 emissions reduction target reported in C4.1a.
2. Low 2: a company-wide target to increase the proportion of heat consumed from low-carbon sources by 2% per year. This is a year-on-year rolling target that was set in 2010, therefore the target year is the current reporting year (2020), and the base year is the previous reporting year (2019).
3. Low 3: a company-wide target set in 2015 to double renewable electricity production from 20% to 40% by 2025.The target status is revised in the reporting year due to bringing forward the target year from 2030 to 2025.
| Target reference number
|
Year target was set
|
Target coverage
|
Target type: energy carrier
|
Target type: activity
|
Target type: energy source
|
Base year
|
Consumption or production of selected energy carrier in base year (MWh)
|
% share of low-carbon or renewable energy in base year
|
| Low 1
|
2015
|
Company-wide
|
Electricity
|
Consumption
|
Renewable energy source(s) only
|
2015
|
87,000
|
30
|
Low 2
|
2010
|
Company-wide
|
Heat
|
Consumption
|
Low-carbon energy source(s)
|
2019
|
350
|
19
|
Low 3
|
2015
|
Company-wide
|
Electricity
|
Production
|
Renewable energy source(s) only
|
2015
|
9,200
|
20
|
|
Target year
|
% share of low-carbon or renewable energy in target year
|
% share of low-carbon or renewable energy in reporting year
|
% of target achieved relative to base year [auto-calculated]
|
Target status in reporting year
|
Is this target part of an emissions target?
|
Is this target part of an overarching initiative?
|
| 2025
|
100
|
70
|
57
|
Underway
|
Abs 2
|
RE100
|
2020
|
21
|
21.5
|
125
|
Achieved
|
No
|
No, it’s not part of an overarching initiative
|
| 2025
|
40
|
34
|
70
|
Revised
|
No
|
No, it’s not part of an overarching initiative
|
|
Please explain target coverage and identify any exclusions
|
Plan for achieving target, and progress made to the end of the reporting year
|
List the actions which contributed most to achieving this target
|
|
In 2015 we joined the RE100 initiative and set a company-wide target to achieve 100% renewable electricity consumption within 10 years, from a base year of 30% renewable electricity consumption. This target is part of our absolute Scope 2 emissions reduction target Abs 2.
|
We have started a process of purchasing an increasing amount of EACs to cover the electricity we use where these are available. Elsewhere we are planning on implementing a green tariff agreement to source renewable electricity and implementing energy efficiency measures to cut down our consumption of electricity and thus increase our proportion of renewables consumption.
By the reporting year, we had achieved 70% renewable electricity consumption, thus achieved 57% of our targeted increase in renewable electricity compared with the base year. The target is still underway.
|
N/A
|
|
In 2010 we set a company-wide year-on-year target to increase the proportion of heat consumed from low-carbon sources by 2% per year. This target is company-wide and covers all our operations
|
N/A
|
Installing low-carbon sources of heat such as ground source heat pumps has been key action in fulfilling our target. Increasing energy efficiency and improving insulation have also contributed.
|
|
In 2015 we set a 15-year target to double our share of renewable electricity production by 2030, compared to 2015 levels. The target covers all our operations and is company-wide.
|
In the reporting year we revised this target to bring the target year forwards to 2025, as due to the decreased costs of solar PV equipment, we are already 70% of the way to achieving this target and should now achieve it before 2025.
We plan to continue bringing additional solar generation facilities online and are making additional investments into our existing facilities to improve their efficiency.
|
N/A
|
(C4.2b) Provide details of any other climate-related targets, including methane reduction targets.
Question dependencies
This question only appears if you select “Other climate-related target(s)” or “Target(s) to reduce methane emissions” in response to C4.2.
Change from last year
Minor change
Rationale
Other climate-related targets can be an
important element of organizations’ strategy to reduce their emissions. This
question increases transparency of corporate environmental commitments.
Connection to frameworks
SDG
Goal 7: Affordable and clean energy
Goal 12: Responsible consumption and production
Goal 13: Climate action
TCFD
Metrics & Targets recommended disclosure a) Disclose the metrics used by the organization to assess climate-related risks and opportunities in line with its strategy and risk management process.
Metrics & Targets recommended disclosure c) Describe the targets used by the organization to manage climate related risks and opportunities and performance against targets.
S&P Global Corporate Sustainability Assessment
Climate-Related Targets
TCFD Disclosure
Response options
Please complete the following table. The table is displayed over several rows for readability. You are able to add rows by using the “Add Row” button at the bottom of the table.
| 1
|
2
|
3
|
4
|
5a
|
5b
|
6
|
| Target reference number
|
Year target was set
|
Target coverage
|
Target type: absolute or intensity
|
Target type: category
|
Metric (target numerator if reporting an intensity target)
|
Target denominator (intensity targets only)
|
| Oth1 – Oth100
|
Numerical field [enter a number between 1900- 2023]
|
Select from:
- Company-wide
- Business division
- Business activity
- Site/facility
- Country/area/region
- Product level
- Other, please specify
|
Select from:
|
Select from:
- Energy productivity
- Energy consumption or efficiency
- Renewable fuel production
- Renewable fuel consumption
- Waste management
- Resource consumption or efficiency
- Low-carbon vehicles
- Low-carbon buildings
- Land use change
- Methane reduction target
- Fossil fuel reduction target
- Engagement with suppliers
- Engagement with customers
- R&D investments
- Green finance
- Other, please specify
|
Select from drop-down options below
|
Select from drop-down options below
|
| 7
|
8
|
9
|
10
|
11
|
12
|
| Base year
|
Figure or percentage in base year
|
Target year
|
Figure or percentage in target year
|
Figure or percentage in reporting year
|
% of target achieved relative to base year
[auto-calculated]
|
| Numerical field [enter a number between 1900- 2023]
|
Numerical field [enter a number from 0- 999,999,999,999,999 using a maximum of 10 decimal places and no commas]
|
Numerical field [enter a number between 2018- 2100]
|
Numerical field [enter a number from 0- 999,999,999,999,999 using a maximum of 10 decimal places and no commas]
|
Numerical field [enter a number from 0- 999,999,999,999,999 using a maximum of 10 decimal places and no commas]
|
Percentage field
|
| 13
|
14
|
15
|
16
|
17
|
18
|
| Target status in reporting year
|
Is this target part of an emissions target?
|
Is this target part of an overarching initiative?
|
Please explain target coverage and identify any exclusions
|
Plan for achieving target, and progress made to the end of the reporting year
|
List the actions which contributed most to achieving this target
|
Select from:
- New
- Underway
- Achieved
- Expired
- Revised
- Replaced
- Retired
|
Text field [maximum 2,400 characters
[Emissions reduction target ID]
|
Select all that apply:
- EP100
- EV100
- Below50 – sustainable fuels
- Science Based Targets initiative – approved supplier engagement target
- Science Based Targets initiative – approved customer engagement target
- Science Based targets initiative - other
- Reduce short-lived climate pollutants
- Remove deforestation
- Low-Carbon Technology Partnerships initiative
- No, it’s not part of an overarching initiative
- Other, please specify
|
Text field [maximum 2,400 characters]
|
Text field [maximum 2,500 characters]
|
Text field [maximum 2,500 characters]
|
[Add Row]
Metric (target numerator if reporting an intensity target) drop-down options:
Select one of the following options:
Energy productivity
- GDP
- USD ($) value-added
- units of revenue
- ounces of gold
- ounces of platinum
- metric tons of aggregate
- metric tons of aluminum
- metric tons of steel
- metric tons of cement
- metric tons of cardboard
- metric tons of product
- metric tons of ore processed
- square meters
- kilometers
- passenger kilometers
- revenue passenger kilometers
- liters of product
- units of production
- units of service provided
- square feet
- megawatt hours (MWh)
- barrel of oil equivalents (BOE)
- ton of oil equivalents (TOE)
- ton of coal equivalents (TCE)
- Other, please specify
Energy consumption or efficiency
- kWh
- MWh
- GJ
- million Btu
- boe
- toe
- tce
- Gcal
- Other, please specify
Renewable fuel production
- metric tons of solid biomass
- liters of liquid biofuel
- cubic meters of biogas
- cubic meters of hydrogen
- Other, please specify
Renewable fuel consumption
- metric tons of solid biomass
- liters of liquid biofuel
- cubic meters of biogas
- cubic meters of hydrogen
- Percentage of total fuel consumption that is from renewable sources
- Other, please specify
Waste management
- metric tons of waste diverted from landfill
- metric tons of waste recycled
- metric tons of waste reused
- metric tons of waste generated
- Percentage of total waste generated that is recycled
- Percentage of sites operating at zero-waste to landfill
- Other, please specify
Resource consumption or efficiency
- Percentage of paper from recycled or certified sustainable sources
- metric tons of paper consumed
- Percentage of plastic form recycled sources
- metric tons of plastic consumed
- Percentage of packaging from recycled or certified sustainable sources
- metric tons of packaging consumed
- Other, please specify
Low-carbon vehicles
- Percentage of low-carbon vehicles in company fleet
- Percentage of low-carbon vehicles sold
- Percentage of company fleet using biofuel
- Percentage of battery electric vehicles in company fleet
- Percentage of conventional hybrids in company fleet
- Percentage of plug-in hybrids in company fleet
- Percentage of fuel cell electric vehicles in company fleet
- Percentage of company facilities with electric vehicle infrastructure
- Other, please specify
|
Low-carbon buildings
- Percentage of net zero carbon buildings
- Percentage of net zero energy buildings
- Percentage of buildings with a green building certificate
- Other, please specify
Land use change
- hectares reforested
- hectares afforested
- hectares restored
- Percent of supply chain compliant with zero gross deforestation
- Other, please specify
Methane reduction target
- cubic meters of methane vented
- cubic meters of methane leaked
- cubic meters of methane flared
- Total methane emissions in m3
- Total methane emissions in CO2e
- Methane leakage rate (%)
- Other, please specify
Fossil fuel reduction target
- cubic meters of natural gas consumed
- metric tons of coal consumed
- barrels of oil consumed
- Percentage of fossil fuels in the fuel mix
- Other, please specify
Engagement with suppliers
- Percentage of suppliers (by emissions) disclosing their GHG emissions
- Percentage of suppliers (by procurement spend) disclosing their GHG emissions
- Percentage of suppliers (by emissions) setting emissions reduction targets
- Percentage of suppliers (by procurement spend) setting emissions reductions targets
- Percentage of suppliers (by emissions) with a science-based target
- Percentage of suppliers (by procurement spend) with a science-based target
- Percentage of suppliers (by emissions) actively engaged on climate-related issues
- Percentage of suppliers (by procurement spend) actively engaged on climate-related issues
- Other, please specify
Engagement with customers
- Percentage of customers (by emissions) disclosing their GHG emissions
- Percentage of customers (by emissions) setting emissions reduction targets
- Percentage of customers (by emissions) with a science-based target
- Percentage of customers (by emissions) actively engaged on climate-related issues
- Other, please specify
R&D investments
- Percentage of annual revenue invested in R&D of low-carbon products/services
- US$ invested in R&D of low-carbon products/services
- Percentage of R&D budget/portfolio dedicated to low-carbon products/services
- Other, please specify
Green finance
- Total amount of green bonds outstanding (green bond ratio)
- Percentage of green bonds
- Total amount of green debt instruments outstanding (green debt ratio)
- Percentage of green debt instruments
- Green finance raised and facilitated (denominated in currency)
- Green investments (denominated in currency)
- Percentage of green investments
- Other, please specify
|
Target denominator (intensity targets only) drop-down options:
Select one of the following options:
- KWh
- MWh
- GJ
- Btu
- boe
- toe
- tce
- Gcal
- revenue passenger kilometer
- USD($) value-added
- square meter
- metric ton of aluminum
- metric ton of steel
- metric ton of cement
- metric ton of cardboard
- unit revenue
- unit FTE employee
- unit hour worked
- metric ton of product
- liter of product
- unit of production
- unit of service provided
- square foot
- kilometer
- passenger kilometer
- megawatt hour (MWh)
- barrel of oil equivalent (BOE)
- vehicle produced
- metric ton of ore processed
- ounce of gold
- ounce of platinum
- metric ton of aggregate
- billion (currency) funds under management
- hectare
- metric ton of waste
- liter of fuel
- year
- total amount of bonds outstanding at the end of the reporting period
- total amount of debt outstanding at the end of the reporting period
- Other, please specify
Requested content
General
- If you are a member of the EP100 and/or EV100 initiative, you can use this question to report on your progress towards achieving your target.
- To correctly report the progress against a stabilization target, i.e. a target to maintain a certain level of performance (e.g. to maintain a zero waste to landfill target for 100% of sites), you should treat it as a target that is reset every year. In this case, “base year” corresponds to the beginning of the reporting year where your indicator is reset to zero for that year, and “target year” corresponds to the end of the reporting year where you report the performance achieved in the reporting year.
Target reference number (column 1)
- Select a unique target reference from the drop-down menu provided to identify this target in subsequent questions and to track progress against this target in subsequent reporting years.
Year target was set (column 2)
- Enter the year in which your company has set the target.
- This must be either before or during the reporting year, but cannot be after the reporting year. It also cannot be after the target year.
- For year-on-year rolling targets, enter the year that you first set the target. This can be before the base year.
- If the target was set based on financial years, enter the year that applies to the end of your financial year and specify this in the “Please explain target coverage and identify any exclusions” column.
Target coverage (column 3)
- If your target applies to the whole organization, select “Company-wide”. Note that “company” refers collectively to all the companies, businesses, organizations, other entities or groups that fall within your definition of the reporting boundary.
- If your target does not relate to the whole organization, select the option that best describes the coverage of the target, and provide further details in the “Please explain target coverage and identify any exclusions” column.
- E.g. if your target relates applies only to your office-based operations, select “Business activity”.
Target type: absolute or intensity (column 4)
- Select whether the target is an absolute or an intensity target, regardless of whether you measure it in absolute (e.g. MWh) or relative (%) values. E.g. if your target is to increase the percentage of low-carbon vehicles in the company fleet, select “absolute”.
Target type: category (column 5a)
- Note that a selection must be made for both column 5a and column 5b. Your data will not be saved if either column is left blank.
Metric (target numerator if reporting an intensity target) (column 5b)
- Select the metric relevant to the target – for intensity targets this will be the target numerator.
- Note that only the options relevant to the target category selected in column 5a will be displayed in the ORS.
- Note that a selection must be made for both column 5a and column 5b. Your data will not be saved if either column is left blank.
Target denominator (intensity targets only) (column 6)
- Select the metric denominator of your climate-related intensity target. This column will only appear if you selected “Intensity” in column 4.
Base year (column 7)
- The base year cannot be after the reporting year.
- The base year is the year against which you are comparing your target
- If you have a year-on-year rolling target, your base year will be the previous reporting year.
- If you have a stabilization target, i.e. a target to maintain a certain level of performance (e.g. to maintain a zero waste to landfill target for 100% of sites), your base year will be the current reporting year.
- If you have a target based on financial years, enter the year that applies to the end of your financial year and specify this in the “Please explain target coverage and identify any exclusions” column.
- If you have a target based on average emissions over a period of time (e.g. 5-year average), enter the year that applies to the end of the average period and specify this in the “Please explain target coverage and identify any exclusions” column.
Figure or percentage in base year (column 8)
- Enter the base year value for your target. Note that this will be a percentage if you have selected any percentage option as your metric in column 5b.
- E.g. if your target is to increase the percentage of low-carbon vehicles in the company fleet to 60% by a target year of 2021, compared with 40% low-carbon vehicles in the company fleet in a base year of 2016, enter 40 in this column.
- If you have a stabilization target i.e. a target to maintain a certain level of performance (e.g. to maintain a zero waste to landfill target for 100% of sites), enter 0 (or 0%), as your performance for this target is reset at the beginning of every reporting year.
Target year (column 9)
- Enter the year that the target ends. For example if the target is to reduce methane emissions by 50% by 2030, the target year is 2030.
- If you have a year-on-year rolling target or stabilization target, your target year will be the reporting year.
- If you have a target based on financial years, enter the year that applies to the end of your financial year and specify in the “Please explain target coverage and identify any exclusions” column.
- If you have a target based on an average over a period of time (e.g. 5-year average), enter the year that applies to the end of the average period and specify in the “Please explain target coverage and identify any exclusions” column.
- You should not report any target that was achieved before the start of the reporting year.
Figure or percentage in target year (column 10)
- Enter the target year value for your target.
- E.g. if your target is to increase the percentage of low-carbon vehicles in your company fleet to 60% by a target year of 2021, compared with 40% low-carbon vehicles in the company fleet in a base year of 2016, enter 60 in this column.
Figure or percentage in reporting year (column 11)
- Enter the reporting year value for your target.
- E.g. if your target is to increase the percentage of low-carbon vehicles in your company fleet to 60% by a target year of 2021, compared with 40% low-carbon vehicles in the company fleet a base year of 2016, and in the reporting year you have achieved 55% low-carbon vehicles in the company fleet, enter 55 in this column.
- If you are reporting a stabilization target i.e. a target to maintain a certain level of performance (e.g. to maintain a zero waste to landfill target for 100% of sites), enter the value achieved at the end of the reporting year (e.g. 100% if you managed to maintain your target for the share of zero waste to landfill sites).
% of target achieved relative to base year [auto-calculated] (column 12)
- This column will be auto-calculated in the ORS.
- The target’s percentage completion compared with the base year will be calculated from the “Figure or percentage in base year” (column 8), “Figure or percentage in target year” (column 10), and the “Figure or percentage in reporting year” (column 11) columns. Ensure you have entered data into these columns.
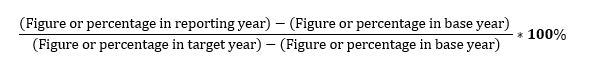
- E.g. if your target is to increase the percentage of low-carbon vehicles in your company fleet to 60% by a target year of 2021, compared with 40% low-carbon vehicles in the company fleet in a base year of 2016, and in the reporting year you have achieved 55% low-carbon vehicles in the company fleet, this column will display 75, as you have achieved 75% of your targeted % increase in low-carbon vehicles compared with the base year
- Negative values indicate that you have made negative progress towards your target. E.g. in the above example, that you have reduced the percentage of low-carbon vehicles in the company fleet, when compared with the base year.
- Values greater than 100% indicate that you have exceeded your target.
Target status in reporting year (column 13)
- New - Select this option for targets that have been set in the reporting year and are still in progress.
- Underway - Select this option for targets that were set before the reporting year, with a target year in the future, that have not been achieved and continue to be pursued.
- Achieved - Select this option for targets which have been achieved or exceeded in the reporting year.
- Expired - Select this option for targets with a target year of the reporting year, that have not been achieved and have therefore expired in the reporting year.
- Revised - Select this option for targets that were set before the reporting year but a revision has been made in the reporting year, for example due to a recalculation or a change to the target year.
- Replaced - Select this option for previously reported targets that have been replaced with another target in the reporting year, for example where a facility target has been incorporated into a company-wide target.
- Retired - Select this option for targets with a target year in the future, that have not been achieved, but will no longer be pursued. Provide more information as to why this target was retired in the “Please explain target coverage and identify any exclusions” column.
Is this target part of an emissions target? (column 14)
- If the target is part of an emissions reduction target reported in C4.1a or C4.1b, please enter the emissions reduction target reference number here.
Is this target part of an overarching initiative? (column 15)
- If the climate-related target is part of an overarching initiative, select the initiative or select “Other, please specify” to outline the initiative.
Please explain target coverage and identify any exclusions (column 16)
- If the target does not apply to the whole organization (i.e. the target coverage is not “Company-wide”, provide further details of your target coverage in this column. E.g. if you have selected “Country/area/region” in column 3, please specify which countries/areas/regions your target covers.
- You can use this column to identify where you have a financial year or average year based target.
- If your target is part of a wider carbon neutrality goal, a regulatory requirement, or a longer term target, you can also explain this here.
Plan for achieving target, and progress made to the end of the reporting year (column 17)
- This column is only presented if “Underway”, “Revised”, or “New” is selected in column 13 “Target status in reporting year”.
- Describe how you plan to achieve the target, and list the actions which have contributed most to any progress towards the target.
- If you are not on track to achieve the target, explain how you plan to get back on track.
List the actions which contributed most to achieving this target (column 18)
- This column is only presented if “Achieved” is selected in column 13 “Target status in reporting year”.
Note for oil and gas and coal sector:
- If you have a methane-specific emissions reduction target that was not reported in C4.1a/b, provide details of your methane-specific emissions reduction target in this question by selecting “Methane reduction target” in column 5a.
(C4.2c) Provide details of your net-zero target(s).
Question dependencies
This question only appears if you select “Net-zero target(s)” in response to C4.2.
Change from last year
Minor change
Rationale
Reaching net-zero emissions at the global level is a central goal of the climate action movement. Corporate net-zero targets are a powerful opportunity for companies to go beyond science-based emissions reductions by also contributing to CO2 removal from the atmosphere and accelerating climate action outside their value chains. This question provides investors and other data users with transparency on your organization’s commitment to achieving net-zero emissions.
Connection to other frameworks
S&P Global Corporate Sustainability
Assessment
Climate-Related Targets
Net-Zero Commitment
Net-Zero Targets for Financed Emissions
TCFD Disclosure
NZAM (FS only)
General Commitment
Response options
Please complete the following table:
| 1
|
2
|
3
|
4
|
5
|
6
|
7
|
8
|
9
|
| Target reference number
|
Target coverage
|
Absolute/intensity emission target(s) linked to this net-zero target
|
Target year for achieving net zero
|
Is this a science-based target?
|
Please explain target coverage and identify any exclusions
|
Do you intend to neutralize any unabated emissions with permanent carbon removals at the target year?
|
Planned milestones and/or near-term investments for neutralization at target year
|
Planned actions to mitigate emissions beyond your value chain (optional)
|
Select from:
NZ1-NZ100
|
Select from:
- Company-wide
- Business division
- Business activity
- Site/facility
- Country/area/region
- Banking (Bank) [FS only]
- Investing (Asset manager) [FS only]
- Investing (Asset owner) [FS only]
- Insurance underwriting (Insurance company) [FS only]
- Product-level
- Other, please specify
|
Select all that apply:
- Abs1-Abs100
- Int1-Int100
- Por1-Por100 [FS only]
- Not applicable
|
Numerical field [enter a number between 2018- 2100]
|
Select from drop-down options below
|
Text field [maximum 2,400 characters]
|
Select from:
|
Text field [maximum 2,500 characters]
|
Text field [maximum 2,500 characters]
|
[Add Row]
Is this a science-based target? drop-down options:
- Yes, and this target has been approved by the Science Based Targets initiative
- Yes, we consider this a science-based target, and the target is currently being reviewed by the Science Based Targets initiative
- Yes, we consider this a science-based target, and we have committed to seek validation of this target by the Science Based Targets initiative in the next two years
- Yes, we consider this a science-based target, but we have not committed to seek validation of this target by the Science Based Targets initiative within the next two years
- No, but we are reporting another target that is science-based
- No, but we anticipate setting one in the next two years
- No, and we do not anticipate setting one in the next two years
Requested content
Target reference number (column 1)
- Select a unique target reference from the drop-down menu provided to track progress against this target in subsequent reporting years.
Target coverage (column 2)
- If the target applies to the whole company, select “Company-wide”. Note that “company” refers collectively to all the companies, businesses, organizations, other entities or groups that fall within your definition of the reporting boundary.
- [Financial Services only] Some of the target coverage options shown are driven by the organizational activities you selected in C-FS0.7
- If the target does not apply to the whole company, select the option that best describes the coverage of the target, and provide further details in the “Please explain target coverage and identify any exclusions” column; for example, if your target applies only to your European operations, select “Country/area/region” in this column and specify the country/area/region in the column “Please explain target coverage and identify any exclusions”
Absolute/intensity emission target(s) linked to this net-zero target (column 3)
- If the target is linked to an emission reduction target(s) reported in C4.1a or C4.1b, select the relevant target reference number(s) here.
- [Financial Services only] If the target is linked to a portfolio target(s) reported in C-FS4.1d, select the relevant target reference number(s) here.
- You should generally be reporting at least one near term and one long-term absolute/intensity emission target linked to your net-zero target. Ambitious near-term emissions reductions are the most important component of any net-zero target, but setting and reporting long-term emission reductions targets is also important as these targets will specify the amount of abatement (emission reductions) that your company intends to reach (with the remainder to be neutralized) to reach a state of net-zero. If you have not reported any emission reduction targets in C4.1a or C4.1b that are linked to this net-zero target, please select “Not applicable” and explain why you are not reporting any linked emission targets in the column “Please explain target coverage and identify any exclusions”.
Target year for achieving net zero (column 4)
- If you have a target based on financial years, enter the year that applies to the end of your financial year and specify in the “Please explain target coverage and identify any exclusions” column.
Is this a science-based target? (column 5)
- Please refer to the SBTi’s Net-Zero Standard for what qualifies as a science-based net-zero target and how to assess your target against the SBTi’s Net-Zero Standard Criteria.
- Yes, and this target has been approved by the Science Based Targets initiative – Companies are very strongly encouraged to have their net-zero targets officially evaluated by the Science Based Targets initiative (SBTi). CDP considers net-zero targets approved by the initiative to reflect best practice in science-based net-zero target setting. Select this option only if the net-zero target has been approved by the SBTi.
- Yes, we consider this a science-based target, and the target is currently being reviewed by the Science Based Targets initiative – If your company has set a net-zero target and has self-assessed it to be science-based, and it has been submitted it to the SBTi for validation and is currently being reviewed by the SBTi, you should select this option. You should use the “Please explain target coverage and identify any exclusions” column to explain why you consider your net-zero target to be science-based.
- Yes, we consider this a science-based target, and we have committed to seek validation of this target by the Science Based Targets initiative in the next two years – If your company has set a net-zero target, has self-assessed it to be science-based and intends to submit it to the SBTi for validation in the next two years, you should select this option. You should use the “Please explain target coverage and identify any exclusions” column to explain why you consider your net-zero target to be science-based. If you are currently in the process of revising your net-zero target to meet the SBTi’s Net-Zero Standard Criteria, indicate this by selecting “No, but we anticipate setting one in the next 2 years.
- Yes, we consider this a science-based target, but we have not committed to seek validation of this target by the Science Based Targets initiative within the next two years – Not all companies intend to have their target assessed by the SBTi. If your company has set a target and has self-assessed it to be science-based but has not committed to submit it to the SBTi for validation, you should select this option. You should use the “Please explain target coverage and identify any exclusions” column to explain why you consider your target to be science-based.
- No, but we are reporting another target that is science-based – Another net-zero target disclosed in a different row in this table is science-based.
- No, but we anticipate setting one in the next 2 years – While not necessary, it is recommended that the company publicly state this by submitting a Science Based Target initiative commitment letter.
- No, and we do not anticipate setting one in the next 2 years – No science-based net-zero targets have been set and there are no plans in place to set one in the next 2 years.
Please explain target coverage and identify any exclusions (column 6)
- If the target does not apply to the whole organization (i.e. the target coverage is not “Company-wide”), provide further details of your target coverage in this column; for example, if you have selected “Country/area/region” in column 2, please specify which countries/areas/regions your target covers.
- If you have self-assessed your net-zero target to be science-based but it has not been approved by the SBTi, please explain why you consider your target to be science-based.
- If you have not reported any emission reduction targets that are linked to this net-zero target, please explain why not.
Do you intend to neutralize any unabated emissions with permanent carbon removals at the target year? (column 7)
- Although most companies will reduce emissions by at least 90% through their emissions reduction targets, some residual emissions may remain at the target year.
- Indicate whether your organization intends to neutralize these unabated emissions through the permanent removal and storage of carbon from the atmosphere when the net-zero target year is reached. See “Explanation of terms” for more information.
Planned milestones and/or near-term investments for neutralization at target year (column 8)
- This column is only presented if “Yes” is selected in column 7.
- Indicate the magnitude of emissions that you plan to neutralize in the net-zero target year, and describe any planned milestones and/or near-term investments that demonstrate the integrity of your commitment to neutralize unabated emissions in the target year.
- For example, you may be investing or planning to invest into carbon dioxide removal and storage technologies (e.g. Direct Air Capture) in the near-term.
Planned actions to mitigate emissions beyond your value chain (optional) (column 9)
- In addition to any neutralization actions described in column 8 (if applicable), describe any actions your organization has taken in the reporting year, or plans to take between the reporting year and net-zero target year, to accelerate the net-zero transition beyond your organization’s value chain. See “Explanation of terms” for more information.
- For example, your organization may be purchasing high quality REDD+ carbon credits that will support countries to achieve their Nationally Determined Contributions (NDCs) in the long-term.
- If you do not plan to mitigate emissions beyond your value chain as part of your net-zero target, you may leave this column blank.
Explanation of terms
- Net-zero target: the SBTi Net-Zero Standard defines corporate net-zero as:
- reducing Scope 1, 2 and 3 emissions to zero or to a residual level that is consistent with reaching net-zero emissions at the global or sector level in eligible 1.5°C scenarios or sector pathways and;
- neutralizing any residual emissions at the net-zero target date and any GHG emissions released into the atmosphere thereafter.
- Neutralization: Measures that companies take to remove carbon from the atmosphere and permanently store it to counterbalance the impact of emissions that remain unabated. Neutralization can occur using removals within or beyond the value chain. (Adapted from the SBTi Beyond Value Chain Mitigation FAQ).
- Beyond value chain mitigation: Mitigation action or investments that fall outside of a company’s value chain. This includes activities that avoid or reduce greenhouse gas emissions, and those that remove and store greenhouse gases from the atmosphere. Examples include purchasing high quality, jurisdictional REDD+ carbon credits that support countries in raising the ambition on and, in the long-term, achieving their nationally determined contributions, or investing in carbon dioxide removal (CDR) technologies such as direct air capture (DAC) with geological carbon storage. (Adapted from the SBTi Beyond Value Chain Mitigation FAQ)
Additional information
The Science Based Targets initiative has developed a standard for corporate net-zero targets, to ensure that companies’ net-zero targets translate into action that is consistent with achieving a net-zero world by no later than 2050.
Emissions reduction initiatives
(C4.3) Did you have emissions reduction initiatives that were active within the reporting year? Note that this can include those in the planning and/or implementation phases.
Change from last year
No change
Rationale
The answer to this question enables CDP data users to understand your organization’s commitment to reducing emissions beyond business-as-usual scenario (beyond standard maintenance/replacement activities).
Connection to other frameworks
SDG
Goal 7: Affordable and clean energy
Goal 13: Climate action
Response options
Select one of the following options:
Requested content
General
- It is acknowledged that maintenance activities can have a beneficial impact on carbon emissions. Only activities that have either been part of a defined program of emissions reduction activities or where additional investment beyond standard maintenance/replacement has been made for the purposes of reducing emissions should be reported here.
- It is acknowledged that diverse companies often have large number of emissions reduction initiatives operating over varying time periods and scales. You should answer this question in the context of the reporting year. This could include initiatives that have become operational within the reporting year (e.g. installation of new equipment, or instigation of new operational practices) or commitments that have been made in the reporting year (e.g. investments made which are yet to become fully operational).
- If you are reporting a market-based Scope 2 figure, you can reflect any renewable energy purchasing policies as a component of emissions reduction activities. Please bear in mind, however, that if you are already buying renewable energy instruments and accounting for them at a zero emissions factor, then emissions reduction activities can only be achieved as “additional purchases” to what you are already doing. Therefore, emissions reduction activities are established by comparing what you have done in the previous year and what you are proposing to do in the future.
- Measures taken to reduce Scope 3 emissions may be reported here.
- Initiatives do not need to relate to specific targets reported in C4.1a/b.
(C4.3a) Identify the total number of initiatives at each stage of development, and for those in the implementation stages, the estimated CO2e savings.
Question dependencies
This question only appears if you select “Yes” in response to C4.3.
Change from last year
No change
Rationale
This question demonstrates to CDP data users your organization’s progress towards reducing emissions through implementing emissions reduction initiatives.
Connection to other frameworks
SDG
Goal 7: Affordable and clean energy
Goal 13: Climate action
Response options
Please complete the following table:
| Stage of development
|
Number of initiatives
|
Total estimated annual CO2e savings in metric tons CO2e (only for rows marked *)
|
|
Under investigation
|
Numerical field [enter a number from 0-999,999,999,999 using a maximum of 2 decimal places and no commas]
|
Numerical field [enter a number from 0-999,999,999,999 using a maximum of 2 decimal places and no commas]
|
|
To be implemented*
|
|
|
|
Implementation commenced*
|
|
|
|
Implemented*
|
|
|
|
Not to be implemented
|
|
|
Requested content
Stage of development (column 1)
- Report the initiatives in the following stages of development:
- Under investigation: A potential initiative to reduce emissions that is being evaluated but not yet approved by your company during the reporting year.
- To be implemented: An initiative to reduce emissions that has been approved for implementation by your company but its implementation has not yet commenced during the reporting year.
- Implementation commenced: An initiative to reduce emissions was started/activated in the reporting year, but by the end of the reporting period it was not yet fully active/functional in realizing emissions reductions.
- Implemented: An initiative that has fully come into effect in the reporting year e.g. it has become fully operational/functional in realizing CO2e savings.
- Not to be implemented: A potential initiative to reduce emissions that was evaluated but not pursued by your company during the reporting year.
- Companies should report on these stages of development in the context of the reporting year. Unless the project was new to one of the stages of development in the reporting year, it should not be reported.
Number of initiatives (column 2)
- Where there are no projects in a stage of development, state 0 (zero). This column should be completed for all rows.
Total estimated annual CO2e savings in metric tons CO2e (column 3)
- Enter the aggregated estimated annual emissions savings in metric tons CO2e in column 3 for all initiatives in those stages marked with an * (to be implemented, implementation commenced, and implemented).
- It is acknowledged that the CO2e savings will be an estimate. More detail is requested on individual initiatives (or programs of activity) that have been implemented in the reporting year in C4.3b. Initiatives do not need to relate to specific targets disclosed in the questionnaire.
(C4.3b) Provide details on the initiatives implemented in the reporting year in the table below.
Question dependencies
This question only appears if you select “Yes” in response to C4.3.
Change from last year
Modified guidance
Rationale
CDP data users are interested in understanding how you are making progress towards your emissions reduction targets, as well as other emissions-reducing actions undertaken in the reporting year.
Connection to other frameworks
SDG
Goal 7: Affordable and clean energy
Goal 13: Climate action
RE100
Response options
Please complete the following table. The table is displayed over several rows for readability. You are able to add rows by using the “Add Row” button at the bottom of the table.
| Initiative category
|
Initiative type
|
Estimated annual CO2e savings (metric tons CO2e)
|
Scope(s) or Scope 3 category(ies) where emissions savings occur
|
Voluntary/ Mandatory
|
Annual monetary savings (unit currency – as specified in C0.4)
|
Investment required (unit currency – as specified in C0.4)
|
Payback period
|
Estimated lifetime of the initiative
|
Comment
|
|
Select from:
- Energy efficiency in buildings
- Energy efficiency in production processes
- Waste reduction and material circularity
- Fugitive emissions reductions
- Low-carbon energy consumption
- Low-carbon energy generation
- Non-energy industrial process emissions reductions
- Company policy or behavioral change
- Transportation
- Other, please specify
|
Select from drop-down options below
|
Numerical field [enter a number from 0-999,999,999,999 using a maximum of 2 decimal places and no commas]
|
Select all that apply:
- Scope 1
- Scope 2 (location-based)
- Scope 2 (market-based)
- Scope 3 category 1: Purchased goods & services
- Scope 3 category 2: Capital goods
- Scope 3 category 3: Fuel-and-energy-related activities (not included in Scopes 1 or 2)
- Scope 3 category 4: Upstream transportation & distribution
- Scope 3 category 5: Waste generated in operations
- Scope 3 category 6: Business travel
- Scope 3 category 7: Employee commuting
- Scope 3 category 8: Upstream leased assets
- Scope 3 category 9: Downstream transportation and distribution
- Scope 3 category 10: Processing of sold products
- Scope 3 category 11: Use of sold products
- Scope 3 category 12: End-of-life treatment of sold products
- Scope 3 category 13: Downstream leased assets
- Scope 3 category 14: Franchises
- Scope 3 category 15: Investments [does not appear to FS]
- Scope 3: Other (upstream)
- Scope 3: Other (downstream)
|
Select from:
|
Numerical field [enter a number from 0-999,999,999,999,999 using no decimal places, and no commas]
|
Numerical field [enter a number from 0-999,999,999,999,999 using no decimal places, and no commas]
|
Select from:
- <1 year
- 1-3 years
- 4-10 years
- 11-15 years
- 16-20 years
- 21-25 years
- >25 years
- No payback
|
Select from:
- <1 year
- 1-2 years
- 3-5 years
- 6-10 years
- 11-15 years
- 16-20 years
- 21-30 years
- >30 years
- Ongoing
|
Text field [maximum 1,500 characters]
|
[Add Row]
Initiative type drop-down options:
Select one of the following options
Energy efficiency in buildings
- Insulation
- Maintenance program
- Draught proofing
- Solar shading
- Building Energy Management Systems (BEMS)
- Heating, Ventilation and Air Conditioning (HVAC)
- Lighting
- Motors and drives
- Combined heat and power (cogeneration)
- Other, please specify
Energy efficiency in production processes
- Waste heat recovery
- Cooling technology
- Process optimization
- Fuel switch
- Compressed air
- Combined heat and power (cogeneration)
- Wastewater treatment
- Reuse of water
- Reuse of steam
- Machine/equipment replacement
- Automation
- Electrification
- Smart control system
- Motors and drives
- Product or service design
- Other, please specify
Waste reduction and material circularity
- Waste reduction
- Product or service design
- Product/component/material reuse
- Product/component/material recycling
- Remanufacturing
- Other, please specify
Fugitive emissions reductions
- Agricultural methane capture
- Agricultural nitrous oxide reduction
- Landfill methane capture
- Oil/natural gas methane leak capture/prevention
- Refrigerant leakage reduction
- Carbon capture and storage/utilization (CCS/U)
- Other, please specify
|
Low-carbon energy consumption
- Solid biofuels
- Liquid biofuels
- Biogas
- Geothermal
- Large hydropower (>25 MW)
- Small hydropower (<25 MW)
- Hydropower (capacity unknown)
- Renewable hydrogen fuel cell
- Solar heating and cooling
- Solar PV
- Solar CSP
- Nuclear
- Wind
- Tidal
- Wave
- Fossil fuel plant fitted with CCS
- Low-carbon electricity mix
- Other, please specify
Low-carbon energy generation
- Solid biofuels
- Liquid biofuels
- Biogas
- Geothermal
- Large hydropower (>25 MW)
- Small hydropower (<25 MW)
- Hydropower (capacity unknown)
- Renewable hydrogen fuel cell
- Nuclear
- Solar heating and cooling
- Solar PV
- Solar CSP
- Wind
- Tidal
- Wave
- Fossil fuel plant fitted with CCS
- Other, please specify
Non-energy industrial process emissions reductions
- Process equipment replacement
- Process material substitution
- Process material efficiency
- Carbon capture and storage/utilization (CCS/U)
- Other, please specify
Company policy or behavioral change
- Supplier engagement
- Customer engagement
- Site consolidation/closure
- Change in purchasing practices
- Resource efficiency
- Waste management
- Other, please specify
Transportation
- Business travel policy
- Teleworking
- Employee commuting
- Company fleet vehicle replacement
- Company fleet vehicle efficiency
- Other, please specify
|
Requested content
General
- Companies are asked to provide information on any emissions reduction initiatives made.
- There is no need to record every action – initiatives can be recorded on a programmatic level. Companies with large numbers of initiatives should prioritize those that have the potential to provide a meaningful contribution to emissions reductions.
- It is acknowledged that maintenance activities can have a beneficial impact on carbon emissions. Only those activities that have either been part of a defined program of emissions reduction initiatives or where additional investment beyond standard maintenance/replacement has been made for the purposes of reducing emissions should be reported here.
- Where initiatives are part of routine maintenance or necessary equipment replacement (e.g. necessary replacement of equipment that has an additional benefit in emissions reduction), enter the additional (premium) costs and additional monetary savings associated with the lower emissions model (if applicable).
- It should be noted that not all emissions reduction initiatives carry with them a significant cost – many initiatives, such as resource efficiency, have fairly negligible investment costs yet offer potentially high monetary savings. These initiatives should be included in the table, with the minimal investment required reflected in the “Investment required” column, and by selecting the payback of less than a year option (if this is the case).
Initiative category (column 1)
- Select the option from the drop-down list that best describes the initiative. Note that these are broad categories only, with more detailed options provided in the “Initiative type” column.
- Energy efficiency in buildings – Select this option for all energy efficiency initiatives relating to buildings, including those relating to the building fabric (e.g. insulation, draught-proofing, etc.) and those relating to building services (e.g. HVAC, BEMS etc.)
- Energy efficiency in production processes – Select this option for all energy efficiency initiatives relating to processes (e.g. waste heat recovery, process optimization, compressed air, combined heat and power, automation, smart control systems, product/service design to improve energy efficiency etc.)
- Waste reduction and material circularity – Select this option for circular economy and waste reduction initiatives (e.g. reuse, recycling, remanufacturing, product/service design to reduce waste etc.).
- Fugitive emissions reductions – Select this option for initiatives to reduce fugitive emissions (e.g. methane capture, agricultural nitrous oxide reductions, refrigerant leakage reduction etc.)
- Low-carbon energy consumption – Select this option for emissions reduction initiatives relating to increasing low-carbon energy consumption i.e. energy from renewable sources, nuclear plants and fossil-fuel plants fitted with carbon capture and storage. Note that if increasing low carbon energy consumption has been a component of your emissions reduction initiatives please also report the other accompanying information in C6.2, C6.3, C7.5, and Module C8. If you select “Solid biofuels”, “Liquid biofuels”, or "Biogas" you should specify whether any of the biofuels are derived from sustainable biomass and/or if they are being used for bioenergy with carbon capture and storage (BECCS) in the “Comment” column (column 10). Refer to CDP’s Technical note on Biofuels for more information. Members of the RE100 initiative selecting this option should ensure to enter a figure in column 6 “Annual monetary savings”.
- Low-carbon energy generation – Select this option for initiatives relating to the installation of low-carbon energy generating facilities (renewable, nuclear or fossil-fuel plants fitted with carbon capture and storage) at your own site or at others on behalf of your clients. If you select “Solid biofuels”, “Liquid biofuels”, or "Biogas" you should specify whether any of the biofuels are derived from sustainable biomass and/or if they are being used for bioenergy with carbon capture and storage (BECCS) in the “Comment” column (column 10). Refer to CDP’s Technical note on Biofuels for more information. Members of the RE100 initiative selecting this option should ensure to enter a figure in column 6 “Annual monetary savings”.
- Non-energy industrial process emissions reductions – Select this option only for initiatives to reduce emissions from industrial production processes which chemically or physically transform materials (e.g. CO2 from the calcinations step in cement manufacturing, CO2 from catalytic cracking in petrochemical processing, PFC emissions from aluminum smelting etc.)
- Company policy or behavioral change – Select this option for initiatives relating to a change in company policy (e.g. value chain engagement, a new procurement policy) or an organizational behavioral change (e.g. resource efficiency improvements such as reducing paper use, waste management improvements such as reducing food waste etc.). Note that changes in company transportation policies should not be reported here but under the initiative category “Transportation”
- Transportation – Select this option for initiatives relating to employee travel and commuting and the company fleet.
- Other, please specify – If none of the listed categories are applicable to your initiative, select this option and specify the initiative.
- Note that a selection must be made for both column 1 and column 2. Your data will not be saved if either column is left blank.
Initiative type (column 2)
- Select the type of initiative you have undertaken from the drop-down options provided. Note that only initiative types relative to the initiative category selected in the previous column will be displayed in the ORS.
- If none of the provided options are applicable to your initiative, select “Other, please specify” and provide details of the initiative type.
- Note that a selection must be made for both column 1 and column 2. Your data will not be saved if either column is left blank.
Estimated annual CO2e savings (metric tons CO2e) (column 3)
- Enter the expected annual CO2e savings in all emission Scopes, in metric tons, occurring with the initiative in place. It is acknowledged that this figure is likely to be an estimate.
- Where savings occur on a non-annual basis, average the savings so that an annual figure can be provided.
- Where the initiative has not been in place for the entire reporting period, estimate and report the emissions that would be saved in a 12-month period, so that an annual figure can be provided.
Scope(s) (column 4)
- Select the Scope(s) and/or Scope 3 categories where the emission reductions are expected to occur.
- If the initiative covers multiple Scopes, select all Scopes and Scope 3 categories where emissions reductions are expected to occur.
Voluntary/Mandatory (column 5)
- Select whether the initiative is mandatory (i.e. to comply with regulation), or a voluntary initiative.
Annual monetary savings (unit currency – as specified in C0.4) (column 6)
- Enter the amount of monetary savings per year expected from the initiative (e.g. in reduced energy costs) once it is fully operational.
- The number entered should be appropriate to the currency selected in C0.4.
- Where savings occur on a non-annual basis, please average out so that an annual figure can be provided.
Investment required (unit currency – as specified in C0.4) (column 7)
- Enter the total investment required for the initiative over its lifetime.
- The number entered should be appropriate to the currency selected in question C0.4.
Payback period (column 8)
- The payback period reflects the time it takes for the investment made to be offset by the monetary savings from the initiative (Payback Period = Investment/Annual monetary savings).
- The payback period is not applicable (therefore select "No payback") if:
- the initiative does not require any investment and you have entered 0 (zero) in column 7 (Investment required (unit currency, as specified in C0.4)) AND/OR
- the initiative does not bring any monetary savings and you have entered 0 (zero) in column 6 (Annual monetary savings (unit currency – as specified in C0.4))
Estimated lifetime of the initiative (column 9)
- This column refers to the duration of cash flow savings from carbon mitigation investments. This data point, in years, allows data users to calculate the Internal Rate of Return of the project, also using the “Annual monetary savings,” “Investment required” and “Payback period” information.
- If you have multiple emissions reduction initiatives for each initiative type, select the median to answer this column.
Comment (column 10) (optional)
- If you select “Solid biofuels”, “Liquid biofuels”, or "Biogas" as the “Initiative type” (column 2), specify whether any of the biofuels are derived from sustainable biomass here.
Note for electric utility sector companies:
- For electric utilities, emissions reduction initiatives may include fuel switching at existing plants or investment in lower-emitting methods of generation. Please disclose this information if applicable.
Note for agricultural sector companies:
- Agricultural sector companies are specifically asked to report on initiatives implemented to reduce emissions from agricultural/forestry, processing/manufacturing activities. E.g.:
- Adoption of low impact agriculture/forestry practices
- Increased efficiency of energy use during manufacturing
- Reduced fleet use of fossil fuels or increased use of renewable fuels in transportation
Explanation of terms
- Building energy management system (BEMS): An integrated system comprising hardware, software, and services that leverage information and communication technology for monitoring, automating, and controlling energy consumption. Examples include smart meters and smart billing, data analytics, performance optimization and others.
- Low-carbon energy: In line with the IEA definition, low-carbon technologies are technologies that produce low – or zero – greenhouse-gas emissions while operating. In the power sector this includes fossil-fuel plants fitted with carbon capture and storage, nuclear plants and renewable-based generation technologies. Natural gas, combined cycle gas turbine and fossil fuel-based combined heat and power (cogeneration), despite being less carbon intensive than other means of electricity production like coal, are not considered low-carbon.
- Renewable energy: CDP follows the definition of renewable energy given in the GHG Protocol, i.e. “energy taken from sources that are inexhaustible, e.g. wind, water, solar, geothermal energy and biofuels.”
- Process emissions: emissions from industrial production processes which chemically or physically transform materials (e.g. CO2 from the calcinations step in cement manufacturing, CO2 from catalytic cracking in petrochemical processing, PFC emissions from aluminum smelting, etc.)
(C4.3c) What methods do you use to drive investment in emissions reduction activities?
Question dependencies
This question only appears if you select “Yes” in response to C4.3.
Change from last year
No change
Rationale
This question provides data users with more transparency into your organization’s approach to realizing emissions reductions and progress towards targets.
Connection to other frameworks
SDG
Goal 7: Affordable and clean energy
Goal 13: Climate action
NZAM (FS Only)
Commitment 3
Response options
Please complete the following table. You are able to add rows by using the “Add Row” button at the bottom of the table.
| Method
|
Comment
|
|
Select from:
- Compliance with regulatory requirements/standards
- Dedicated budget for energy efficiency
- Dedicated budget for low-carbon product R&D
- Dedicated budget for other emissions reduction activities
- Employee engagement
- Financial optimization calculations
- Internal price on carbon
- Internal incentives/recognition programs
- Internal finance mechanisms
- Lower return on investment (ROI) specification
- Marginal abatement cost curve
- Partnering with governments on technology development
- Other
|
Text field [maximum 2,400 characters]
|
[Add Row]
Requested content
General
- This question is intended to gather information on the ways in which capital is directed towards emissions reduction activities within your company, and/or the way in which initiatives are identified. If your company uses an internal carbon price you are encouraged to report this here in addition to in C11.
Method (column 1)
- Select the types of methods that you employ to help to channel funds towards emissions reduction initiatives.
Comment (column 2) (optional)
- Provide additional details or examples as necessary.
Additional information
Marginal Abatement Cost Curves
- Marginal Abatement Cost Curves, or MACCs, provide a method of evaluating potential emissions reduction activities. They provide a visual comparison of the marginal abatement costs for different projects.
- MACCs can be generated to evaluate options at any level of organization – from individual business divisions, to the overall business and to sectors and countries/areas, evaluating individual projects, programs or policies.
- Marginal abatement costs are calculated by dividing the costs of the project (calculated from the initial cost minus any savings made as a result of the project) by the greenhouse gas emissions saved over a specified investment timeframe.
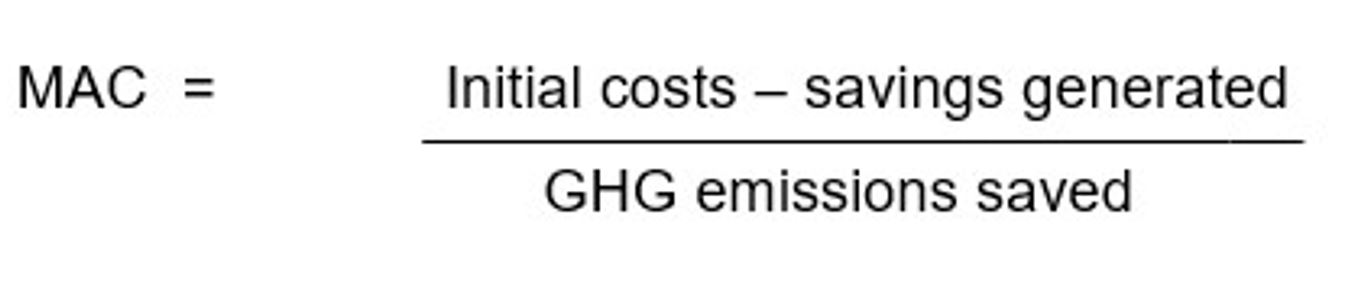
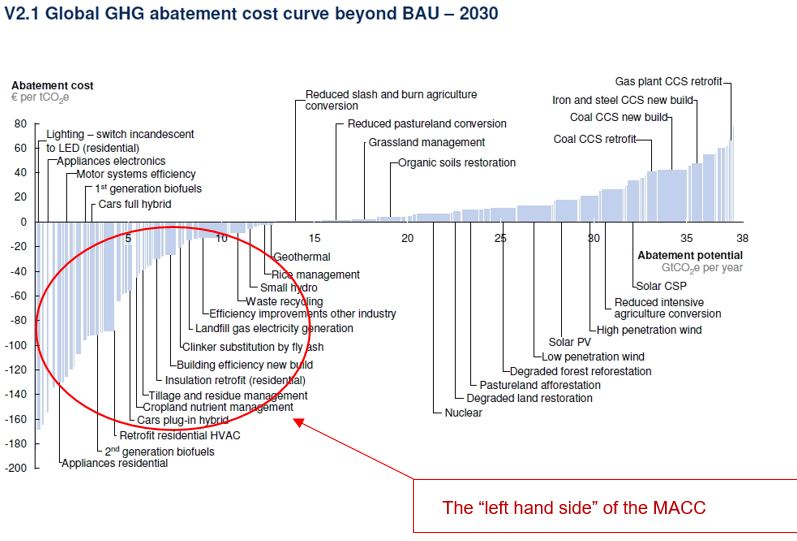
- Those projects/initiatives on the “left hand side” of the
MACC are those where there are cost savings to be made over the lifetime of the
project as a result of the emissions savings made, and therefore, even without
a commitment to carbon reduction investment, should be implemented from a cost
saving point of view. Where the bars extend above the line, positive costs are
associated with the proposals. Here the MACC curve can be used to suggest the
lowest cost options for achieving a particular target. Using the example above,
savings of 9.5MtCO
2 can be made at costs of less than €40/tonCO2.
- As with all evaluation methods,
the accuracy of the MACC will depend on that of the input data.
(C4.3d) Why did you not have any emissions reduction initiatives active during the reporting year?
Question dependencies
This question only appears if you select “No” in response to C4.3.
Change from last year
No change
Rationale
Emissions reduction initiatives are crucial to meeting emissions targets and reducing negative environmental impacts. CDP data users need to know why you do not engage in the best practice of actively reducing your emissions.
Response options
This is an open text question with a limit of 5,000 characters.
Please note that when copying from another document into the ORS, formatting is not retained.
Requested content
General
- Provide a company-specific explanation as to why you do not have any emissions reduction initiatives active in the reporting year, and if you have any plans to implement them in the future. If you plan to implement emissions reduction initiatives in the future, estimate a timeframe of when you will begin to implement them.
- If you do not have emissions reduction initiatives active in the reporting year because you have not identified any, provide more information regarding your process for identifying potential initiatives. E.g. if you investigated an area of organizational activities but the investigation did not result in potential initiatives, provide information on your investigations and explain why emissions reduction initiatives did not come to fruition.
Land management practices
(C-AC4.4/C-FB4.4/C-PF4.4) Do you implement agriculture or forest management practices on your own land with a climate change mitigation and/or adaptation benefit?
Question dependencies
This question only appears if you select “Own land only” or “Both own land and elsewhere in value chain only” in response to the “Agriculture/Forestry" row in C-AC0.6/C-FB0.6/C-PF0.6.
Change from last year
No change
Rationale
This question gathers information on any management practices implemented in your farm or production unit with climate change benefits. This information is important for data users because it demonstrates that your organization is acting on either preventing, reducing, controlling, and/or adapting to the effects of climate change.
Response options
Select one of the following options:
Requested content
General
- Select ‘Yes’ if you have implemented/are in the process of implementing actions on your land with direct or indirect climate change benefits. These land management actions may have been adopted for either preventing, reducing, controlling, and/or adapting to effects of climate change.
- There is a wide variety of agricultural/forestry management practices that have either direct or indirect climate change mitigation and/or adaptation benefits. A list of common examples of these practices can be found in Appendix A of this document.
Explanation of terms
- Adaptation: adjustment to climate change current or expected effects so the consequences to the business and environment are alleviated and beneficial opportunities are realized.
- Mitigation: or "climate change mitigation" refers to efforts to reduce or prevent emission of greenhouse gases.
(C-AC4.4a/C-FB4.4a/C-PF4.4a) Specify the agricultural or forest management practice(s) implemented on your own land with
climate change mitigation and/or adaptation benefits and provide a corresponding emissions figure, if known.
Question dependencies
This question only appears if you select "Yes" in response to C-AC4.4/C-FB4.4/C-PF4.4.
Change from last year
No change
Rationale
This question elicits specific and detailed information about the land management practices adopted by your organization. This information provides data users with an indication of how committed you are to mitigating and adapting to the effects of climate change. Demonstrating an understanding of climate-related benefits related to agricultural/forestry practices is best practice in this sector.
Response options
Please complete the following table. You are able to add rows by using the “Add Row” button at the bottom of the table.
| Management practice reference number
|
Management practice
|
Description of management practice
|
Primary climate change-related benefit
|
Estimated CO2e savings (metric tons CO2e)
|
Please explain
|
|
Select from:
- MP1
- MP2
- MP3
- MP4
- MP5
- MP6
- MP7
- MP8
- MP9
- MP10
- MP11
- MP12
- MP13
- MP14
- MP15
- MP16
- MP17
- MP18
- MP19
- MP20
|
Select from:
- Afforestation
- Agroforestry
- Biodiversity considerations
- Change in the topography or landscapes
- Composting
- Crop diversity
- Contour farming
- Crop rotation
- Diversifying farmer income
- Efficient equipment use
- Equipment maintenance and calibration
- Enhanced forest regeneration practices
- Fertilizer management
- Fire control
- Governmental or institutional policies and programs
- Green harvesting
- Integrated pest management
- Knowledge sharing
- Land use change
- Low carbon energy use
- Low tillage and residue management
- Livestock management
- Manure management
- Nitrogen-fixing plants as cover crop
- Organic farming
- Practices to increase wood production and forest productivity
- Permanent soil cover (including cover crops)
- Pest, disease and weed management practices
- Reducing energy use
- Reforestation
- Restoration
- Replacing fossil fuels by renewable energy sources
- Restoration of degraded lands and cultivated organic soils
- Rice management
- Seed variety selection
- Selective logging
- Selecting species to maximize carbon capture
- Species introduction
- Timing of farm operations
- Waste management
- Other, please specify
|
Text field [maximum
2,400 characters]
|
Select from:
- Emission reductions (mitigation)
- Increasing resilience to climate change (adaptation)
- Increase carbon sink (mitigation)
- Reduced demand for fossil fuel (adaptation)
- Reduced demand for fertilizers (adaptation)
- Reduced demand for pesticides (adaptation)
- Other, please specify
|
Numerical field [enter a number from 0-99,999,999,999 using a
maximum of 2 decimal places]
|
Text field [maximum
2,400 characters]
|
[Add Row]
Requested content
General
- If your organization undertakes many actions, please prioritize those that have had or/is expected to have the greatest benefit to your business (e.g. in reducing CO2e emissions, saving costs, increasing productivity).
Management practice reference number (column 1)
- Select an identifier for each of your management practices. This reference number shall be used to track progress on your specific project in the following years.
- You may report up to 20 management practices
Management practice (column 2)
- Select the option that best describes the management practice adopted by your organization. See Appendix A for details on each management practice listed
- If none of the options are applicable to your organization, select ‘Other, please specify’ and indicate the management practice that you have undertaken. If you need more than 40 characters, please use column 3 (Description of…)
Description of management practice (column 3)
- Provide a brief company-specific description of your practice, including the methods and tools used to implement it
- Indicate which parts of your business the management practice is applicable (e.g. company-wide, selected facilities or regions).
- Provide an explanation as to why you have chosen this practice and how you expect this to mitigate climate change effects and improve your business resilience
- Specify a timeframe for which you expect to receive benefits from the implementation of this practice
Primary climate change related benefit (column 4)
- Select the primary benefit (or expected benefit) provided by your action
- If none of the options are applicable to your organization, select ‘Other, please specify’ and indicate the primary climate change related benefit you expect to experience
Estimated CO2e savings (metric tons CO2e) (column 5)
- Provide an estimated CO2e savings figure associated with the action you selected in column 2 (Management practice). This should reflect the total CO2e in metric tons that has been saved (or is expected to be saved) due to the specific implemented practice
Please explain (column 6)
Specify and provide a description of the methods and tools used to calculate your figure reported in column 5, and indicate any exclusions
Explanation of terms
- Adaptation: adjustment to climate change current or expected effects so the consequences to the business and environment are alleviated and beneficial opportunities are realized.
- Mitigation: or "climate change mitigation" refers to efforts to reduce or prevent emission of greenhouse gases.
Example response
| Management practice reference number
|
Management practice
|
Description of management practice
|
Primary climate change-related benefit
|
Estimated CO2e savings (metric tons CO2e)
|
Please explain
|
| MP1
|
Permanent soil cover (including cover crops)
|
We
adopted cover crops for all our farms in Argentina, Uruguay and Brazil (85% of
our direct operations). We have implemented
cover-cropping practices because it reduces soil exposure/erosion, increases
soil organic matter content, improves water retention, soil structure and
overall soil health.
Benefits are already expected after the first year, in our case the
coming reporting year.
|
Emissions reductions (mitigation)
|
287
|
We quantified the benefits of reducing our GHG emissions using the Cool
Farm Tool and included in the assessment all our farms where we currently use
cover crops. Results: 1437 kg CO2e
per hectare per year reduction in GHG emissions.
As we manage 200 hectares, we expect a total emissions reduction per year of 287
tCO2e.
|
Low-carbon products
(C4.5) Do you classify any of your existing goods and/or services as low-carbon products?
Change from last year
No change
Rationale
This question provides valuable information to investors who are seeking to increase their investment in companies providing low-carbon goods and services.
Connection to other frameworks
SDG
Goal 13: Climate action
Response options
Select one of the following options:
Requested content
General
- Low-carbon products and/or services are important to aid the transition to a net-zero carbon economy and to ensure that global average temperature increase above pre-industrial level stays below 1.5°C.
- While there are various low-carbon product/service taxonomies and definitions, CDP broadly defines them as products or services which have comparatively lower emissions across their entire life cycle (i.e. from material acquisition through to product end-of-life) when compared to a baseline (business-as-usual) scenario or reference product of a similar function. Note that a product can only be considered low-carbon if its production and use does not prevent and/or contributes to reaching net-zero by 2050 or sooner. In that respect, any fossil fuel (including natural gas) energy generation not fitted with carbon capture and storage should not be considered as low-carbon. See “Additional information” for more guidance on how to define a low-carbon product or service.
- The reduction in life cycle emissions between the baseline scenario or reference product and the low-carbon product or service is commonly referred to as the “avoided emissions”.
- There are various circumstances in which a company might consider that the use of its goods and services by others has the potential to reduce GHG emissions.
- For example, an insulation company might consider that the installation of its insulation in another organization’s premises might reduce the consumption of gas to heat the building, with the consequent reduction of GHG emissions from the property. Similarly, a consultancy providing advice services on energy efficiency/emissions reductions or a manufacturer producing a product with lower energy use requirements compared with equivalent products on the market could also consider themselves to reduce the GHG emissions of others.
- Note that a company generating renewable electricity and selling it to a third party would be an example of this. In this case, the third party would calculate their Scope 2 market-based emissions with a zero emissions factor and, providing that the grid average factor is not zero, this would enable that third party to avoid emissions.
Explanation of terms
- Baseline scenario: A reference case that represents the events or conditions most likely to occur in the absence of the low-carbon product in the consequential approach to estimating avoided emissions.
- Reference product: The product against which the low-carbon product is compared in the attributional approach to estimating avoided emissions.
- Attributional approach: The most commonly used approach at present to estimate avoided emissions - measures the difference in total life-cycle GHG emissions between the low-carbon product(s) or service(s) and a reference product or service that provides an equivalent function.
- Consequential approach: Measures the sum of total, system-wide changes in emissions or removals occurring because of the low-carbon product(s) or service(s) when compared to a baseline (business-as-usual) scenario without the low-carbon product. This approach helps to answer the question “What are the GHG impacts related to the full share of the activities that are expected to change when producing, consuming, and disposing of the product?”.
Additional information
How do you define a low-carbon product?
- Despite the increasing focus from investors on low-carbon products, there remains a level of ambiguity over the definition of what constitutes a ‘low-carbon product’. Instead, there has been a greater focus on the benefits of their creation and use, one of which is aiding in the transition towards a net-zero carbon economy operating within the limits set out by leading climate scientists to ensure that global average temperature increase above pre-industrial level stays below 1.5°C.
- Taxonomies, such as the Climate Bonds Taxonomy, are similarly based on this scientific criterion. At this stage, CDP encourages companies to use this criterion when evaluating whether a product is low carbon or not (i.e., companies should evaluate a product or service as low carbon if it is compatible with the level of decarbonization required to keep global temperature increase to 1.5°C compared to pre-industrial temperatures).
- Therefore, while CDP encourages the development of common definitions across global markets about what constitutes a ‘low-carbon product’, companies should evaluate their low-carbon products in relation to their contribution to a net-zero carbon economy. Different goods and services will have pertinent characteristics in which they can do this. This can include improving the energy efficiency of certain technologies so that they are consistent with avoiding dangerous climate change or contributing to the decarbonization of high-emitting industries.
(C4.5a) Provide details of your products and/or services that you classify as low-carbon products.
Question dependencies
This question only appears if you select “Yes” in response to C4.5.
Change from last year
No change
Rationale
This question provides valuable information to investors who are seeking to increase their investment in companies providing low-carbon goods and services.
Connection to other frameworks
SDG
Goal 12: Responsible consumption and production
Goal 13: Climate action
S&P Global Corporate Sustainability Assessment
Low-Carbon Products
Response options
Please complete the following table. You are able to add rows by using the “Add Row” function at the bottom of the table.
| 1 |
2 |
3 |
4 |
5 |
6 |
7 |
| Level of aggregation
|
Taxonomy used to classify product(s) or service(s) as low-carbon
|
Type of product(s) or service(s)
|
Description of product(s) or service(s)
|
Have you estimated the avoided emissions of this low-carbon product(s) or service(s)
|
Methodology used to calculate avoided emissions
|
Life cycle stage(s) covered for the low-carbon product(s) or services(s)
|
|
Select from:
- Product or service
- Group of products or services
|
Select from:
- Low-Carbon Investment (LCI) Registry Taxonomy
- Climate Bonds Taxonomy
- The EU Taxonomy for environmentally sustainable economic activities
- Green Bond Principles (ICMA)
- The IEA Energy Technology Perspectives Clean Energy Technology Guide
- No taxonomy used to classify product(s) or service(s) as low carbon
- Other, please specify
|
Select from dropdown list below
|
Text field [maximum 1,500 characters]
|
Select from:
|
Select from:
- Addressing the Avoided Emissions Challenge- Chemicals sector
- The Avoided Emissions Framework (AEF)
- Evaluating the carbon-reducing impacts of ICT
- Estimating and Reporting the Comparative Emissions Impacts of Products (WRI)
- Guidelines for Assessing the Contribution of Products to Avoided Greenhouse Gas Emissions (ILCA)
- Methodology for Environmental Life-Cycle Assessment of Information and Communication Technology Goods, Networks and Services (ITU-TL.1410)
- Other, please specify
|
Select from:
- Cradle-to-gate
- Cradle-to-grave
- Cradle-to-cradle/closed loop production
- Cradle-to-gate + end-of-life stage
- Gate-to-gate
- Use stage
- End-of-life stage
- Other, please specify
- Not applicable
|
| 8 | 9 | 10 | 11 | 12 | 13 |
| Functional unit used | Reference product/service or baseline scenario used | Life cycle stage(s) covered for the reference product/service or baseline scenario | Estimated avoided emissions (metric tons CO2e per functional unit) compared to reference product/service or baseline scenario | Explain your calculation of avoided emissions, including any assumptions | Revenue generated from low-carbon product(s) or service(s) as % of total revenue in the reporting year |
|---|
Text field [maximum 500 characters]
| Text field [maximum 500 characters]
| Select from:
- Cradle-to-gate
- Cradle-to-grave
- Cradle-to-cradle/closed loop production
- Cradle-to-gate + end-of-life stage
- Gate-to-gate
- Use stage
- End-of-life stage
- Other, please specify
- Not applicable
| Numerical field [enter a number from 0-99,999,999,999 using a maximum of 10 decimal places and no commas]
| Text field [maximum 2,500 characters]
| Numerical field [enter a number from 0-100 using a maximum of 3 decimal places and no commas]
|
[Add Row]
Type of product(s) or service(s) drop-down options:
Select one of the following options:
Power
- Dry steam plant
- Flash steam plant
- Flywheel
- Geothermal electricity
- Hydropower
- Large-scale light-water nuclear reactor
- Liquid air energy storage (LAES)
- Lithium-ion batteries
- Multi-junction cell
- Onshore wind
- Organic Rankine cycle
- Parabolic trough
- Pumped storage
- Seabed fixed offshore wind turbine
- Small-scale light-water nuclear reactor
- Solar PV
- Solar tower
- Other, please specify
Heat
- Geothermal heat management
- Large-scale heat pump
- Latent heat storage (LHS)
- Solar thermal district heating
- Other, please specify
Biofuels
- Anaerobic digestor
- Bioethanol
- Biomass gasification
- Fatty acid methyl ester (FAME)
- Hydrogenated vegetable oil
- Other, please specify
Hydrogen
- Electrolysis
- Hydrogen pipelines
- Hydrogen storage tanks
- Salt cavern hydrogen storage
- Other, please specify
Ammonia
- Ammonia tankers
- Other, please specify
Batteries
- Copper recycling
- Cathode recycling
- Other, please specify
Road
- Compressed biogas engines
- Ethanol-fuelled diesel engine
- Hydrogen fuel cell
- Hydrogen Refuelling Station
- Liquified biogas engines
- Lithium-ion batteries
- Polymer electrolyte membrane fuel cell
- Other, please specify
Rail
- Magnetic levitation
- Other, please specify
Shipping
- Ammonia bunkering
- Cold ironing, alternative maritime power
- Foul Release Hull Coating
- Liquified biogas engines
- Rudder bulb
- Other, please specify
Aviation
- Geared Turbo Fan/ Ultra-High Bypass Ratio engine
- Other, please specify
Chemicals and plastics
- Chemical absorption of CO2
- Physical absorption of CO2
- Other, please specify
Iron and steel
- Chemical absorption of CO2
- Other, please specify
Cement and concrete
- Calcined clay
- Other, please specify
Pulp and paper
- Lignin extraction
- Black liquor gasification
- Other, please specify
Aluminum
- Additive manufacturing
- Other, please specify
CO2 storage
- CO2-enhance oil recovery
- Saline formation
- Other, please specify
Buildings construction and renovation
- Building orientation: Lighting
- Building orientation: Thermal performance
- Composite materials
- Dual flow ventilation
- Dynamic simulation
- Foam, caulk, tape or gaskets
- Modular components
- Natural ventilation
- Pre-casting
- Structural Insulated Panel
- Thick crystal products or thin-film products
- Other, please specify
Heating and cooling
- Advanced heat exchanger
- Air-source heat pump using heat recovery
- Aquifer thermal energy storage (ATES)
- Borehole thermal energy storage (BTES)
- Central heat pump water heaters
- Chilled water storage
- Ground-source heat pump
- Hot water tank
- Hydrogen boiler
- Pellets burning stove and boiler
- Solid-liquid ice storage
- State-of-the-art air-to-air technology
- Wood burning stove
- Other, please specify
Cooking
- Bag digester
- Composite material digester
- Improved biomass cooking stove
- Induction cooker
- LPG cooking stove
- Vitroceramic/hot plate cooking stoves
- Other, please specify
Lighting
- Conventional LED
- Organic LED
- Polymer LED
- Other, please specify
Systems integration
- Double smart grid
- Smart meter
- Other, please specify
CO2 transport
- Pipeline
- Other, please specify
Other
- Hybrid flexible demand and battery network
- Induction heating for large-scale industrial processes
- Infrared heating for large-scale industrial processes
- Other, please specify
Requested content
Level of aggregation (column 1)
- Select from the drop-down menu what level of aggregation you wish to report on in this row. For example, you may only produce one product that can be classified as ‘low carbon.’ In this case you may want to report at the product level of aggregation. Alternatively, if your company produces several low carbon products that have a similar function, you may wish to report at the “Group of products or services” level.
- Note that you can add multiple rows to this table and report different levels of aggregation. For each row, please select the level of aggregation that is most appropriate to your stakeholders.
Taxonomy used to classify product(s) or service(s) as low carbon (column 2)
- As investors seek to increase the proportion of their portfolio invested in low carbon products there is an effort to establish standardized taxonomies to classify and define low-carbon products and services.
- Select the taxonomy used to classify the product(s) or service(s) as low-carbon. If you used a taxonomy that is not listed, select “Other, please specify” and state the taxonomy used.
- If you are reporting a product or service that you consider to be low-carbon, but it has not been classified as such by any taxonomy, select “No taxonomy used to classify product(s) or service(s) as low-carbon”.
Type of product(s) or service(s) (column 3)
- Select the category and type of product or service from the list of options provided, which have been developed using the IEA Energy Technology Perspectives (ETP) Clean Energy Technology Guide and the Climate Bonds Taxonomy.
- If the product(s) or service(s) you are disclosing does not fall into any of the types provided, select “Other”. If the product(s) or service(s) is not listed within the relevant type of product/service, select “Other, please specify”.
Description of product(s) or service(s) (column 4)
- Use this column to describe the product(s) or service(s) that you are disclosing in this row.
- If you have selected “No taxonomy used to classify product(s) or service(s) as low-carbon” in column 2, provide a rationale as to why you consider the product(s) or service(s) to be low-carbon.
Have you estimated the avoided emissions of this low-carbon product(s) or services(s)? (column 5)
- The reduction in life cycle emissions between a baseline (business-as-usual) scenario or reference product and the low-carbon product or service is commonly referred to as the “avoided emissions”.
- Indicate whether your organization has attempted to calculate the avoided emissions of the low-carbon product(s) or service(s) described in column 4. You will be requested to provide details of your estimation approach in the subsequent columns.
- To estimate the avoided emissions of a low-carbon product or service, companies could follow either an “attributional” or “consequential” estimation approach:
- An attributional estimation approach – the most commonly used approach at present - measures the difference in total life-cycle GHG emissions between the low-carbon product(s) or service(s) and a reference product or service that provides an equivalent function.
- A consequential estimation approach measures the sum of total, system-wide changes in emissions or removals occurring because of the low-carbon product(s) or service(s) when compared to a baseline (business-as-usual) scenario without the low-carbon product. This approach helps to answer the question “What are the GHG impacts related to the full share of the activities that are expected to change when producing, consuming, and disposing of the product?”.
Methodology used to calculate avoided emissions (column 6)
- This column only appears if you select “Yes” in “Have you estimated the avoided emissions of this low-carbon product(s) or service(s)” (column 5).
- Methodologies to calculate avoided emissions are still in the infancy of their development. CDP will keep refining the list of methodologies to best reflect those that are considered best practice.
Life cycle stage(s) covered for the low-carbon product(s) or service(s) (column 7)
- This column only appears if you select “Yes” in “Have you estimated the avoided emissions of this low-carbon product(s) or service(s)” (column 5).
- Select the life cycle stages of the low-carbon product(s) or service(s) covered in your avoided emissions calculation. Refer to the “Explanation of terms” for definitions of the life cycle stages.
- Where practical, a full life-cycle approach (cradle-to-grave or cradle-to-cradle/closed loop production) should be taken to estimate the avoided emissions of the low-carbon product(s) or service(s).
- If you have not used a life cycle approach, select “Not applicable” and explain why not in column 12 “Explain your calculation of avoided emissions, including any assumptions”.
Functional unit used (column 8)
- This column only appears if you select “Yes” in “Have you estimated the avoided emissions of this low-carbon product(s) or service(s)” (column 5).
- Avoided emissions are usually expressed in terms of a functional unit, which should be applicable to both the low-carbon product(s) or service(s) and the reference product/service or baseline (business-as-usual) scenario.
- The functional unit refers to the performance characteristics and services delivered by the product(s) or service(s) and should be clearly defined and measurable.
- A functional unit will typically define the following three parameters:
- The function of the product(s) or service(s);
- The duration or service life of the product(s) or service(s) (i.e. the amount of time needed to fulfil the function); and
- The quality of the product(s) or service(s).
- For example, a functional unit to compare an electric vehicle with a conventional vehicle could be “operating an electric passenger vehicle for 50,000km vs. a similar-sized internal combustion engine passenger vehicle for 50,000km”.
Reference product/service or baseline scenario used (column 9)
- This column only appears if you select “Yes” in “Have you estimated the avoided emissions of this low-carbon product(s) or service(s)” (column 5).
- Specify and explain the choice of the reference product/service or baseline (business-as-usual) scenario used to calculate the estimated avoided emissions in column 11.
- Note that the reference product should represent the most likely alternative solution that would be used for a certain function in the absence of your disclosed low-carbon product(s) or service(s).
Life cycle stage(s) covered for the reference product/service or baseline scenario (column 10)
- This column only appears if you select “Yes” in “Have you estimated the avoided emissions of this low-carbon product(s) or service(s)” (column 5).
- Select the life cycle stages covered in your avoided emissions calculation for the reference product/service or baseline scenario specified in column 9. Refer to the “Explanation of terms” for definitions of the life cycle stages.
- Note that credible comparisons should cover the same life cycle stages for the low-carbon product/service and the reference product/service.
- If you have not used a life cycle approach, select “Not applicable” and explain why not in column 12 “Explain your calculation of avoided emissions, including any assumptions”.
Estimated avoided emissions (metric tons CO2e per functional unit) compared to reference product/service or baseline scenario (column 11)
- This column only appears if you select “Yes” in “Have you estimated the avoided emissions of this low-carbon product(s) or service(s)” (column 5).
- Quantify the estimated avoided emissions of your low-carbon product(s) or service(s), compared to the reference product/service or baseline scenario specified in column 9.
- For example, if using an attributional approach, this figure can be calculated using the equation: “Life-Cycle Emissions of Reference Product – Life-Cycle Emissions of Low-Carbon Product”. If the resulting figure is positive, the assessed product emits less over its life cycle when compared to the reference product and as such, the positive figure represents the “avoided emissions” of the low-carbon product(s) or service(s).
- Note that the avoided emissions should be estimated in relation to the functional unit specified in column 8.
Explain your calculation of avoided emissions, including any assumptions (column 12)
- This column only appears if you select “Yes” in “Have you estimated the avoided emissions of this low-carbon product(s) or service(s)” (column 5).
- State whether you used an attributional or consequential approach to estimate the avoided emissions and explain the reason for your choice. If you used a consequential approach, clarify the boundary of your analysis and what effects you have included in your assessment (e.g. rebound and secondary enabling effects).
- Include the figures used in your calculation and any critical assumptions that you made (e.g., emissions factors, performance characteristics, allocation methods, data sources and any uncertainties) to help data users to assess the credibility and reliability of the results.
Revenue generated from low-carbon product(s) or service(s) as % of total revenue in the reporting year (column 13)
- State the revenue generated from the low-carbon product(s) or service(s) described in column 4 as a percentage of your organization’s total revenue in the reporting year.
- Enter the figure for ‘revenue’ as would be declared in your financial statement (sometimes referred to a ‘turnover’ or ‘sales’). Under the International Financial Reporting Standard this would be the inflow of income arising in the course of an entity’s ordinary activities, with deductions made (such as for sales returns, allowances and discounts). This figure is commonly used by investors to assess the income-generating ability of a business.
Example response
Worked examples of low-carbon products
Example 1: Company A is a paper production company. It has a range of products that can be classified as low-carbon as these products are made from recycled material so have comparatively lower emissions than paper made from virgin material.
| Level of aggregation
|
Taxonomy used to classify product(s) or service(s) as low-carbon
|
Type of product(s) or service(s)
|
Description of product(s) or service(s)
|
Have you estimated the avoided emissions of this low-carbon product(s) or service(s)
|
Methodology used to calculate avoided emissions
|
Life cycle stage(s) covered for the low-carbon product(s) or services(s)
|
| Product or service
|
Climate Bonds Taxonomy
|
Pulp and paper: Other, please specify
|
We have manufactured/sold printing paper that consists of 50% recycled material. These products can be classified as low-carbon products because manufacturing of them requires less raw materials and therefore very little emissions are embedded in the products.
|
Yes
|
Guidelines for Assessing the Contribution of Products to Avoided Greenhouse Gas Emissions (ILCA)
|
Cradle-to-grave
|
| Functional unit used
|
Reference product/service or baseline scenario used
|
Life cycle stage(s) covered for the reference product/service or baseline scenario
|
Estimated avoided emissions (metric tons CO2e per functional unit) compared to reference product/service or baseline scenario
|
Explain your calculation of avoided emissions, including any assumptions
|
Revenue generated from low-carbon product(s) or service(s) as % of total revenue in the reporting year
|
| 75GSM printing paper supplying 1000 A4 sheets with 50% recycled material
|
75GSM printing paper supplying 1000 A4 sheets with industry average amount of virgin material
|
Cradle-to-grave
|
6000
|
We followed an attributional approach to our LCA and measured the difference in total cradle-to grave emissions between our product and an industry average product.
The calculation was limited in that we were unable to calculate indicators for ocean warming or herbicide use, and freshwater or wetland disturbance due to lack of data.
We used the following Global Warming Potential 20 (GWP20) factors from the IPCC 5th assessment report: Carbon Dioxide (CO2): 1,
Methane (CH4): 102,
Nitrous Oxide (N2O): 264,
Sulfur Hexafluoride (SF6): 17,500,
HFC-134a: 3,710,
Nitrogen Trifluoride (NF3): 12,800,
Black Carbon: 3,385,
Organic Carbon: -128,
Sulfur Dioxide (SO2): -274,
Nitrogen Oxide (NOx) 122
We used a mass-based allocation for energy and resource inputs where multiple products were being produced. To allocate the impacts from the recycled material we followed the most common 100-0 cut-off approach, where the environmental impacts are only included for one lifecycle of the product. In other words, recycled fiber is not allocated to any of the impacts associated with the original fiber sourcing or processing, but only the impacts of the paper recycling process.
We identified a representative set of pulp and paper mills across our region for which mill-level data is available. Our data is then averaged across all the mills producing the same paper grade in the region. We also used environmental data from government to calculate some of the environmental impacts. We then compared these averages to our data to calculate avoided emissions.
The estimation of avoided emissions is based on the differences that arise from our higher content of recycled material: A 30% decrease in wood use, a 10% decrease in total energy, and minor decreases in other impacts (water usage, solid waste produced, and other pollutants).
|
65
|
Example 2: Company B is an automotive manufacturer. Its electric vehicles are considered low-carbon as they have comparatively lower use stage emissions when compared with their internal combustion engine vehicles.
| Level of aggregation
|
Taxonomy used to classify product(s) or service(s) as low-carbon
|
Type of product(s) or service(s)
|
Description of product(s) or service(s)
|
Have you estimated the avoided emissions of this low-carbon product(s) or service(s)
|
Methodology used to calculate avoided emissions
|
Life cycle stage(s) covered for the low-carbon product(s) or services(s)
|
| Group of products or services
|
The IEA Energy Technology Perspectives Clean Energy Technology Guide
|
Road: Lithium-ion batteries
|
Our company has a range of electric passenger vehicles that use lithium ion batteries.
|
Yes
|
Guidelines for Assessing the Contribution of Products to Avoided Greenhouse Gas Emissions (ILCA)
|
Use stage
|
| Functional unit used | Reference product/service or baseline scenario used | Life cycle stage(s) covered for the reference product/service or baseline scenario | Estimated avoided emissions (metric tons CO2e per functional unit) compared to reference product/service or baseline scenario | Explain your calculation of avoided emissions, including any assumptions | Revenue generated from low-carbon product(s) or service(s) as % of total revenue in the reporting year |
|---|
| Operating a passenger car for 10,000 passenger-kilometers. | Our range of passenger vehicles that use internal combustion engines.
| Use stage | 22700 | Our calculation of avoided emissions was based on the difference in emissions during operation. This simplified our calculations as we could set aside the emissions from energy production. This was a key limitation to our assessment, and we are working to improve our methodology to cover the full life cycle of our products.
We calculated the emissions of our electric vehicles during use and the emissions of our internal combustion engine vehicles during use (over 10,000km as per our functional unit). We then calculated the difference as the emissions avoided by our electric vehicles. We thus took an attributional approach to the estimation.
We obtained our emissions factors from the IPCC’s 5th Assessment report, most importantly:
Carbon Dioxide (CO2): 1,
Nitrous Oxide (N2O): 264
Nitrogen Oxide (NOx) 122
The estimation was based on the assumption that both types of vehicles were operated in a similar way with a similar average speed.
| 80 |
Explanation of terms
- Baseline scenario: A reference case that represents the events or conditions most likely to occur in the absence of the low-carbon product in the consequential approach to estimating avoided emissions.
- Reference product: The product against which the low-carbon product is compared in the attributional approach to estimating avoided emissions.
- Gate-to-gate: The emissions and removals attributed to a studied product while it is under the ownership or control of the reporting company.
- Cradle-to-gate: A partial life cycle assessment from material acquisition (cradle) through to when the product leaves the reporting company’s gate (i.e. immediately following the product’s production). Includes the material acquisition & pre-processing stage and the production stage.
- Cradle-to-grave: A full life cycle assessment of emissions and removals attributed to a studied product from material acquisition through to the material or product end-of-life (grave). Includes the material acquisition & pre-processing stage, production stage, use stage and end-of-life stage.
- Cradle-to-cradle/closed loop production: A full life cycle assessment from material acquisition though to end-of-life material or product recycling (i.e. cradle-to-grave + recycling).
- Life cycle stages (in line with the GHG Protocol Product Life Cycle Accounting and Reporting Standard):
- Material acquisition & pre-processing stage: A life cycle stage that begins when resources are extracted from nature and ends when the product components enter the gate of the studied product’s production facility.
- Production stage: A life cycle stage that begins when the product components enter the production site for the studied product and ends when the finished studied product leaves the production gate.
- Use stage: A life cycle stage that begins when the consumer takes possession of the product and ends when the used product is discarded.
- End-of-life stage: A life cycle stage that begins when the used product is discarded by the consumer and ends when the product is returned to nature (e.g. incinerated) or allocated to another product’s life cycle.
Additional information
How do you define a low-carbon product?
- Despite the increasing focus from investors on low-carbon products, there remains a level of ambiguity over the definition of what constitutes a ‘low-carbon product’. Instead, there has been a greater focus on the benefits of their creation and use, one of which is aiding in the transition towards a net-zero carbon economy operating within the limits set out by leading climate scientists to ensure that global average temperature increase above pre-industrial level stays below 1.5°C.
- Taxonomies, such as the Climate Bonds Taxonomy, are similarly based on this scientific criterion. At this stage, CDP encourages companies to use this criterion when evaluating whether a product is low carbon or not (i.e., companies should evaluate a product or service as low carbon if it is compatible with the level of decarbonization required to keep global temperature increase to 1.5°C compared to pre-industrial temperatures).
- Therefore, while CDP encourages the development of common definitions across global markets about what constitutes a ‘low-carbon product’, companies should evaluate their low-carbon products in relation to their contribution to a net-zero carbon economy. Different goods and services will have pertinent characteristics in which they can do this. This can include improving the energy efficiency of certain technologies so that they are consistent with avoiding dangerous climate change or contributing to the decarbonization of high-emitting industries.
C5 Emissions methodology
Module Overview
A meaningful and consistent comparison of emissions over time is essential for managing climate-related issues. This module allows companies to describe any structural, boundary or methodological changes in the reporting year, provide the base year and base year emissions figures, and provide details of the standard, protocol, or methodology used to collect activity data and calculate emissions.
Key changes
- Modified question:
- C5.1c – has two new columns on Scope for which you have recalculated your base year and past years’ recalculation.
Click here for a list of all changes made this year.
Pathway diagram - questions
This diagram shows the general questions contained in module C5. To access question-level guidance, use the menu on the left to navigate to the question.
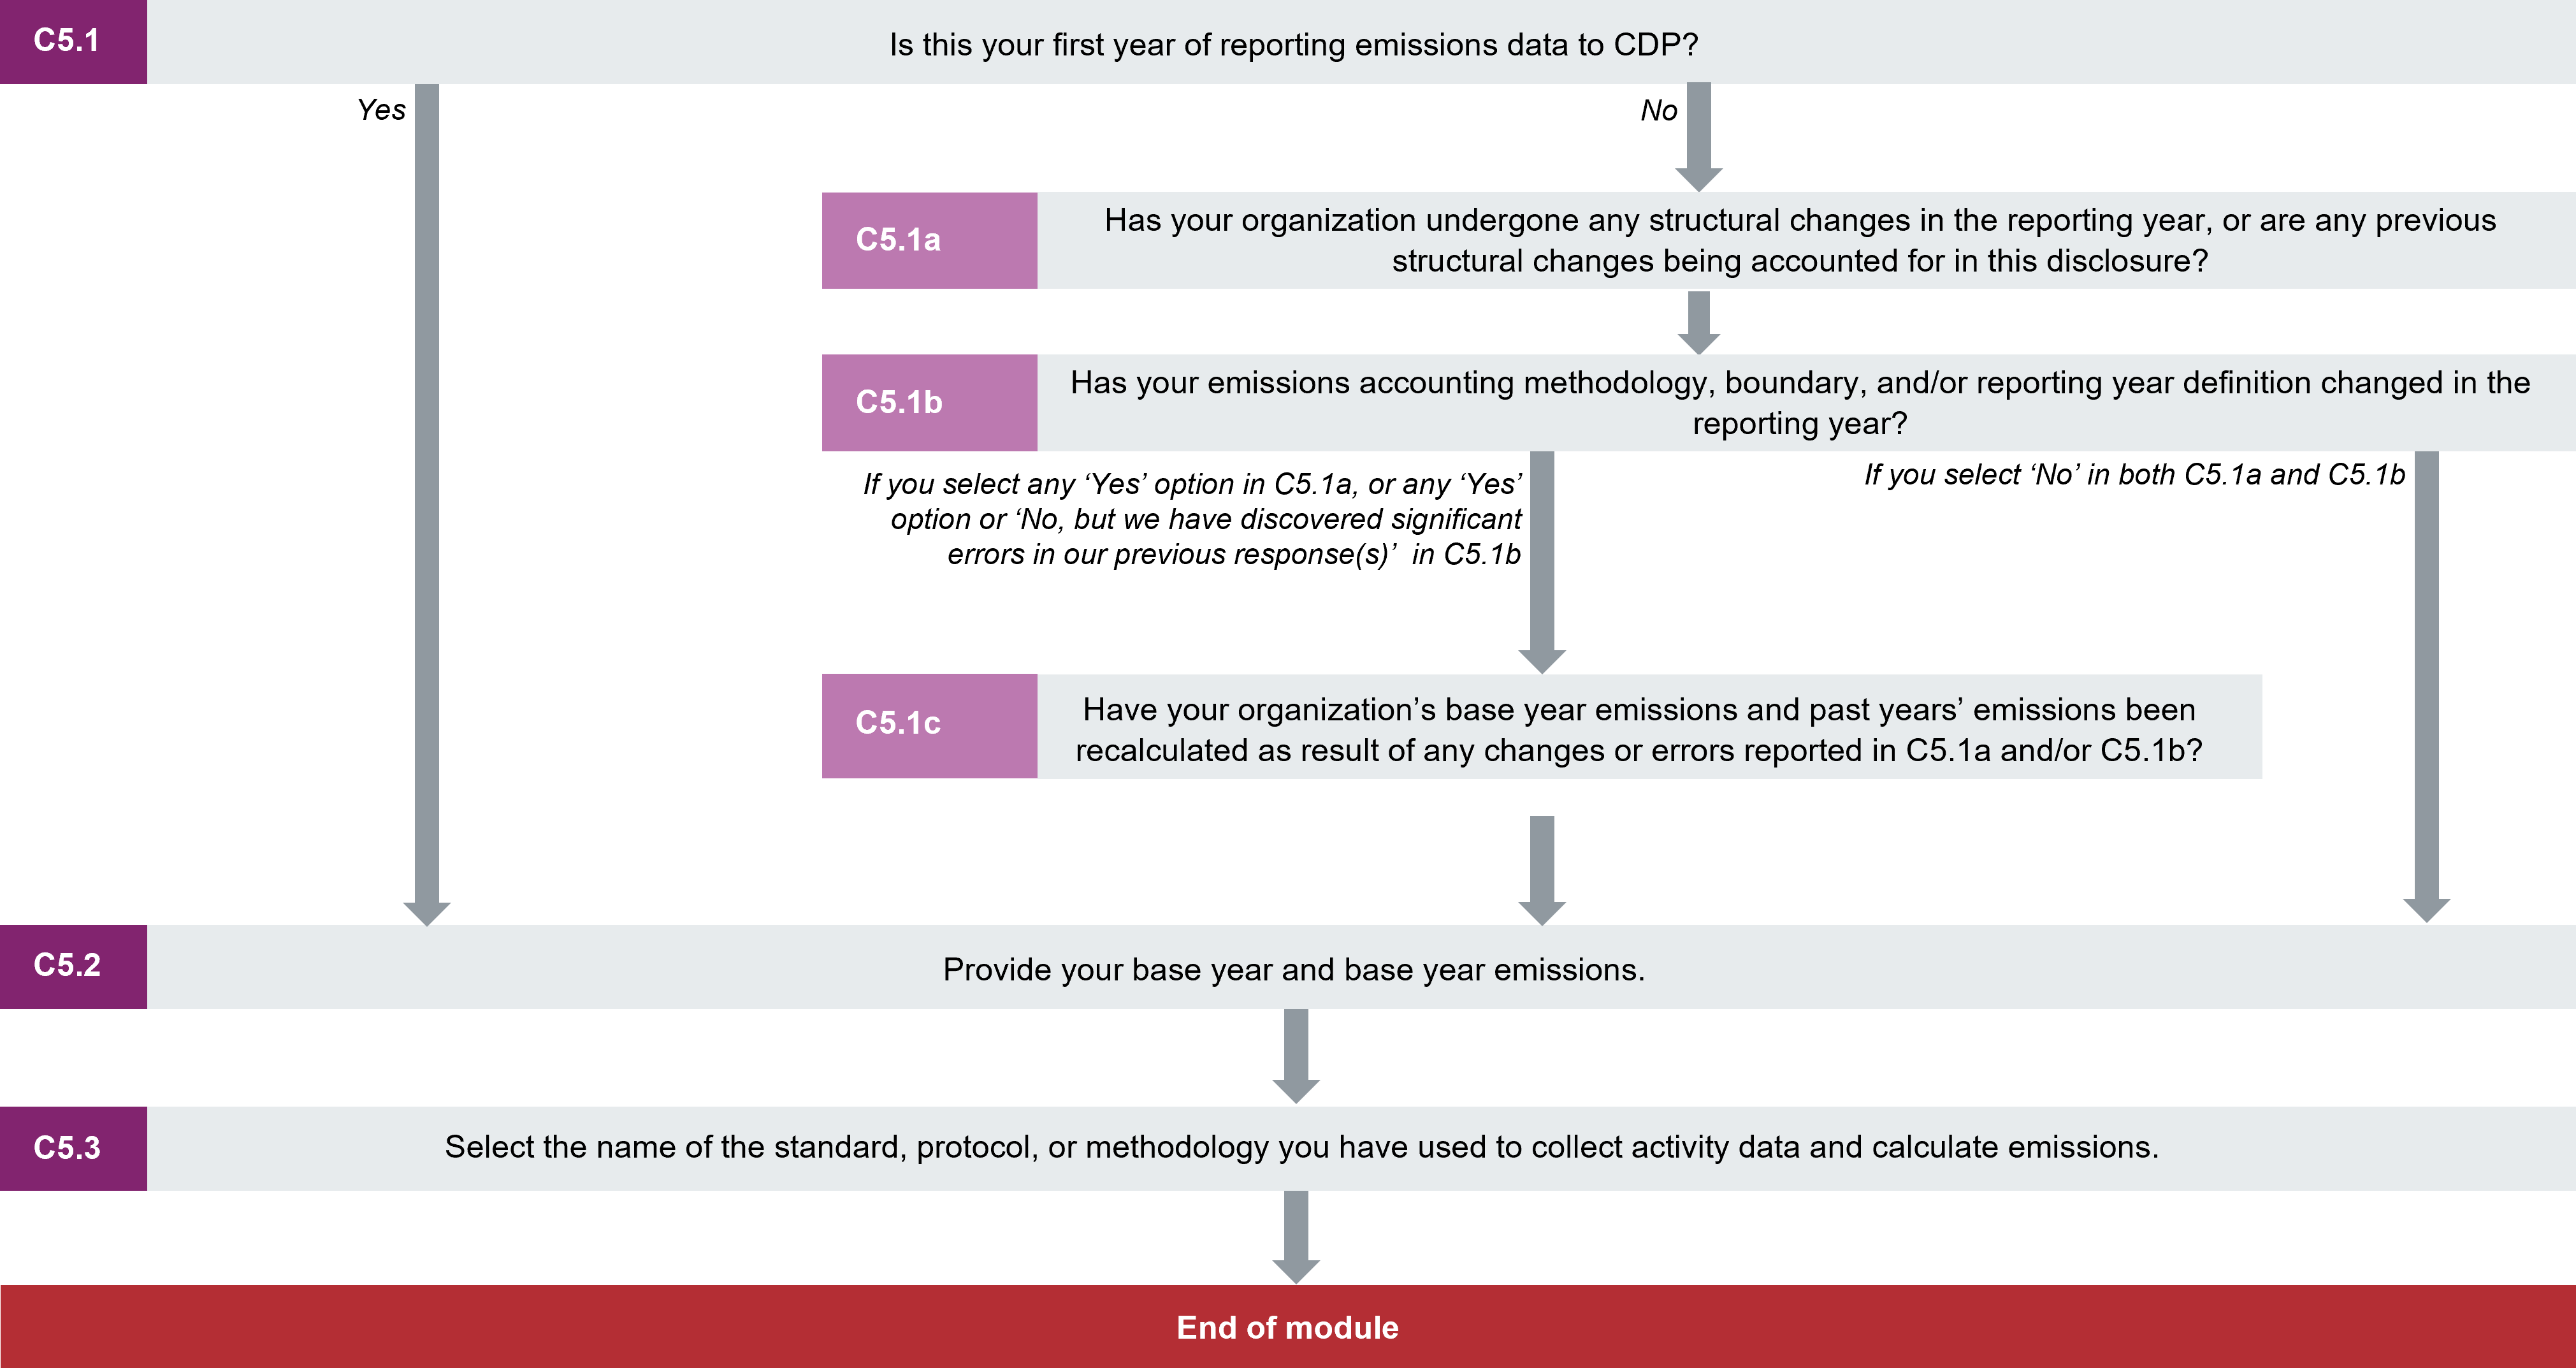
Changes in the reporting year
(C5.1) Is this your first year of reporting emissions data to CDP?
Change from last year
No change
Rationale
Data users wish to understand year-on-year changes in emissions and this question allows organizations to indicate if they have previously reported emissions data to CDP. It drives follow-up questions on the details of changes to corporate structure, emissions accounting boundary or methodology, or reporting year.
Response options
Select one of the following options:
Requested content
General
- If you have provided emissions data to CDP before, select “No”. You will be asked to provide details of any changes (structural, methodological, boundary etc.) since your last disclosure in subsequent questions.
(C5.1a) Has your organization undergone any structural changes in the reporting year, or are any previous structural changes being accounted for in this disclosure of emissions data?
Question dependencies
This question only appears if you select “No” in response to C5.1
Change from last year
No change
Rationale
Structural changes such as acquisitions, divestments, and mergers may have a significant impact on base year emissions due to the transfer of ownership or control of emitting activities from one organization to another. While a single structural change might not have a significant impact, the cumulative effect of a number of minor structural changes can result in a significant impact. This question provides data users with important context to any changes in emissions that may trigger base year emissions recalculation.
Response options
Please complete the following table:
*Column/row appearance is dependent on selections in this or other questions.
| Has there been a structural change?
|
Name of organization(s) acquired, divested from, or merged with*
|
Details of structural change(s), including completion dates*
|
Select all that apply:
- Yes, an acquisition
- Yes, a divestment
- Yes, a merger
- Yes, other structural change, please specify
- No
|
Text field [maximum 500 characters]
|
Text field [maximum 2,500 characters]
|
Requested content
General
- Consider structural changes (including minor ones) which:
- occurred during the reporting year and are being accounted for in this disclosure (e.g., you acquired a company during the reporting year and are including the acquired company’s emissions data in this CDP response).
- occurred prior to the reporting year but are being accounted for in this disclosure (e.g., you acquired a company during the previous reporting year but excluded the acquired company from your CDP response in the previous reporting year in C6.4a due to a lack of data, and now have the data to include the acquired company’s emissions data in this CDP response).
Has there been a structural change? (column 1)
- Select all structural change(s) your organization has recently undergone. If your organization has not undergone any structural change(s) in the reporting year and you are also not accounting for a structural change that occurred in the previous reporting year, select “No”.
Name of organization(s) acquired, divested from, or merged with (column 2)
- This column only appears if any “Yes…” option is selected in column 1
Details of structural change(s), including completion dates (column 3)
- This column only appears if any “Yes…” option is selected in column 1.
- State the completion date of the structural change, and explain how the structural change affects the ownership or control of the emitting activities of the organizations affected by the change.
- Where multiple structural changes have occurred, please identify which completion dates refer to each organization listed in column 2.
Explanation of terms
- Structural changes: Structural changes include mergers, acquisitions, divestments, and outsourcing/insourcing of emitting activities (refer to chapter 5 of the GHG Protocol Corporate Standard for more information).
(C5.1b) Has your emissions accounting methodology, boundary, and/or reporting year definition changed in the reporting year?
Question dependencies
This question only appears if you select “No” in response to C5.1
Change from last year
No change
Rationale
Changes in emissions calculation methodology, reporting boundary approach, and/or reporting year could result in a significant impact on the base year emissions and compromise the consistency and relevance of a company’s GHG emissions inventory. This question provides data users with important context to any changes in emissions that may trigger base year emissions recalculation.
Response options
Please complete the following table:
*Column/row appearance is dependent on selections in this or other questions.
| Change(s) in methodology, boundary, and/or reporting year definition?
|
Details of methodology, boundary, and/or reporting year definition change(s)*
|
Select all that apply:
- Yes, a change in methodology
- Yes, a change in boundary
- Yes, a change in reporting year definition
- No, but we have discovered significant errors in our previous response(s)
- No
|
Text field [maximum 2,500 characters] |
Requested content
Change(s) in methodology, boundary, and/or reporting year definition? (column 1)
- Select all change(s) that occurred in the reporting year. If none of the changes occurred in the reporting year, select “No”.
- Further details on each of the options are provided below:
- Change in methodology: This refers to changes that occurred due to modifications in the way that the emissions inventory is calculated, e.g., changes in emissions factors used or changes in methodology protocol followed.
- Change in boundary: This refers to changes to the boundary used for your emissions inventory calculations, e.g., changing your consolidation approach from financial control to operational control. This option could also apply if you incorporated facilities, activities, or Scope 3 categories into your inventory in the reporting year that were excluded in previous years, or if you have insourced or outsourced an activity (see page 105 of the GHG Protocol Corporate Value Chain standard).
- Change in reporting year definition: This refers to a change in how your organization defines the reporting year, e.g., changing from a reporting year which aligns with the calendar year to one which aligns with your fiscal year.
- Discovery of significant errors: This refers to either the discovery of significant errors, or the discovery of a number of errors that are collectively significant.
Details of methodology, boundary, and/or reporting year definition change(s) (column 2)
- This column only appears if any “Yes…” option is selected in column 1.
- Provide further details of the changes selected in column 1. For example, briefly describe how and why your emissions calculation methodology changed, and/or explain the context to any discovered errors. If new facilities have been included within your inventory, please list these, including their location. If you have included new Scope 3 categories in your inventory, please specify the categories added.
(C5.1c) Have your organization’s base year emissions and past years’ emissions been recalculated as a result of any changes or errors reported in C5.1a and/or C5.1b?
Question dependencies
This question only appears if any of the “Yes” options are selected in C5.1a, or if any of the “Yes” options or “No, but we have discovered significant errors in our previous response” is selected in response to C5.1b
Change from last year
Modified question
Rationale
Significant changes (structural, methodological, boundary etc.) can alter a company’s emissions profile, making meaningful historical comparisons difficult. To maintain consistency over time, base year emissions must be retroactively recalculated to reflect changes in the company that would otherwise compromise the consistency and relevance of a company’s GHG emissions inventory. This question allows data users to understand whether the company has recalculated their base year emissions as a result of the changes or errors disclosed in C5.1a and b.
Ambition: Companies recalculate base year emissions, and emissions from previous years to reflect changes that would otherwise compromise the consistency and relevance of the reported GHG emissions information.
Response options
Please complete the following table:
*Column/row appearance is dependent on selections in this or other questions.
| Base year recalculation
|
Scope(s) recalculated*
|
Base year emissions recalculation policy, including significance threshold
|
Past years’ recalculation
|
Select from:
- Yes
- No, because we have not evaluated whether the changes should trigger a base year recalculation
- No, because the impact does not meet our significance threshold
- No, because the operations acquired or divested did not exist in the base year
- No, because we do not have the data yet and plan to recalculate next year
|
Select all that apply:
- Scope 1
- Scope 2, location-based
- Scope 2, market-based
- Scope 3
|
Text field [maximum 2,500 characters]
|
Select from:
|
Requested content
General
- The GHG Protocol Corporate Standard states that you should recalculate your base year emissions if your organization has changed structurally through acquisitions and/or divestments, the methodology or boundary used to calculate your emissions has changed, you have found significant errors in previous calculations, or if there have been changes to your excluded sources. This is so that your base year emissions can be directly compared with your current/reporting year emissions.
- A company may, however, decide not to do this if the impact on emissions is not material or significant. It is up to each company to determine the threshold for what is considered significant or material by developing a base year recalculation policy. Organizations should apply their base year recalculation policy in a consistent manner (i.e. you should recalculate for both emissions increases and decreases).
- Companies recalculating their base year emissions may also, as per the GHG Protocol, optionally recalculate GHG emissions data for past years between the base year and the reporting year.
Base year recalculation (column 1)
- Select “Yes” if your organization has recalculated your base year emissions as a result of the changes or errors disclosed in C5.1a and/or C5.1b. The basis of the recalculation should be consistent with your recalculation policy (as described in column 2) and should be reflected in the base year emissions figures you disclose in the following question, C5.2.
- Select “No, because we have not evaluated a recalculation of our base year” if you do not have a base year recalculation policy, or you have not evaluated whether the changes or errors identified in C5.1a and/or C5.1b should trigger a base year recalculation as per your policy.
- Select “No, because the impact does not meet our significance threshold” if you have a base year recalculation policy and you have evaluated that the changes or errors identified in C5.1a and/or C5.1b do not meet your policy’s significance threshold and therefore the impact on emissions is deemed to be non-material.
- Select “No, because we do not have the data yet and plan to recalculate next year” if your organization has merged with or acquired a company and you do not yet have the emissions data for the organization you have merged with or acquired. As per the GHG Protocol Corporate standard, “if it is not possible to make a recalculation in the year of the structural change (e.g. due to lack of data for an acquired company), the recalculation may be carried out the following year”. In this scenario, the emissions from the company your organization has merged with or acquired should be reported as an excluded source of emissions in C6.4a in this CDP response.
Scope(s) recalculated (column 2)
- This column only appears if you select “Yes” in column 1 “Base year recalculation”.
- Depending on the change(s) that have triggered a base year calculation (as disclosed in C5.1a and/or C5.1b), it may not be necessary to recalculate your organization’s base year emissions for all scopes. For example, you may have found a significant error in your calculation of a single category of scope 3 emissions.
- Indicate in this column the scope(s) for which you have recalculated your base year emissions.
Base year emissions recalculation policy, including significance threshold (column 3)
- Describe your organization’s base year recalculation policy, and if “Yes” was selected in column 1, clearly articulate the basis and context of the recalculation.
- Ensure to include the significance threshold applied for determining base year recalculations.
Past years’ recalculation (column 4)
- Select “Yes” if, due to changes or errors reported in C5.1a and/or C5.1b, in addition to your base year recalculation you have also recalculated emissions data for past years, and are restating them in C6.1, C6.3, and C6.5.
- If you select “Yes” in this column, ensure you have also selected “Yes” in column 3 of C0.2 and indicated the number of past years of emissions you wish to restate for each Scope in columns 4-6 of C0.2.
Explanation of terms
- Significance threshold: As noted on page 35 of the GHG Protocol Corporate Standard, a significance threshold is a “qualitative and/or quantitative criterion used to define any significant change to the data, inventory boundary, methods, or any other relevant factors. It is the responsibility of the company to determine the significance threshold that triggers base year emissions recalculation and to disclose it.”
Base year emissions
(C5.2) Provide your base year and base year emissions.
Change from last year
No change
Rationale
A meaningful and consistent comparison of emissions over time requires that companies set a performance datum with which to compare current emissions.
Response options
Please complete the following table:
| Scope
|
Base year start
|
Base year end
|
Base year emissions (metric tons CO2e)
|
Comment
|
|
Scope 1
|
Use the calendar button or enter dates manually in the format DD/MM/YYYY
|
Use the calendar button or enter dates manually in the format DD/MM/YYYY
|
Numerical field [enter a number from 0-999,999,999,999 using a maximum of 3 decimal places and no commas]
|
Text field [maximum 2,400 characters]
|
|
Scope 2 (location-based)
|
|
|
|
|
|
Scope 2 (market-based)
|
|
|
|
|
| Scope 3 category 1: Purchased goods and services
|
|
|
|
|
| Scope 3 category 2: Capital goods
|
|
|
|
|
| Scope 3 category 3: Fuel-and-energy-related activities (not included in Scope 1 or 2)
|
|
|
|
|
| Scope 3 category 4: Upstream transportation and distribution
|
|
|
|
|
| Scope 3 category 5: Waste generated in operations
|
|
|
|
|
| Scope 3 category 6: Business travel
|
|
|
|
|
| Scope 3 category 7: Employee commuting
|
|
|
|
|
| Scope 3 category 8: Upstream leased assets
|
|
|
|
|
| Scope 3 category 9: Downstream transportation and distribution
|
|
|
|
|
| Scope 3 category 10: Processing of sold products
|
|
|
|
|
| Scope 3 category 11: Use of sold products
|
|
|
|
|
| Scope 3 category 12: End of life treatment of sold products
|
|
|
|
|
| Scope 3 category 13: Downstream leased assets
|
|
|
|
|
| Scope 3 category 14: Franchises
|
|
|
|
|
| Scope 3 category 15: Investments [row hidden for FS sector]
|
|
|
|
|
| Scope 3: Other (upstream)
|
|
|
|
|
| Scope 3: Other (downstream)
|
|
|
|
|
Requested content
General
- This question requests a base year for your greenhouse gas inventory. This may be the same as the base year for your targets, but not necessarily.
- If your company has measured its emissions in the past, you can use the oldest year for which it has available emissions information – preferably verified or assured – as your base year. If your company is measuring its emissions for the first time, you may choose the current reporting year as the base year.
- Companies should ensure that the base year inventory includes both a location-based and market-based Scope 2 total, if applicable and feasible. This ensures “like with like” comparisons over time. If the Scope 2 base year chosen was calculated only according to the location-based method, you should also recalculate and report a market-based total if contractual information or residual mix totals are available for the base year. If not, you should state in the comment field that the location-based result has been used as a proxy since a market-based figure cannot be calculated.
- As per the GHG Protocol Corporate Value Chain (Scope 3) Accounting and Reporting Standard, companies should use a single base year for Scope 1, Scope 2, and Scope 3 emissions (for all calculated Scope 3 categories). This is to enable comprehensive and consistent tracking of total emissions across all three Scopes over time. However, companies with already established base years for Scope 1 and Scope 2 emissions may use a more recent year for the Scope 3 base year (e.g., the first year for which you have complete and reliable Scope 3 emissions data).
- Establishing a single base year for all Scope 3 categories simplifies Scope 3 emissions tracking and allows clearer communication of GHG emissions to data users.
- If you are using an average of annual emissions over several consecutive years for your base year emissions, enter the last year in the period (e.g. 01/01/2019 – 31/12/2019), then provide the time period over which the average was calculated in the comment column and explain that the emissions figure reported is an average.
- If you have not calculated base year emissions for a particular Scope 3 category, you may leave the respective row blank.
- If you are using the Export/Import functionality, please check that the imported date is correct.
Additional information
- Setting a base year: Setting a base year is an essential GHG accounting step that a company must take to be able to observe trends in its emissions information. According to the GHG Protocol Corporate Standard, a base year is “a historic datum (a specific year or an average over multiple years) against which a company’s emissions are tracked over time.” See Chapter 5 of the GHG Protocol Corporate Standard for more information on setting and recalculating a base year.
- Recalculation criteria for Scope 3 emissions base year: The table below from the Corporate Value Chain (Scope 3) Accounting and Reporting Standard provides additional guidance for determining the need for Scope 3 base year recalculation due to changes in insourcing/outsourcing.
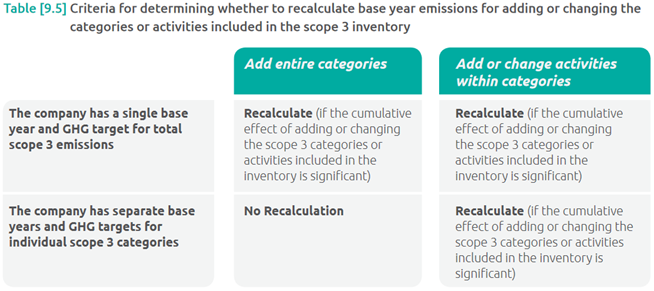
Emissions methodology
(C5.3) Select the name of the standard, protocol, or methodology you have used to collect activity data and calculate emissions.
Change from last year
Minor change
Rationale
CDP data users need to understand what methods have been used to calculate emissions.
Response options
Select all that apply from the following options:
- ABI Energia Linee Guida
- Act on the Rational Use of Energy
- American Petroleum Institute Compendium of Greenhouse Gas Emissions Methodologies for the Oil and Natural Gas Industry, 2009
- Australia - National Greenhouse and Energy Reporting Act
- Bilan Carbone
- Brazil GHG Protocol Programme
- Canadian Association of Petroleum Producers, Calculating Greenhouse Gas Emissions, 2003
- China Corporate Energy Conservation and GHG Management Programme
- Defra Environmental Reporting Guidelines: Including streamlined energy and carbon reporting guidance, 2019
- ENCORD: Construction CO2e Measurement Protocol
- Energy Information Administration 1605(b)
- Environment Canada, Sulphur hexafluoride (SF6) Emission Estimation and Reporting Protocol for Electric Utilities
- Environment Canada, Aluminum Production, Guidance Manual for Estimating Greenhouse Gas Emissions
- Environment Canada, Base Metals Smelting/Refining, Guidance Manual for Estimating Greenhouse Gas Emissions
- Environment Canada, Cement Production, Guidance Manual for Estimating Greenhouse Gas Emissions
- Environment Canada, Primary Iron and Steel Production, Guidance Manual for Estimating Greenhouse Gas Emissions
- Environment Canada, Lime Production, Guidance Manual for Estimating Greenhouse Gas Emissions
- Environment Canada, Primary Magnesium Production and Casting, Guidance Manual for Estimating Greenhouse Gas Emissions
- Environment Canada, Metal Mining, Guidance Manual for Estimating Greenhouse Gas Emissions
- EPRA (European Public Real Estate Association) guidelines, 2011
- EPRA (European Public Real Estate Association) Sustainability Best Practice recommendations Guidelines, 2017
- European Union Emission Trading System (EU ETS): The Monitoring and Reporting Regulation (MMR) – General guidance for installations
- European Union Emissions Trading System (EU ETS): The Monitoring and Reporting Regulation (MMR) – General guidance for aircraft operators
- French methodology for greenhouse gas emissions assessments by companies V4 (ADEME 2016)
- Hong Kong Environmental Protection Department, Guidelines to Account for and Report on Greenhouse Gas Emissions and Removals for Buildings, 2010
- ICLEI Local Government GHG Protocol
- IEA CO2 Emissions from Fuel Combustion
- India GHG Inventory Programme
- International Wine Industry Greenhouse Gas Protocol and Accounting Tool
- IPCC Guidelines for National Greenhouse Gas Inventories, 2006
- IPIECA's Petroleum Industry Guidelines for reporting GHG emissions, 2003
- IPIECA’s Petroleum Industry Guidelines for reporting GHG emissions, 2nd edition, 2011
- ISO 14064-1
- Japan Ministry of the Environment, Law Concerning the Promotion of the Measures to Cope with Global Warming, Superseded by Revision of the Act on Promotion of Global Warming Countermeasures (2005 Amendment)
- Korea GHG and Energy Target Management System Operating Guidelines
- National Development and Reform Commission (NDRC) Guidance for Accounting and Reporting of GHG Emissions for Corporates (Trial)
- New Zealand - Guidance for Voluntary, Corporate Greenhouse Gas Reporting
- Philippine Greenhouse Gas Accounting and Reporting Programme (PhilGARP)
- Programa GEI Mexico
- Recommendations for reporting significant indirect emissions under Article 173-IV (ADEME 2018)
- Regional Greenhouse Gas Initiative (RGGI) Model Rule
- Smart Freight Centre: GLEC Framework for Logistics Emissions Methodologies
- Taiwan - GHG Reduction Act
- Thailand Greenhouse Gas Management Organization: The National Guideline Carbon Footprint for organization
- The Climate Registry: Electric Power Sector (EPS) Protocol
- The Climate Registry: General Reporting Protocol
- The Climate Registry: Local Government Operations (LGO) Protocol
- The Climate Registry: Oil & Gas Protocol
- The Cool Farm Tool
- The GHG Indicator: UNEP Guidelines for Calculating Greenhouse Gas Emissions for Businesses and Non-Commercial Organizations
- The Greenhouse Gas Protocol: A Corporate Accounting and Reporting Standard (Revised Edition)
- The Greenhouse Gas Protocol Agricultural Guidance: Interpreting the Corporate Accounting and Reporting Standard for the Agricultural Sector
- The Greenhouse Gas Protocol: Public Sector Standard
- The Greenhouse Gas Protocol: Scope 2 Guidance
- The Greenhouse Gas Protocol: Corporate Value Chain (Scope 3) Standard
- The Tokyo Cap-and Trade Program
- Toitū carbonreduce programme
- Toitū carbonzero programme
- US EPA Center for Corporate Climate Leadership: Direct Fugitive Emissions from Refrigeration, Air Conditioning, Fire Suppression, and Industrial Gases
- US EPA Center for Corporate Climate Leadership: Indirect Emissions From Events and Conferences
- US EPA Center for Corporate Climate Leadership: Indirect Emissions From Purchased Electricity
- US EPA Center for Corporate Climate Leadership: Direct Emissions from Stationary Combustion Sources
- US EPA Center for Corporate Climate Leadership: Direct Emissions from Mobile Combustion Sources
- US EPA Mandatory Greenhouse Gas Reporting Rule
- US EPA Emissions & Generation Resource Integrated Database (eGRID)
- VfU (Verein fur Umweltmanagement) Indicators Standard
- WBCSD: The Cement CO2 and Energy Protocol
- World Steel Association CO2 emissions data collection guidelines
- Other, please specify
Requested content
General
- There are a variety of standards, methodologies, and protocols available for collecting and reporting GHG data, but the large majority of companies refer to the GHG Protocol.
- The appropriateness of an emissions calculation methodology should be determined on a case-by-case basis, and it is good practice for the methods used to estimate emissions and the underlying data to be externally verified.
- CDP makes no judgments on standards or methodologies applied by companies to produce their inventories. However, we expect that any tool used will follow the best practice and observe important aspects such as the accuracy and completeness principles of standards similar to the GHG Protocol. CDP encourages companies to use the GHG Protocol Corporate Standard when national standards are not specified.
- If the metholology(ies) you have used is not listed, select “Other, please specify;” and indicate the methodology(ies) used.
C6 Emissions data
Module Overview
Reporting emissions is best practice and a prerequisite to understanding and reducing negative environmental impacts.
This module examines emissions data details and is aligned with TCFD Metrics & Targets recommended disclosure b) Disclose Scope 1, Scope 2, and, if appropriate, Scope 3 greenhouse gas (GHG) emissions, and the related risks.
The GHG Protocol is developing new Land Sector and Removals Guidance. This new guidance is currently in the pilot testing and review phase, and will be finalized and published in 2023. Companies responding to the CDP 2023 climate change questionnaire should report in accordance with existing GHG Protocol corporate standards, and not use the draft land sector and removals guidance for CDP reporting in 2023, as it is still under development.
Key changes
- Modified question:
- C6.1 – has two new rows for restatement of scope 1 emissions for up to five previous reporting years.
- C6.3 – has two new rows for restatement of scope 2 emissions for up to five previous reporting years.
- C6.4 – now asks if any sources of scope 3 emissions have been excluded from your disclosure.
- C6.4a – updated to request details of sources of emissions excluded from your disclosure for all three scopes.
- C6.5a – has two new rows for restatement of scope 3 emissions for up to five previous reporting years.
- C6.10 – new column added requesting the reason for the change in gross global combined scope 1 and 2 emissions intensity.
- Modified guidance:
- C6.5 – guidance updated to reflect that excluded scope 3 sources within a category should now be reported in C6.4a, and that companies should indicate the boundary they have used for each scope 3 category.
- C6.7a – clarification that companies should not be using the draft GHG Protocol land sector and removals guidance for their 2023 CDP response.
For the agricultural commodities, food/beverage/tobacco and paper/forestry sectors only:
- Removed question:
- C-AC6.9a/C-FB6.9a/C-PF6.9a (2022) – on greenhouse gas emissions by commodity. Datapoints from this question have been merged into C-AC6.9/C-FB6.9/C-PF6.9
- Modified question:
- C-AC6.9/C-FB6.9/C-PF6.9 – datapoints from removed question C-AC6.9a/C-FB6.9a/C-PF6.9a have been merged into this question.
- Modified guidance:
- C-AC6.8/C-FB6.8/C-PF6.8 – clarification that companies should not be using the draft GHG Protocol land sector and removals guidance for their 2023 CDP response.
- C-AC6.8a/C-FB6.8a/C-PF6.8a – clarification that companies should not be using the draft GHG Protocol land sector and removals guidance for their 2023 CDP response.
For the oil and gas sector only:
- Modified question:
- C-OG6.13 – updated to request details of the methodology used to estimate methane emissions.
Click here for a list of all changes made this year.
Sector-specific content
Additional questions on emission intensity metrics for the following high-impact sectors:
- Oil & gas
- Cement
- Steel
- Transport services
Additional questions on Scope 3 emissions, biogenic carbon and agricultural commodities emissions for the following high-impact sectors:
- Agricultural commodities
- Food, beverage and tobacco
- Paper and forestry
Additional questions on life cycle emissions assessment for the following high-impact sectors
- Capital goods
- Construction
- Real estate
Pathway diagram - questions
This diagram shows the general questions contained in module C6. To access question-level guidance, use the menu on the left to navigate to the question.
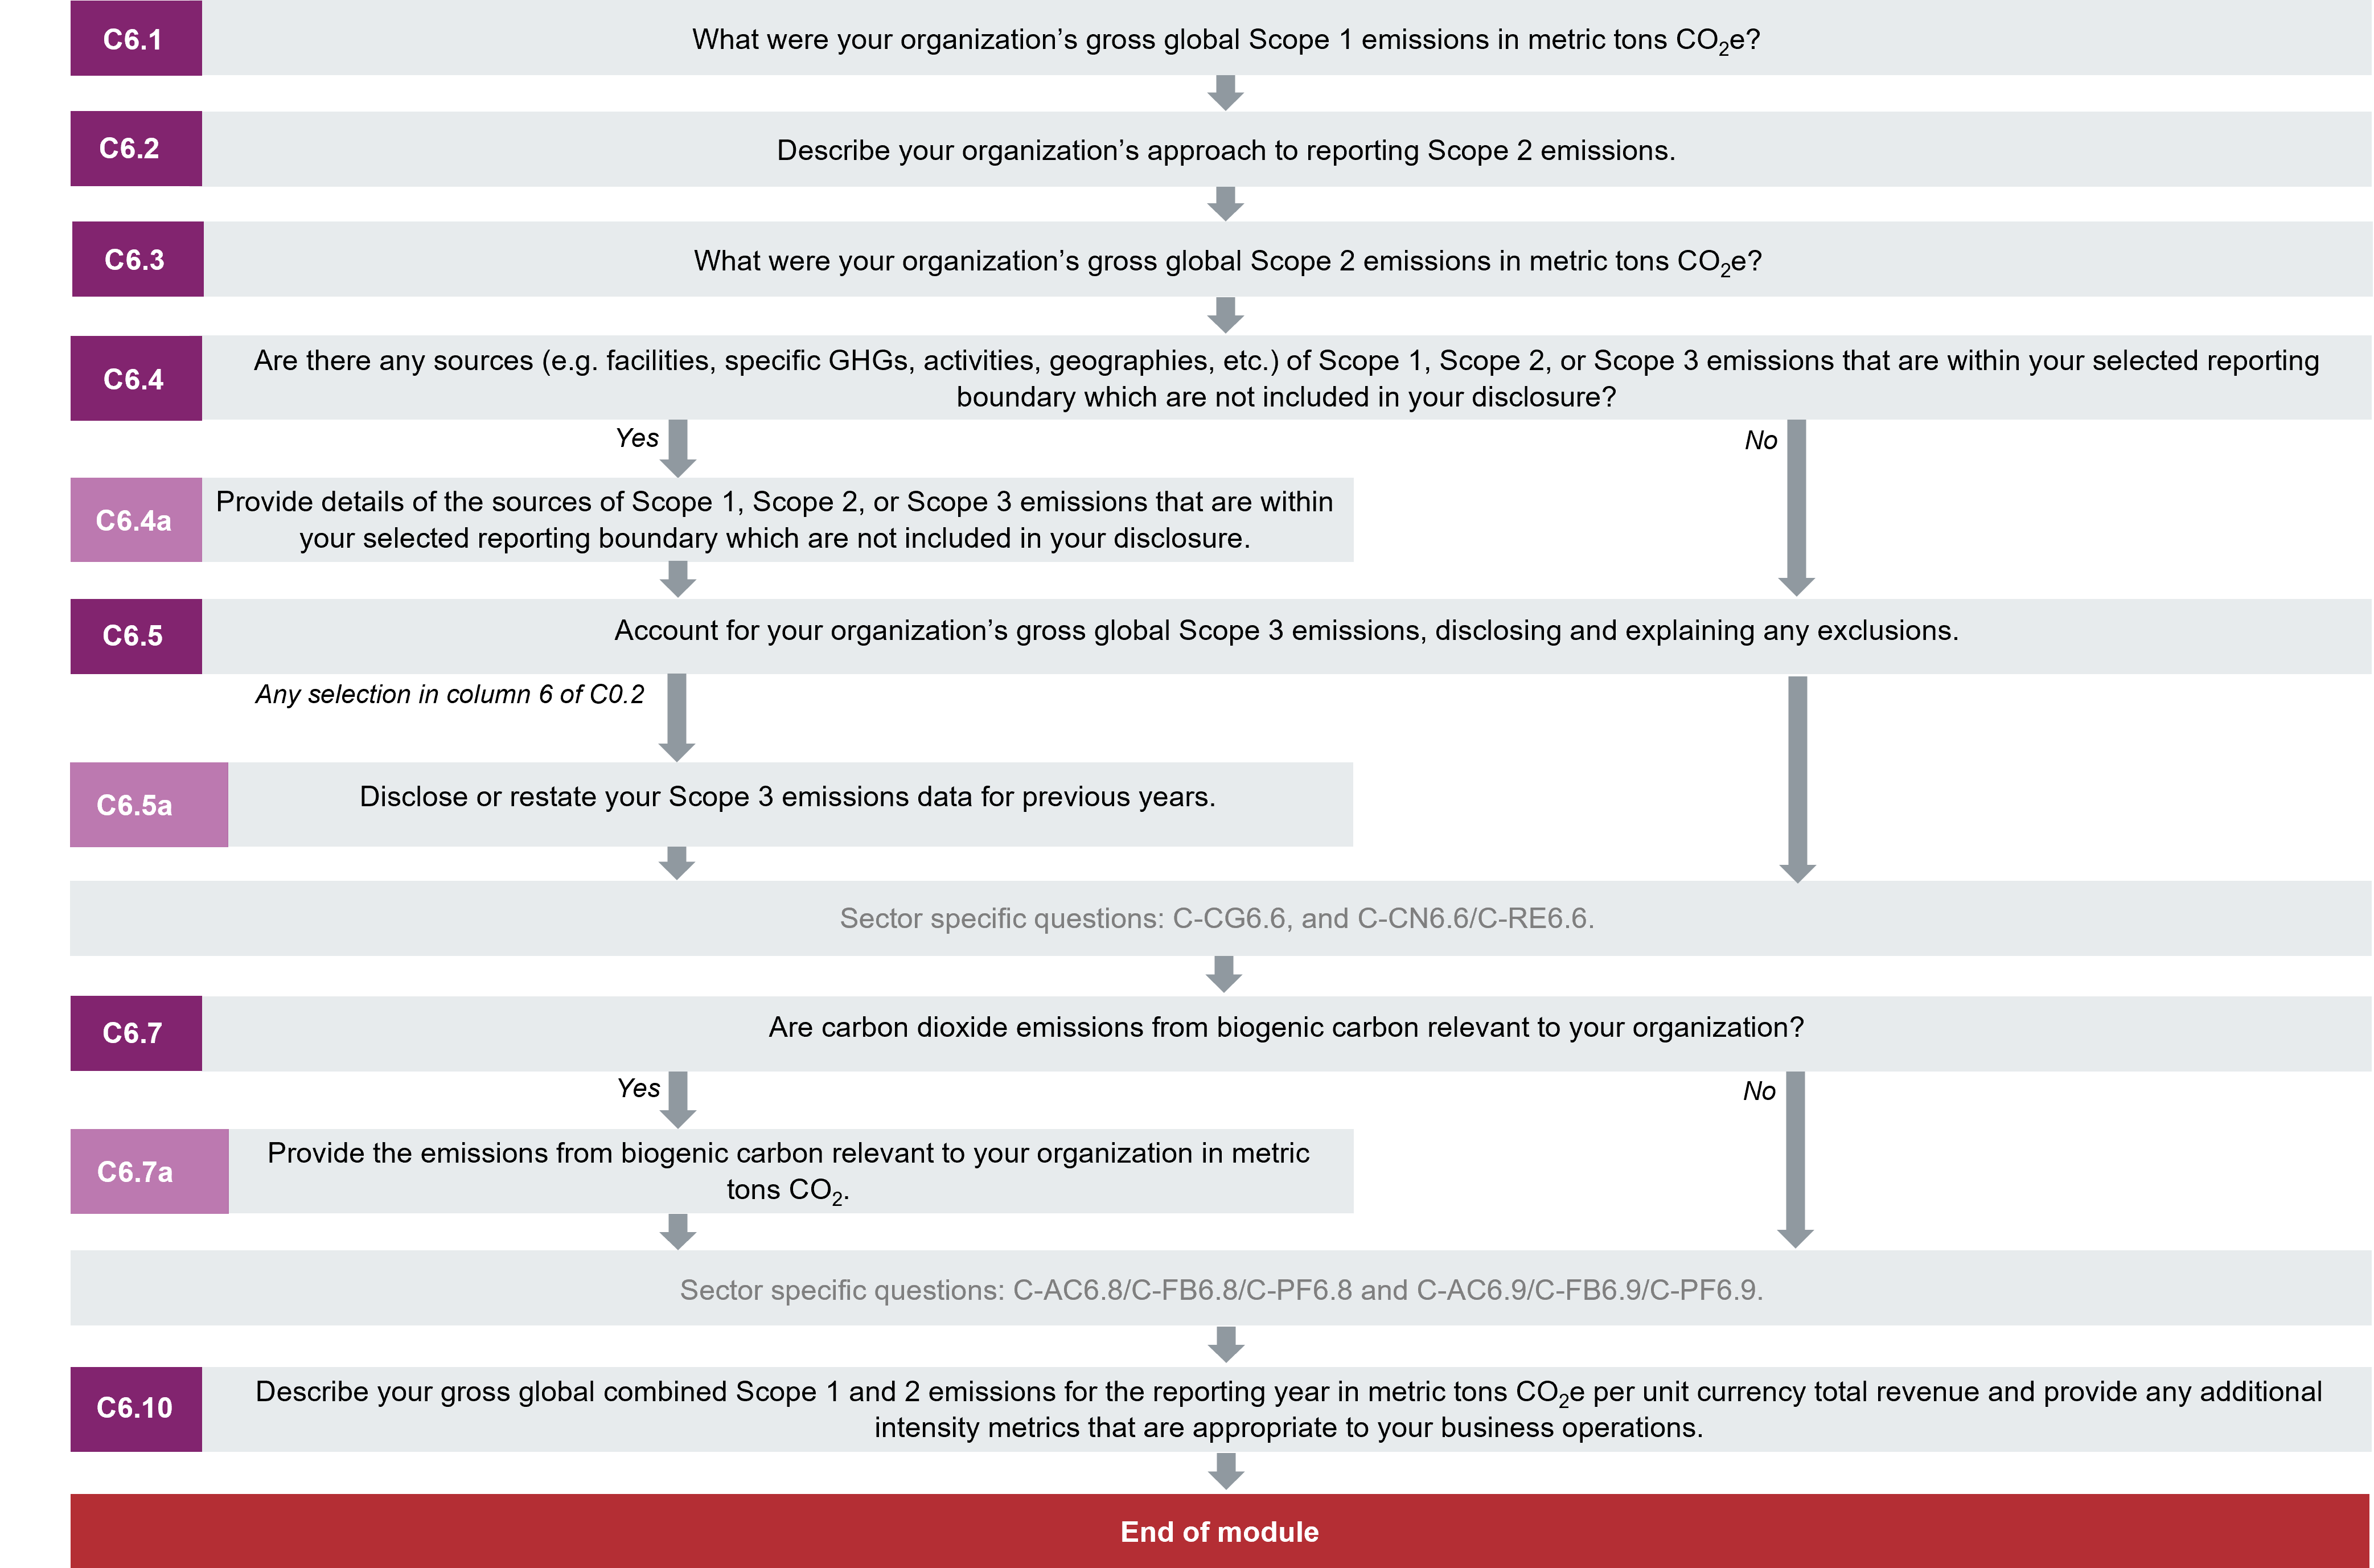
Scope 1 emissions data
(C6.1) What were your organization’s gross global Scope 1 emissions in metric tons CO2e?
Change from last year
Modified question
Rationale
Reporting emissions is best practice and a prerequisite to understanding and reducing negative environmental impacts. CDP asks this question to ensure companies are measuring their carbon footprints from direct emissions.
Ambition: Companies disclose that their Scope 1 emissions in the reporting year have reduced in line with a 1.5 °C-aligned pathway.
Connection to other frameworks
SDG
Goal 13: Climate action
TCFD
Metrics & Targets recommended disclosure b) Disclose Scope 1, Scope 2, and, if appropriate, Scope 3 greenhouse gas (GHG) emissions, and the related risks.
S&P Global Corporate Sustainability Assessment
Direct Greenhouse Gas Emissions (Scope 1)
TCFD Disclosure
Response options
Please complete the following table:
| Year
|
Gross global Scope 1 emissions (metric tons CO2e)
|
Start date
|
End date
|
Comment
|
| Reporting year
|
Numerical field [enter a range of 0-999,999,999,999 using a maximum of 3 decimal places and no commas]
|
[This cell is not seen in ORS]
|
[This cell is not seen in ORS]
|
Text field [maximum 2,400 characters]
|
| Past year 1 [Only appears if "1 year", "2 years", "3 years", "4 years" or "5 years" is selected in column 4 of C0.2]
|
Numerical field [enter a range of 0-999,999,999,999 using a maximum of 3 decimal places and no commas]
|
From: [DD/MM/YYYY]
|
To: [DD/MM/YYYY]
|
Text field [maximum 2,400 characters]
|
| Past year 2 [Only appears if "2 years", "3 years", "4 years" or "5 years" is selected in column 4 of C0.2]
|
Numerical field [enter a range of 0-999,999,999,999 using a maximum of 3 decimal places and no commas]
|
From: [DD/MM/YYYY]
|
To: [DD/MM/YYYY]
|
Text field [maximum 2,400 characters]
|
| Past year 3 [Only appears if "3 years", "4 years" or "5 years" is selected in column 4 of C0.2]
|
Numerical field [enter a range of 0-999,999,999,999 using a maximum of 3 decimal places and no commas]
|
From: [DD/MM/YYYY]
|
To: [DD/MM/YYYY]
|
Text field [maximum 2,400 characters]
|
| Past year 4 [Only appears if “4 years” or “5 years” is selected in column 4 of C0.2]
|
Numerical field [enter a range of 0-999,999,999,999 using a maximum of 3 decimal places and no commas]
|
From: [DD/MM/YYYY]
|
To: [DD/MM/YYYY]
|
Text field [maximum 2,400 characters]
|
| Past year 5 [Only appears if “5 years” is selected in column 4 of C0.2]
|
Numerical field [enter a range of 0-999,999,999,999 using a maximum of 3 decimal places and no commas]
|
From: [DD/MM/YYYY]
|
To: [DD/MM/YYYY]
|
Text field [maximum 2,400 characters]
|
Requested content
General
- Emissions must be reported in gross, not net figures. Therefore, negative numbers are not allowed.
- Putting in zero suggests that you have measured your emissions and that they are equal to zero.
- Gross emissions are requested so that data users can account for GHG emissions from sources owned or controlled by your organization before any reductions for offsets are made, as per the GHG Protocol Corporate Standard. This transparency is meant to provide users with the most accurate portrayal of the emissions created within your company's boundary.
- Scope 1 emissions should be reported in metric tons of CO2e. Common conversion factors are included in the Technical Note "Units of Measure Conversions".
- Special requirements for carbon sequestration, captured & stored and transferred CO2, transfer in – transfer out, and enhanced oil recovery are explained in the Technical Note "Special conditions for reporting Scope 1 emissions".
- Emissions estimates are acceptable, as long as there is transparency with regards to the estimation approach (what is estimated and how) and the data used for the analysis is adequate to support the objectives of the inventory. If applicable to your organization's reporting of Scope 1 emissions, please outline this in the comment column.
Note for first-time responders
- If you are a first-time responder, please provide gross global Scope 1 emissions data for the current reporting year and up to five years prior to the current reporting year.
- The number of past year rows that will appear is dependent on your selection in column 4 of C0.2.
- Please input the gross global Scope 1 emissions data for the current reporting year in the first row and work backwards from the current reporting year.
- Please ensure that the reporting period represents only one full year that has already passed. Reporting periods should not be in the future. This information is important for others to understand the time dimension of your disclosure.
- Use the comment column to report relevant information regarding your organization's past Scope 1 emissions data.
Note for restatements
- If you have chosen to restate your organization's gross global Scope 1 emissions data previously supplied to CDP (as indicated in column 4 of C0.2), you may do so here.
- The number of past year rows that will appear is dependent on your selection in column 4 of C0.2.
- Reporting recalculated figures for these years is optional.
- All years Scope 1 emissions data needs to be entered in reverse order, with the current reporting year first, i.e. you should first input the current reporting year emissions data and work backwards from the most recent reporting year.
- Please ensure that the reporting period represents only one full year that has already passed. Reporting periods should not be in the future. This information is important for others to understand the time dimension of your disclosure.
- Use the comment column to identify that this is restated data and the reason for the restatement.
- For more information on restatements see CDP’s technical note on restatements here.
Note on biogas:
- Carbon dioxide emitted from the combustion of biomass/biofuel or fermentation should not be included in your response to question C6.1 but instead should be reported in C6.7. This applies to self-generated biogas, and biogas delivered by a direct, dedicated pipeline.
- When gas is sourced from a shared pipeline network with multiple sources including both renewable and non-renewable sources, certificates are required to demonstrate the renewable origin of gas (i.e. “certified biogas” or “green gas certificates”) and the following conditions need to be met:
- The company combusts gas sourced from a shared gas pipeline network;
- It also owns or purchases green gas certificates that originated from one of the gas producers on the pipeline network – these need not necessarily be purchased directly from the biogas producers;
- The company permanently retains the environmental attributes of the gas consumption, including any energy attribute certificates.
- The appropriateness of using market-based instruments such as green gas certificates for the emissions inventories is a contested issue. The GHG Protocol is undertaking a process to determine the need and scope for additional guidance building on the existing set of corporate GHG accounting and reporting standards for Scope 1, Scope 2, and Scope 3 emissions. As part of this process, the GHG Protocol plans to holistically examine the appropriateness of market-based accounting methods across sectors, end-uses, and scopes. CDP intends to align with any revisions to the GHG Protocol standards and guidance resulting from this process, including on the use of green gas certificates for emissions accounting.
- While the GHG Protocol process is ongoing, companies are encouraged to make their own judgement of the appropriateness of using green gas certificates in their emissions accounting. Companies should be transparent about any such use of green gas certificates by providing relevant details in the "Comment" column (column 5) in question C6.1, and in C6.7a.
- If the company uses biogas that is sourced from a dedicated pipeline and the source is renewable, then they do not need certificates to prove the renewable origin.
- CDP does not have specific requirements or recommendations for biogas certification. Certified biogas is defined as a contractual instrument that meets the Scope 2 Quality Criteria in GHG Protocol Scope 2 Guidance. For more information on this refer to CDP Technical Note: Accounting of Scope 2 emissions.
Note for agricultural sector companies:
- Direct emissions from agricultural/forestry, processing/manufacturing and/or distribution activities should be reported as part of Scope 1 emissions in this question.
Explanation of terms
- Biogas: A gas derived principally from the anaerobic fermentation of biomass and solid wastes and combusted to produce heat and/or power. Included in this category are landfill gas and sludge gas (sewage gas and gas from animal slurries) and other biogas.
Scope 2 emissions reporting
(C6.2) Describe your organization's approach to reporting Scope 2 emissions.
Change from last year
Modified guidance
Rationale
The purpose of this question is to allow companies to disclose their approach to calculating their Scope 2 emissions. This is particularly relevant when considering market-based Scope 2 emissions, as it is important to differentiate between companies that have not reported a market-based figure as they do not have operations where there are those contractual instruments, and those companies that do have operations where there are contractual instruments but have chosen not to disclose a market-based figure. CDP asks this question to enable accurate comparability across companies.
Connection to other frameworks
SDG
Goal 13: Climate action
Response options
Please complete the following table:
| Scope 2, location-based
|
Scope 2, market-based
|
Comment
|
|
Select from:
- We are reporting a Scope 2, location-based figure
- We are not reporting a Scope 2, location-based figure
|
Select from:
- We are reporting a Scope 2, market-based figure
- We have no operations where we are able to access electricity supplier emission factors or residual emission factors, and are unable to report a Scope 2, market-based figure
- We have operations where we are able to access electricity supplier emission factors or residual emissions factors, but are unable to report a Scope 2, market-based figure
|
Text field [maximum 2,400 characters]
|
Requested content
General
- The GHG Protocol Scope 2 Guidance was published in January 2015. Part of the requirements of the guidance is that companies shall account for their Scope 2 emissions using two methodologies: a location-based method and a market-based method. The market-based method is for those companies who have any operations in markets providing product- or supplier-specific data in the form of contractual instruments. If this is not applicable to your company, you only need to provide one location-based figure.
- Per the GHG Protocol Corporate Standard, a contractual instrument is “any type of contract between two parties for the sale and purchase of energy bundled with attributes about the energy generation, or for unbundled attribute claims.” Different markets will have different contractual instruments, which can include energy attribute certificates, direct contracts such as PPAs, and supplier-specific emission rates.
- It is important to consider the definition of contractual instruments when determining whether your company needs to calculate a market-based figure. If your company can access emissions factors from your energy supplier for any of your operations, you are required to calculate and report a market-based figure. Therefore, when responding to this question, if you do have operations where there are contracts such as RECs and Guarantees of Origin, supplier specific emissions factors, or a residual emissions factor such as in the US and Europe – regardless of whether or not you purchase them – then you should not select “We have no operations where we are able to access electricity supplier emissions factors or residual emissions factors and are unable to report a Scope 2, market-based figure”. For full details please view the GHG Protocol Scope 2 Guidance. You can also reference CDP’s Technical Note on Accounting of Scope 2 emissions
- For the purpose of CDP reporting, to claim the use of renewable electricity for market-based figures, companies must source renewable electricity from within the boundary of the market in which they are consuming the electricity (i.e. comply with the market boundary criteria). Please refer to CDP’s Technical Note on Accounting of Scope 2 emissions for further information.
Scope 2 emissions data
(C6.3) What were your organization's gross global Scope 2 emissions in metric tons CO2e?
Change from last year
Modified question
Rationale
Reporting emissions is best practice and a pre-requisite to understanding and reducing negative environmental impacts. CDP asks this question to ensure companies are measuring emissions from purchased or acquired electricity, steam, heat, and cooling.
Ambition: Companies disclose that their Scope 2 emissions in the reporting year have reduced in line with a 1.5 °C-aligned pathway.
Connection to other frameworks
TCFD
Metrics & Targets recommended disclosure b) Disclose Scope 1, Scope 2, and, if appropriate, Scope 3 greenhouse gas (GHG) emissions, and the related risks.
S&P Global Corporate Sustainability Assessment
Indirect Greenhouse Gas Emissions (Scope 2)
TCFD Disclosure
Response options
Please complete the following table:
| Year
|
Scope 2, location-based
|
Scope 2, market-based (if applicable)
|
Start date
|
End date
|
Comment
|
| Reporting year
|
Numerical field [enter a range of 0-999,999,999,999 using a maximum of 3 decimal places and no commas]
|
Numerical field [enter a range of 0-999,999,999,999 using a maximum of 3 decimal places and no commas]
|
[This cell is not seen in ORS]
|
[This cell is not seen in ORS]
|
Text field [maximum 2,400 characters]
|
| Past year 1 [Only appears if "1 year", "2 years", "3 years", "4 years" or "5 years" is selected in column 5 of C0.2]
|
Numerical field [enter a range of 0-999,999,999,999 using a maximum of 3 decimal places and no commas]
|
Numerical field [enter a range of 0-999,999,999,999 using a maximum of 3 decimal places and no commas]
|
From: [DD/MM/YYYY]
|
To: [DD/MM/YYYY]
|
Text field [maximum 2,400 characters]
|
| Past year 2 [Only appears if "2 years", "3 years", "4 years" or "5 years" is selected in column 5 of C0.2]
|
Numerical field [enter a range of 0-999,999,999,999 using a maximum of 3 decimal places and no commas]
|
Numerical field [enter a range of 0-999,999,999,999 using a maximum of 3 decimal places and no commas]
|
From: [DD/MM/YYYY]
|
To: [DD/MM/YYYY]
|
Text field [maximum 2,400 characters]
|
| Past year 3 [Only appears if "3 years", "4 years" or "5 years" is selected in column 5 of C0.2]
|
Numerical field [enter a range of 0-999,999,999,999 using a maximum of 3 decimal places and no commas]
|
Numerical field [enter a range of 0-999,999,999,999 using a maximum of 3 decimal places and no commas]
|
From: [DD/MM/YYYY]
|
To: [DD/MM/YYYY]
|
Text field [maximum 2,400 characters]
|
| Past year 4 [Only appears if “4 years” or “5 years” is selected in column 5 of C0.2] |
Numerical field [enter a range of 0-999,999,999,999 using a maximum of 3 decimal places and no commas] |
Numerical field [enter a range of 0-999,999,999,999 using a maximum of 3 decimal places and no commas] |
From: [DD/MM/YYYY] |
To: [DD/MM/YYYY] |
Text field [maximum 2,400 characters] |
| Past year 5 [Only appears if “5 years” is selected in column 5 of C0.2] |
Numerical field [enter a range of 0-999,999,999,999 using a maximum of 3 decimal places and no commas] |
Numerical field [enter a range of 0-999,999,999,999 using a maximum of 3 decimal places and no commas] |
From: [DD/MM/YYYY] |
To: [DD/MM/YYYY] |
Text field [maximum 2,400 characters] |
Requested content
General
- Negative numbers are not allowed as reporting needs to be gross, not net figures. If you answered in C6.2 that you are not reporting a Scope 2 location-based figure and/or you answered that you are unable to report a Scope 2 market-based figure, please leave the corresponding column(s) in C6.3 blank.
- Putting in zero would suggest that you have measured your emissions and that they are equal to zero.
- Emissions estimates are acceptable, as long as there is transparency with regards to the estimation approach (what is estimated and how) and the data used for the analysis is adequate to support the objectives of the inventory.
- For more information about CDP’s current recommendations on what emission factor to use for electricity accounting, where you can find emission factors and the different types there are, please check the Technical Note“Accounting of Scope 2 emissions.” Please also note that electricity produced by either CH4 or N2O is to be included in the emission factor.
- For further information, please also see GHG Protocol Scope 2 Guidance.
- For more detailed information beyond what is provided in this guidance and technical annexes, consult your electricity suppliers, carbon advisor, or verifier/assurer.
Note for first-time responders
- If you are a first-time responder, please provide gross global Scope 2 emissions data for the current reporting year and up to five years prior to the current reporting year.
- The number of past year rows that will appear is dependent on your selection in column 5 of C0.2.
- Please input the gross global Scope 2 emissions data for the current reporting year in the first row and work backwards from the current reporting year.
- Please ensure that the reporting period represents only one full year that has already passed. Reporting periods should not be in the future. This information is important for others to understand the time dimension of your disclosure.
- Use the comment column to report relevant information regarding your organization's past Scope 2 emissions data.
Note for restatements
- If you have chosen to restate your organization’s gross global Scope 2 emissions data previously supplied to CDP (as indicated in column 5 of C0.2), you may do so here.
- The number of past year rows that will appear is dependent on your selection in column 5 of C0.2.
- Reporting recalculated figures for these years is optional.
- All years Scope 2 emissions data needs to be entered in reverse order, with the current reporting year first, i.e. you should first input the current reporting year emissions data and work backwards from the most recent reporting year.
- Please ensure that the reporting period represents only one full year that has already passed. Reporting periods should not be in the future. This information is important for others to understand the time dimension of your disclosure.
- Use the comment column to identify that this is restated data and the reason for the restatement.
- For more information on restatements, see CDP’s technical note on restatements here.
Note for agricultural sector companies:
- Scope 2 emissions from the use of electricity for agricultural/forestry, processing/manufacturing and/or distribution activities should be reported as Scope 2 emissions here.
Explanation of terms
-
Electricity: In line with GHG Protocol, this term is used as shorthand for electricity, steam, and heating/cooling. Purchased electricity is defined as electricity that is purchased or otherwise brought into the organizational boundary of the company. Scope 2 emissions physically occur at the facility where electricity is generated.
Additional information
- Scope 2 emissions: In many industries, indirect GHG emissions mostly occur from the generation of purchased electricity (and purchased heat, steam and cooling) consumed by the company, as per the GHG Protocol Corporate Standard. Non-energy-intensive companies are likely to have significantly higher Scope 2 figures than Scope 1 figures. The GHG Protocol highlights that “accounting for Scope 2 emissions allows companies to assess the risks and opportunities associated with changing electricity and GHG emissions cost.”
Exclusions
(C6.4) Are there any sources (e.g. facilities, specific GHGs, activities, geographies, etc.) of Scope 1, Scope 2 or Scope 3 emissions that are within your selected reporting boundary which are not included in your disclosure?
Change from last year
Modified question
Rationale
In some cases it can be difficult to gather data for all sources. Circumstances where this might be the case include sources in countries/areas or small facilities where data acquisition is difficult or unreliable. Structural changes to the organization including mergers, acquisitions and divestments can also be reasons where emissions data are not included in your disclosure. This question enables companies to report where these sources are not included in the disclosure and thus provides data users transparency into reported emissions inventories.
Ambition: Companies report emissions from all sources, and are transparent on all exclusions.
Response options
Select one of the following options:
Requested content
General
- Identify sources that would normally be within the consolidation boundary you have identified for your disclosure in C0.5 (i.e. financial control, operational control, equity share or other) but for which greenhouse gases are not reported in this disclosure. Excluded sources may be in a particular country/area or represent a number of very small facilities making it difficult to gather data.
- Common reasons for exclusions, both relevant or not relevant, can include the following:
- Incomplete information for the period in question;
- Structural changes to the organization including mergers, acquisitions and divestments;
- Outsourcing and/or insourcing of activities; and
- Unreliable information.
- The GHG Protocol’s Corporate Accounting and Reporting Standard notes on the reporting of exclusions (page 9) that “Specific exclusions…need to be clearly identified and justified, assumptions disclosed, and appropriate references provided for the methodologies applied and the data sources used. The information should be sufficient to enable a third party to derive the same results if provided with the same source data.”
- Only select “No” if your answers to C6.1, C6.3, and C6.5 represent the total gross global emissions of all the companies, businesses, other entities or groups that fall within the definition of your organization’s reporting boundary (provided in C0.5).
(C6.4a) Provide details of the sources of Scope 1, Scope 2, or Scope 3 emissions that are within your selected reporting boundary which are not included in your disclosure.
Question dependencies
This question only appears if you select “Yes” in response to C6.4.
Change from last year
Modified question
Rationale
In some cases it can be difficult to gather data for all sources. Circumstances where this might be the case include sources in countries/areas or small facilities where data acquisition is difficult or unreliable. Structural changes to the organization including mergers, acquisitions and divestments can also be reasons where emissions data are not included in your disclosure. This question enables companies to report where these sources are not included in the disclosure and thus provides data users transparency into reported emissions inventories.
Ambition: Companies report emissions from all sources, and are transparent on all exclusions.
Response options
Please complete the following table. You are able to add rows by using the “Add Row” button at the bottom of the table.
| 1
|
2
|
3
|
4
|
5
|
6
|
| Source of excluded emissions
|
Scope(s) or Scope 3 category(ies)
|
Relevance of Scope 1 emissions from this source
|
Relevance of location-based Scope 2 emissions from this source
|
Relevance of market-based Scope 2 emissions from this source
|
Relevance of Scope 3 emissions from this source
|
|
Text field [maximum 2,500 characters]
|
Select all that apply:
- Scope 1
- Scope 2 (location-based)
- Scope 2 (market-based)
- Scope 3: Purchased goods and services
- Scope 3: Capital goods
- Scope 3: Fuel and energy-related activities (not included in Scopes 1 or 2)
- Scope 3: Upstream transportation and distribution
- Scope 3: Waste generated in operations
- Scope 3: Business travel
- Scope 3: Employee commuting
- Scope 3: Upstream leased assets
- Scope 3: Downstream transportation and distribution
- Scope 3: Processing of sold products
- Scope 3: Use of sold products
- Scope 3: End-of-life treatment of sold products
- Scope 3: Downstream leased assets
- Scope 3: Franchises
- Scope 3: Investments [hidden for FS sector companies, data point requested in C-FS14.1a]
- Scope 3: Other (upstream)
- Scope 3: Other (downstream)
|
Select from:
- Emissions are not relevant
- Emissions are relevant but not yet calculated
- Emissions are relevant and calculated, but not disclosed
- Emissions excluded due to a recent acquisition or merger
- Emissions are not evaluated
|
Select from:
- Emissions are not relevant
- Emissions are relevant but not yet calculated
- Emissions are relevant and calculated, but not disclosed
- Emissions excluded due to a recent acquisition or merger
- Emissions are not evaluated
|
Select from:
- Emissions are not relevant
- Emissions are relevant but not yet calculated
- Emissions are relevant and calculated, but not disclosed
- Emissions excluded due to a recent acquisition or merger
- Emissions are not evaluated
|
Select from:
- Emissions are not relevant
- Emissions are relevant but not yet calculated
- Emissions are relevant and calculated, but not disclosed
- Emissions excluded due to a recent acquisition or merger
- Emissions are not evaluated
|
| 7
|
8
|
9
|
10
|
11
|
| Date of completion of acquisition or merger
|
Estimated percentage of total Scope 1+2 emissions this excluded source represents
|
Estimated percentage of total Scope 3 emissions this excluded source represents
|
Explain why this source is excluded
|
Explain how you estimated the percentage of emissions this excluded source represents
|
| [DD/MM/YYYY]
|
Numeric field [enter a value of 0-100 with 1 decimal places]
|
Numeric field [enter a value of 0-100 with 1 decimal place]
|
Text field [maximum 2,500 characters]
|
Text field [maximum 2,500 characters]
|
[Add Row]
Requested content
Source of excluded emissions (column 1)
- Use this text field to name and briefly describe the source you are excluding. E.g. a geographic region, business activity, or type of facility.
- If the source you are excluding is an organization (e.g. one of your subsidiaries or franchises), please state the full legal entity name of the organization in this column.
- Your response to this question should be consistent with the boundary you have used to calculate and report emissions in C6.1, C6.3, and C6.5.
Scope(s) or Scope 3 category(ies) (column 2)
- Select the Scope(s) and/or Scope 3 category(ies) of emissions from which you are excluding emissions from this source in your response to questions C6.1, C6.3 and/or C6.5.
Relevance of Scope 1 emissions from this source (column 3)
- This column is presented if you select “Scope 1” in response to column 2 “Scope(s) or Scope 3 category(ies)”.
- Emissions are not relevant – select this option if you have excluded Scope 1 emissions which you have identified as not relevant from this source.
- Emissions are relevant but not yet calculated – select this option if you have excluded Scope 1 emissions from this source, you have identified these emissions as relevant, but you have not calculated them.
- Emissions from this source are relevant and have been calculated, but are not disclosed – select this option if you have excluded from your CDP response Scope 1 emissions from this source that you have calculated and identified as relevant.
- Emissions excluded due to a recent acquisition or merger – select this option if you have excluded Scope 1 emissions from this source due to an acquisition or merger that has taken place during the reporting period.
- Emissions are not evaluated – select this option if you have excluded Scope 1 emissions from this source but have not evaluated the relevance of these emissions.
Relevance of Scope 2 (location-based or market-based) emissions from this source (column 4 and 5)
- This column is presented if you select “Scope 2 (location-based)” (column 4) and/or “Scope 2 (market-based)” (column 5) in response to column 2 “Scope(s) or Scope 3 category(ies)”.
- Emissions are not relevant – select this option if you have excluded Scope 2 emissions which you have identified as not relevant from this source.
- Emissions are relevant but not yet calculated – select this option if you have excluded Scope 2 emissions from this source, you have identified these emissions as relevant, but you have not calculated them.
- Emissions from this source are relevant and have been calculated, but are not disclosed –select this option if you have excluded from your CDP response Scope 2 emissions from this source that you have calculated and identified as relevant.
- Emissions excluded due to a recent acquisition or merger – select this option if you have excluded Scope 2 emissions from this source due to an acquisition or merger that has taken place during the reporting period.
- Emissions are not evaluated – select this option if you have excluded Scope 2 emissions from this source but have not evaluated the relevance of these emissions.
Relevance of Scope 3 emissions from this source (column 6)
- This column is presented if you select a Scope 3 category in response to column 2 “Scope(s) or Scope 3 category(ies)”.
- Emissions are not relevant – select this option if you have excluded Scope 3 emissions which you have identified as not relevant from this source.
- Emissions are relevant but not yet calculated – select this option if you have excluded Scope 3 emissions from this source, you have identified these emissions as relevant, but you have not calculated them.
- Emissions from this source are relevant and have been calculated, but are not disclosed – select this option if you have excluded from your CDP response Scope 3 emissions from this source that you have calculated and identified as relevant.
- Emissions excluded due to a recent acquisition or merger – select this option if you have excluded Scope 3 emissions from this source due to an acquisition or merger that has taken place during the reporting period. This may only be used to exclude emissions from an acquired or merged organization’s value chain, not your company’s. For example, if you have acquired a company, you may select this option to report exclusions from the acquired company’s value chain (i.e. their Scope 3 emissions) but not your own value chain. For exclusions from your own value chain, select the most relevant other dropdown.
- Emissions are not evaluated – select this option if you have excluded Scope 3 emissions from this source but have not evaluated the relevance of these emissions.
Date of completion of acquisition or merger (column 7)
- This column is presented if “Emissions are excluded due to a recent acquisition or merger” is selected in column 3, 4, 5, or 6.
Estimated percentage of total Scope 1+2 emissions this excluded source represents (column 8)
- This column is presented if any option other than “Emissions excluded due to recent acquisition or merger”, or “Emissions are not evaluated” is selected in column 3, and in either column 4 or 5.
- This figure should be estimated using the following formula:
Estimated percentage of total Scope 1+2 emissions the excluded source represents = 100% x (Estimated Scope 1+2 emissions the excluded source represents) / (Total gross Scope 1+2 emissions reported in C6.1 and C6.3)
- If you have calculated the Scope 1+2 emissions from the excluded source, use the formula above to provide the percentage of your total, gross, global Scope 1+2 emissions in the reporting year that the excluded source represents.
- If you have not yet calculated Scope 1+2 emissions from the excluded source, or if activity data is unavailable, you may estimate the Scope 1+2 emissions for the excluded source. You should choose an estimation approach that is appropriate to your sector, organization, the excluded source, and the data available. For example, absolute Scope 1+2 emissions could be estimated using the Scope 1+2 emissions intensity of a similar source for which data is available, such as an industry-average emissions intensity for the type of source excluded per e.g. unit revenue, floor area, or FTE employee, or using proxy data and rough estimates. Ensure to be transparent in column 11 with regards to the estimation approach (what is estimated and how), and the data used for the estimation.
Estimated percentage of total Scope 3 emissions this excluded source represents (column 9)
- This column is presented if any option other than “Emissions excluded due to recent acquisition or merger”, or “Emissions are not evaluated” is selected in column 6.
- This figure should be estimated using the following formula:
Estimated percentage of total Scope 3 emissions the excluded source represents = 100% x (Estimated Scope 3 emissions the excluded source represents) / (Total gross Scope 3 emissions reported in C6.5)
- If you have not yet calculated Scope 3 emissions from the excluded source, or if activity data is unavailable, you may estimate the Scope 3 emissions for the excluded source. You should choose an estimation approach that is appropriate to your sector, organization, the excluded source, and the data available. For example, absolute Scope 3 emissions could be estimated using the Scope 3 emissions intensity of a similar source for which data is available, such as an industry-average emissions intensity for the type of source excluded per e.g. unit revenue, floor area, or FTE employee, or using proxy data and rough estimates. Ensure to be transparent in column 11 with regards to the estimation approach (what is estimated and how), and the data used for the estimation.
Explain why this source is excluded (column 10)
- Use this text field to describe why the source is excluded and its significance.
Explain how you estimated the percentage of emissions this excluded source represents (column 11)
- This column is presented if any option other than “Emissions excluded due to recent acquisition or merger” or “Emissions are not evaluated” is selected in column 3, 4, 5 or 6.
- Explain how you calculated the estimated percentage of your total, gross, global Scope 1+2, and Scope 3 emissions that the exclusion represents, including details of any emissions estimations and the estimation approaches used.
- State whether you used the location-based or market-based Scope 2 figure from C6.3 in your calculation of the figure reported in column 8.
- Provide a level of confidence for your estimations, and indicate whether the figures have been verified by a third party.
Example response
Worked example of excluded sources
In this instance presume that the company has selected ‘“Operational control’” in C0.5. Note that this example company response would be ineligible for the climate change A List due to excluded, relevant emissions and unevaluated, potentially relevant emissions.
| 1
|
2
|
3
|
4
|
5
|
6
|
7
|
| Source of excluded emissions
|
Scope(s) or Scope 3 category(ies)
|
Relevance of Scope 1 emissions from this source
|
Relevance of location-based Scope 2 emissions from this source
|
Relevance of market-based Scope 2 emissions from this source
|
Relevance of Scope 3 emissions from this source
|
Date of completion of acquisition or merger
|
| Four
manufacturing facilities in Asia.
|
Scope 3: Fuel and energy-related activities (not included in Scopes 1 or 2)
|
Emissions
are not evaluated.
|
Emissions
are relevant but not yet calculated.
|
Emissions are relevant but not yet calculated.
|
Emissions are relevant but not yet calculated.
|
n/a
|
| 8
|
9
|
10
|
11
|
| Estimated percentage of total Scope 1+2 emissions this excluded source represents
|
Estimated percentage of total Scope 3 emissions this excluded source represents
|
Explain why this source is excluded
|
Explain how you estimated the percentage of emissions this excluded source represents
|
| 21%
|
17%
|
At present, we are only able to disclose our emissions from our European operations, but not our Asian operations.
In terms of Scope 1 emissions, we are aware that our manufacturing operations may be associated with leakage of refrigerants, however we have not yet had the capacity to investigate and evaluate this thoroughly.
In terms of Scope 2 emissions, we do have records of how much electricity we purchase in our four Asian facilities, but we have not yet adopted an approach to account for the associated Scope 2 emissions. As we have operations in Europe, where there are contractual instruments, we have also calculated a market-based figure. While there are no contractual instruments for our Asian operations, we are still unable to provide a market-based figure for those operations.
In terms of Scope 3 emissions, we do not have access to data on the emissions created by the production and transportation of fuel.
|
We used a benchmarking approach to estimate the emissions for our four manufacturing facilities in Asia.
We have ten European facilities of a similar size, age and build, for which we have calculated our scope 1 and 2 location-based emissions. We used their emissions data as a proxy to estimate the emissions of the four Asian facilities based on the floor area.
Total scope 1 + 2 (location-based) for 10 European factories = 150,000tCO2e
Total floor area for 10 comparable European facilities = 4000m2
Total floor area for 4 Asian facilities = 1000m2
Estimated emissions for 4 Asian facilities = 150,000 x (1000/4000) = 37,500tCO2e
Estimated percentage of total Scope 1+2 emissions = 100% x 37,500/(37,500+150,000) = 20%
Estimated percentage of total Scope 3 emissions = 100% x 13,700/80,000 = 17%
|
Additional information
Relevance in GHG reporting
- The GHG Protocol’s Corporate Value Chain (Scope 3) Accounting and Reporting Standard (page 24) provides the following definition of relevance for GHG reporting: “A relevant GHG report contains the information that users – both internal and external to the company – need for their decision making. Companies should use the principle of relevance when determining whether to exclude any activities from the inventory boundary. Companies should also use the principle of relevance as a guide when selecting data sources. Companies should collect data of sufficient quality to ensure that the inventory is relevant (i.e., that it appropriately reflects the GHG emissions of the company and serves the decision-making needs of users) (...) and should not exclude any activities from the inventory that would compromise the relevance of the reported inventory.”
- A practical rule of thumb often applied to evaluate the relevance of an emissions’ source or activity is to consider the sources that contribute to 95% of the emissions inventory once sources are listed by the size of emissions. This rule is of practical value in particular when a low number of sources contribute to a large proportion of the total emissions while a large number of sources contribute to a small percentage of emissions. In order to utilize the 95% threshold, the emissions from all sources or activities need to be quantified or estimated to ensure they meet this threshold. Relevance should apply not only to the size of emissions, but also other criteria, such as the potential to drive emissions reductions, the cost-benefit of gathering the data, stakeholder expectations, and potential uses of the data.
- Relevance of emissions should not be limited to sustainability topics that have a significant financial impact on your organization, or “materiality”.
- Examples of circumstances where the reasons for excluding known emissions sources from the GHG statement may not be reasonable include:
- The entity has relevant Scope 1 emissions but only includes Scope 2 emissions in its CDP disclosure.
- The boundary has been defined, but particular geographies within the boundary are not being reported although they represent relevant emissions; and
- The emissions reported exclude business divisions/areas of business with relevant emissions which are only a small proportion of the total emissions included in the GHG statement (i.e., once emissions are quantified at a sufficient level of quality they should be included in the inventory, even if they represent only a small share of the total).
Methodologies for estimating emissions from excluded sources
- Where verifiable data is not available, organizations may estimate emissions data by:
- Direct comparison: using data from another comparable time period to fill the gap for the excluded source e.g. emissions from the same time period in another year.
- Pro-rata extrapolation: using average data from one period of time to estimate data for another shorter period e.g. using average daily emissions from 1st January to 30th November to estimate emissions for 1st to 31st December.
- Benchmarking: using emissions or activity data for one asset or business activity as a proxy to estimate emissions or activity data for another asset or business activity e.g. using the annual emissions of one office to estimate emissions from another office of similar size, age or build.
Scope 3 emissions data
(C6.5) Account for your organization’s gross global Scope 3 emissions, disclosing and explaining any exclusions.
Change from last year
Modified guidance
Rationale
For most companies, the majority of emissions occur in the value chain. CDP asks this question to gauge the thoroughness of companies’ accounting processes and to understand how companies are analyzing their emissions footprints.
Connection to other frameworks
SDG
Goal 12: Responsible consumption and production
Goal 13: Climate action
TCFD
Metrics & Targets recommended disclosure b) Disclose Scope 1, Scope 2, and, if appropriate, Scope 3 greenhouse gas (GHG) emissions, and the related risks.
S&P Global Corporate Sustainability Assessment
Scope 3 Financed Absolute Emissions
Scope 3 Financed Emission Intensity
Scope 3 GHG Emissions
TCFD Disclosure
Response options
Please complete the following table:
| Scope 3 category |
Evaluation status
|
Emissions in reporting year (metric tons CO2e)
|
Emissions calculation methodology
|
Percentage of emissions calculated using data obtained from suppliers or value chain partners
|
Please explain |
|
Purchased goods and services
|
Select from:
- Relevant, calculated
- Relevant, not yet calculated
- Not relevant, calculated
- Not relevant, explanation provided
- Not evaluated
|
Numerical field [enter a number from 0-999,999,999,999 using a maximum of 3 decimal places and no commas]
|
Select all that apply:
- Supplier-specific method
- Hybrid method
- Average data method
- Spend-based method
- Average product method
- Average spend-based method
- Fuel-based method
- Distance-based method
- Waste-type-specific method
- Asset-specific method
- Lessor-specific method
- Site-specific method
- Methodology for direct use phase emissions, please specify
- Methodology for indirect use phase emissions, please specify
- Franchise-specific method
- Investment-specific method
- Other, please specify
|
Numerical field [enter a number from 0-100 using a maximum of 2 decimal places and no commas]
|
Text field [maximum 2,400 characters]
|
|
Capital goods
|
|
|
|
|
|
|
Fuel-and-energy-related activities (not included in Scope 1 or 2)
|
|
|
|
|
|
|
Upstream transportation and distribution
|
|
|
|
|
|
|
Waste generated in operations
|
|
|
|
|
|
|
Business travel
|
|
|
|
|
|
|
Employee commuting
|
|
|
|
|
|
|
Upstream leased assets
|
|
|
|
|
|
|
Downstream transportation and distribution
|
|
|
|
|
|
|
Processing of sold products
|
|
|
|
|
|
|
Use of sold products
|
|
|
|
|
|
|
End of life treatment of sold products
|
|
|
|
|
|
|
Downstream leased assets
|
|
|
|
|
|
|
Franchises
|
|
|
|
|
|
|
Investments [row hidden for FS sector companies, data point requested in C-FS14.1a]
|
|
|
|
|
|
|
Other (upstream)
|
|
|
|
|
|
|
Other (downstream)
|
|
|
|
|
|
Requested content
General
- According to the GHG Protocol’s Corporate Value Chain (Scope 3) Accounting and Reporting Standard (page 107): “Any estimates of avoided
emissions must be reported separately from a company’s Scope 1, Scope 2, and
Scope 3 emissions, rather than included or deducted from the Scope 3
inventory”. In the context of your CDP response, you can provide information on
actions you take to reduce your Scope 3 emissions in question C4.3b on
emissions reduction initiatives.
- You should complete every row of the table (with the
exception of the last two rows “Other (upstream)” and “Other (downstream)”
which are optional), but not necessarily all columns.
- The columns that you need to complete in response to
question C6.5 will depend on your selection made in the “Evaluation status”
column and are summarized in the guidance below for column 2 “Evaluation
status”.
Scope 3 category (column 1)
- This column is already completed in the ORS and all
categories will appear. The categories of Scope 3 emissions have been taken
from the Greenhouse Gas Protocol’s
Corporate Value Chain (Scope 3) Accounting and Reporting Standard, published in September 2011. Companies should refer to
the standard for information on the emissions sources that each category
comprises and additional information on how to calculate these emissions.
Evaluation status (column 2)
This column should be completed for all Scope 3 categories,
with the exception of “Other (upstream)” and “Other (downstream)” – these two
rows should only be used if companies have a source of Scope 3 emissions that
is not provided in the categories above. The evaluation status includes two
components: whether a Scope 3 category is relevant to your business and whether
you have calculated the emissions in that category. Relevance should be determined
with reference to the GHG Protocol Scope 3 standard and
CDP's Technical Note on the relevance of Scope 3 categories by sector – see
Additional
Information for the Scope 3 relevance criteria
. Select from:
- Relevant, calculated - Select this option if the Scope 3
category is relevant to your business and you have calculated the emissions associated with at
least part of it.
- Relevant, not yet calculated - Select this option if you are
aware that the Scope 3 category is relevant to your business but you have not
yet calculated the emissions associated with it.
- Not relevant, calculated - Select this option if you know
that this Scope 3 category is not one of the most important for your business but as part
of your Scope 3 work, you have been able to calculate the emissions associated
with it.
- Not relevant, explanation provided - Select this option if
you have investigated this Scope 3 category and have been able to
determine that it is not relevant. This could be based on quantitative or
qualitative investigations.
- Not evaluated - Select this option if you have not yet
investigated this Scope 3 category and therefore do not know whether or not it is
relevant for your business.
Emissions in reporting year (metric tons CO2e) (column 3)
- This column is only presented if “Relevant, calculated” or “Not relevant, calculated” is selected in column 2 “Evaluation status”.
- Enter the emissions appropriate to each Scope 3 category identified in metric tons CO2e, entering numbers only up to 99,999,999,999 without commas and up to three decimal places. Negative numbers are not allowed as reporting needs to be gross, not net figures. Emission figures should be for the reporting year only.
- Entering 0 implies that you have calculated the emissions associated with this category and they are equal to zero.
Emissions calculation methodology (column 4)
- This column is only presented if “Relevant, calculated” or “Not relevant, calculated” is selected in column 2 “Evaluation status”.
- Select the calculation methodology(ies) used to calculate the emissions associated with this Scope 3 category.
- You should consult the GHG Protocol’s Technical Guidance for Calculating Scope 3 Emissions for details of which emissions calculations methodologies are relevant to each Scope 3 category.
Percentage of emissions calculated using data obtained from suppliers or value chain partners (column 5)
- This column is only presented if “Relevant, calculated” or “Not relevant, calculated” is selected in column 2 “Evaluation status”.
- Such data obtained from suppliers or value chain partners may take the form of primary activity data, or emissions data calculated by suppliers that are specific to suppliers’ activities. More information on this can be found in Chapter 7, Collecting Data, of the GHG Protocol’s Corporate Value Chain (Scope 3) Accounting and Reporting Standard.
Please explain (column 6)
- For all Scope 3 categories that you have identified as “Relevant, calculated” or “Not relevant, calculated” in the “Evaluation status” column, provide a short description of the types and sources of data used to calculate emissions (e.g. activity data, emission factors and GWP values), and any further details of the emissions calculation methodology(ies) selected in column 5 such the assumptions and allocation methods used.
- State the extent of the boundary of your calculation – see pages 34-38 of the GHG Protocol’s Corporate Value Chain (Scope 3) Accounting and Reporting Standard for information on the minimum and, where applicable, optional boundary of each Scope 3 category.
- For all transport-related emissions (i.e., those in Scope 3 category 4: “Upstream transportation and distribution”, category 6: “Business travel”, category 7 “Employee commuting” and category 9: “Downstream transportation and distribution”), indicate the life cycle stages covered in your calculation (e.g., Well-to-Wheel etc.). See the Explanation of Terms for more information.
- Note that any exclusions within a Scope 3 category should not be detailed here, but should be disclosed in question C6.4a.
- For all Scope 3 categories that you have identified as “Not relevant, explanation provided” in the “Evaluation status” column, provide details of how you have reached the conclusion that the source is not relevant and include any qualitative or quantitative reasoning.
- If you wish to provide additional context to any of the rows in the table, such as to explain why emissions have decreased or increased, you can also do that in this column.
Note for all high-impact sector companies:
Note for oil & gas and coal sector companies:
- CDP has produced sector-specific guidance for estimating
Scope 3 category 11 (use of sold products) emissions for the
Oil & Gas and
Coal sectors.
Note for financial services sector companies:
- For financial services sector companies responding to the full version of the questionnaire, Scope 3 Category 15 “Investments” emissions has been pulled out of question C6.5 and is requested to be disclosed in C-FS14.1a. As the majority of emissions occur in relation to financial products and services and/or investments, financed emissions, or Scope 3 Category 15 “Investments” emissions as defined by the GHG Protocol is the most relevant category to financial services organizations.
- Thus, Row 15 “Investments” is hidden in this question,
please disclose this in C-FS14.1a.
Note for companies responsible for the transportation (including maritime), storage, transmission and distribution of fossil fuels:
- Scope 3 emissions from the handling of fossil fuels can be significant, as highlighted by the IEEFA. Therefore, companies responsible for the transportation (including maritime), storage, transmission and distribution of fossil fuels should disclose emissions from the final use of these products as Scope 3 category 11 “Use of Sold Products”.
- Scope 3 category 11 emissions from fossil fuels should be calculated based on the throughput of fossil fuel products in your operations during the reporting year.
- As per the ACT initiative’s O&G Sector methodology, these emissions are a consequence of a companies’ activities even though the fossil fuels may not be owned by the company and thus are included in Scope 3.
- Please refer to the CDP Technical Note “Guidance methodology for the estimation of Scope 3 category 11 emissions for oil and gas companies” for further guidance.
Explanation of terms
- Well-to-Wheel (WTW): A Well-to-Wheel analysis considers both the emissions from the vehicle itself, but also the emissions from the process of extracting the fuel used to power the vehicle's engine. It can be subdivided into the Well-to-Tank (WTT) (energy provision) analysis and the Tank-to-Wheel (TTW) (vehicle efficiency) analysis. Compared to a full emissions Life Cycle Assessment (LCA), the production, maintenance, and disposal of the vehicle are not assessed.
Example Response
Example response for the selection of
“Relevant, calculated” in column 2.
| Scope 3 category
|
Evaluation status
|
Emissions in reporting year (metric tons CO2e)
|
Emissions calculation methodology
|
Percentage of emissions calculated using data obtained from suppliers or value chain partners
|
Please explain
|
| Downstream transportation and distribution
|
Relevant, calculated
|
486,000
|
Distance-based method
|
80
|
To calculate upstream product transportation and distribution we used shipping weight and distance data provided by our logistics division based on fiscal year 2021 shipment data, which provides resolution to final destinations at the UK county level.
Emissions were calculated using UK Government GHG Conversion Factors for Company Reporting, using a kgCO2e per tonne.km emission factor for an average-laden HGV.
Where data was not available, final truck shipment from distribution centers to final destinations was estimated as 200 kilometers.
|
Example response for the selection of
“Not relevant, explanation provided” in column 2.
| Scope 3 category
|
Evaluation status
|
Emissions in reporting year (metric tons CO2e)
|
Emissions calculation methodology
|
Percentage of emissions calculated using data obtained from suppliers or value chain partners
|
Please explain
|
| Franchises
|
Not relevant, explanation provided
|
N/A
|
N/A
|
N/A
|
We do not have any franchises, so this category is not relevant to our organization.
|
Additional information
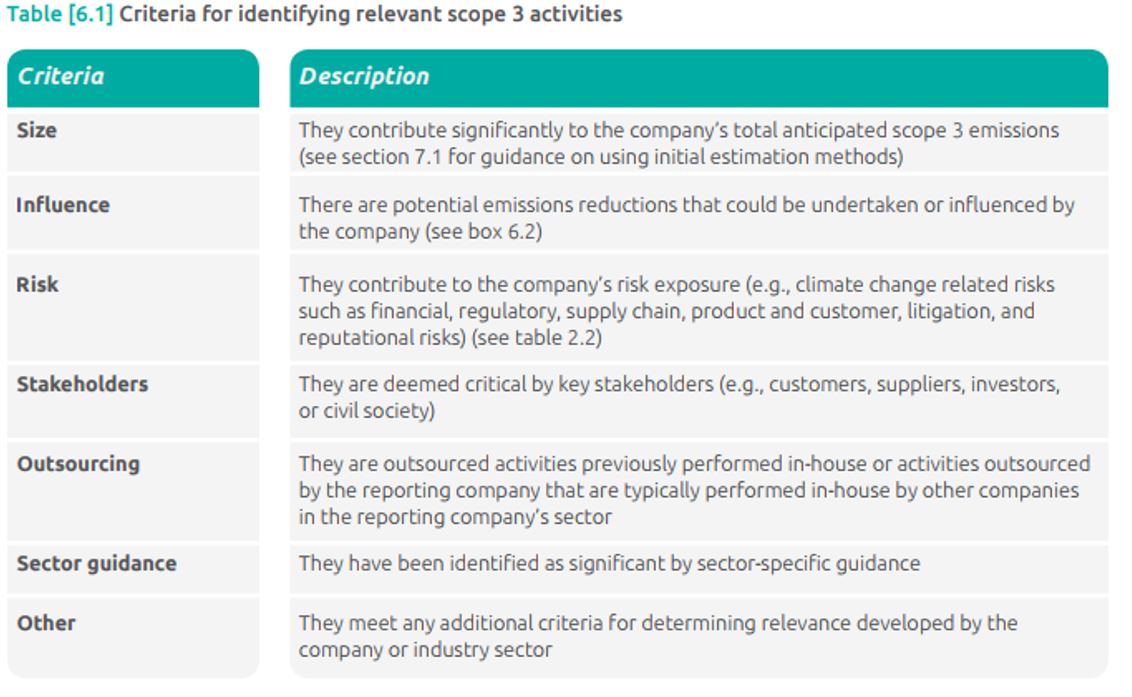
- Scope 3 screening tool: To help facilitate the adoption of the Scope 3 Standard and assist companies in determining the relevance of Scope 3 emissions sources, the GHG Protocol, in collaboration with Quantis, have released a free Scope 3 screening tool. This tool asks a number of relatively simple questions to approximate your Scope 3 inventory, and can be used by companies of all sizes and all sectors. Please note that this tool is not a data collection tool and should only be used to make a first approximation of your Scope 3 emissions. Having used the tool to help determine the relevance of Scope 3 categories, companies should then develop more accurate approaches for categories shown to be a relevant source of emissions.
(C6.5a) Disclose or restate your Scope 3 emissions data for previous years.
Question dependencies
This question only appears if you select “1 year” or “2 years” or “3 years” or “4 years” or “5 years” in response to “Select the number of past reporting years you will be providing Scope 3 emissions data for” in C0.2.
Change from last year
Modified question
Rationale
A prerequisite for a meaningful emissions data comparison is a consistent data set over time. This question enables companies to restate Scope 3 emissions data previously supplied to CDP, for example to ensure that their historical data reflects their current organizational boundary. It also enables first-time responders to provide Scope 3 emissions data for the five years prior to the reporting year.
Ambition: Companies disclose Scope 3 emissions from previous years to enable tracking over time and to reflect changes that would otherwise compromise the consistency and relevance of the reported GHG emissions information.
Connection to other frameworks
TCFD
Metrics and Targets recommended disclosure b) Disclose Scope 1, Scope 2, and, if appropriate, Scope 3 greenhouse gas (GHG) emissions, and the related risks.
SDG
Goal 12: Responsible consumption and production
Goal 13: Climate action
Response options
Please complete the following table:
| 1
|
2
|
3
|
4
|
5
|
6
|
7
|
| Year
|
Start date
|
End date
|
Scope 3: Purchased goods and services (metric tons CO2e)
|
Scope 3: Capital goods (metric tons CO2e)
|
Scope 3: Fuel and energy-related activities (not included in Scopes 1 or 2) (metric tons CO2e)
|
Scope 3: Upstream transportation and distribution (metric tons CO2e)
|
| Past year 1 [Only appears if “1 year”, “2 years”, “3 years”, “4 years” or “5 years" is selected in column 6 of C0.2]
|
[DD/MM/YYYY]
|
[DD/MM/YYYY]
|
Numerical field [enter a range of 0-999,999,999,999 using a maximum of 3 decimal places and no commas]
|
Numerical field [enter a range of 0-999,999,999,999 using a maximum of 3 decimal places and no commas]
|
Numerical field [enter a range of 0-999,999,999,999 using a maximum of 3 decimal places and no commas]
|
Numerical field [enter a range of 0-999,999,999,999 using a maximum of 3 decimal places and no commas]
|
| Past year 2 [Only appears if “2 years”, “3 years”, “4 years” or “5 years" is selected in column 6 of C0.2]
|
|
|
|
|
|
|
| Past year 3 [Only appears if “3 years”, “4 years” or “5 years" is selected in column 6 of C0.2]
|
|
|
|
|
|
|
| Past year 4 [Only appears if “4 years” or “5 years” is selected in column 6 of C0.2]
|
|
|
|
|
|
|
| Past year 5 [Only appears if “5 years” is selected in column 6 of C0.2]
|
|
|
|
|
|
|
| 8
|
9
|
10
|
11
|
12
|
13
|
14
|
| Scope 3: Waste generated in operations (metric tons CO2e)
|
Scope 3: Business travel (metric tons CO2e)
|
Scope 3: Employee commuting (metric tons CO2e)
|
Scope 3: Upstream leased assets (metric tons CO2e)
|
Scope 3: Downstream transportation and distribution (metric tons CO2e)
|
Scope 3: Processing of sold products (metric tons CO2e)
|
Scope 3: Use of sold products (metric tons CO2e)
|
| Numerical field [enter a range of 0-999,999,999,999 using a maximum of 3 decimal places and no commas]
|
Numerical field [enter a range of 0-999,999,999,999 using a maximum of 3 decimal places and no commas]
|
Numerical field [enter a range of 0-999,999,999,999 using a maximum of 3 decimal places and no commas]
|
Numerical field [enter a range of 0-999,999,999,999 using a maximum of 3 decimal places and no commas]
|
Numerical field [enter a range of 0-999,999,999,999 using a maximum of 3 decimal places and no commas]
|
Numerical field [enter a range of 0-999,999,999,999 using a maximum of 3 decimal places and no commas]
|
Numerical field [enter a range of 0-999,999,999,999 using a maximum of 3 decimal places and no commas]
|
|
|
|
|
|
|
|
|
|
|
|
|
|
|
|
|
|
|
|
|
|
|
|
|
|
|
|
|
| 15
|
16
|
17
|
18
|
19
|
20
|
21
|
| Scope 3: End of life treatment of sold products (metric tons CO2e)
|
Scope 3: Downstream leased assets (metric tons CO2e)
|
Scope 3: Franchises (metric tons CO2e)
|
Scope 3: Investments (metric tons CO2e) [column hidden for FS sector companies]
|
Scope 3: Other (upstream) (metric tons CO2e)
|
Scope 3: Other (downstream) (metric tons CO2e)
|
Comment
|
| Numerical field [enter a range of 0-999,999,999,999 using a maximum of 3 decimal places and no commas]
|
Numerical field [enter a range of 0-999,999,999,999 using a maximum of 3 decimal places and no commas]
|
Numerical field [enter a range of 0-999,999,999,999 using a maximum of 3 decimal places and no commas]
|
Numerical field [enter a range of 0-999,999,999,999 using a maximum of 3 decimal places and no commas]
|
Numerical field [enter a range of 0-999,999,999,999 using a maximum of 3 decimal places and no commas]
|
Numerical field [enter a range of 0-999,999,999,999 using a maximum of 3 decimal places and no commas]
|
Text field [maximum 5,000 characters]
|
|
|
|
|
|
|
|
|
|
|
|
|
|
|
|
|
|
|
|
|
|
|
|
|
|
|
|
|
Requested content
General
- Emissions must be reported in gross, not net figures. Therefore, negative numbers are not allowed.
- Entering zero suggests that you have measured your emissions and that they are equal to zero.
- You should enter data for all Scope 3 categories for which emissions have been calculated for the reporting period specified in columns 2 and 3. If you have not calculated emissions for a Scope 3 category for that reporting period, leave the corresponding column blank.
- Ensure that the reporting period represents only one full year that has already passed. Reporting periods should not be in the future. This information is important for others to understand the time dimension of your disclosure.
- Emissions estimates are acceptable, as long as there is transparency with regard to the estimation approach (what is estimated and how) and the data used for the analysis is adequate to support the objectives of the inventory. If applicable to your organization's reporting of Scope 3 emissions, please outline this in the comment column.
Note for first time responders
- If you are a first-time responder, please provide gross global Scope 3 emissions data for up to five years prior to the current reporting year.
- The number of past year rows that will appear is dependent on your selection in column 6 of C0.2.
- Input Scope 3 emissions data for the year prior to the current reporting year in the first row and work backwards.
- Use the comment column to report relevant information regarding your organization's past Scope 3 emissions data, such as the emissions calculation methodologies used, and an indication of the proportion of emissions calculated using data obtained from suppliers or value chain partners.
Note for restatements
- If you have chosen to restate your organization's gross global Scope 3 emissions data previously supplied to CDP (as indicated in column 6 of C0.2), you may do so here.
- The number of past year rows that will appear is dependent on your selection in column 6 of C0.2.
- Reporting recalculated figures for these years is optional.
- Restated Scope 3 emissions data needs to be entered in reverse order i.e. you should work backwards from the most recent reporting year.
- Use the comment column to identify that this is restated data and the reason for the restatement.
- For more information on restatements see the CDP technical note on restatements here.
Note for financial services sector companies:
- Column 18 “Scope 3 Category 15 “Investments” emissions” is not shown to financial services sector companies completing the full version of the questionnaire.
Biogenic
carbon data: agriculture
(C-AC6.8/C-FB6.8/C-PF6.8) Is biogenic carbon pertaining to your direct operations relevant to your current CDP climate change disclosure?
Question dependencies
This question only appears if you select "Own land only”, “Both own land and elsewhere in the value chain”, “Direct operations only”, or “Both direct operations and elsewhere in the value chain” in C-AC0.6/C-FB0.6/C-PF0.6.
Change from last year
No change
Rationale
According to the GHG Protocol Agricultural Guidance, except for land use change (LUC) that results in a reduction of carbon stock, all other CO2 fluxes to/from biologically based carbon pools that are owned or controlled by you should be reported separately from the Scopes in a special “Biogenic Carbon” category. Thus, this question gathers information on biogenic carbon that is not included in your Scope 1 and Scope 2 figures.
This information provides context to data users on the extent of your biogenic carbon fluxes and on the neutrality of you CO2 emissions.
Note that this question asks about any CO2 fluxes that have not resulted in a reduction of carbon stock, as well as any CO2 emissions from biofuel/biomass combustion in, but not limited to, machinery and vehicles (e.g. land/processing/manufacturing machinery, transportation vehicles).
Response options
Select one of the following options:
Requested content
General
- There are three components of Biogenic Carbon:
- CO2 fluxes (emissions or removals) during land use management;
- Sequestration during LUC; and
- CO2 emissions from biofuel combustion (from land/processing/manufacturing machinery as well as biofuels used in vehicles).
- Select "Yes" if any of the above applies to your organization.
- Note that CO2 emissions from soils and woody biomass that result from land use change should be reported within the Scopes (not in the Biogenic Carbon category) because they effectively constitute permanent losses of carbon to the atmosphere.
- The GHG Protocol is developing new Land Sector and Removals Guidance. This new guidance is currently in the pilot testing and review phase, and will be finalized and published in 2023. Companies responding to the CDP 2023 climate change questionnaire should report in accordance with existing GHG Protocol corporate standards, and not use the draft land sector and removals guidance for CDP reporting in 2023, as it is still under development.
Explanation of terms
- Biogenic carbon: Refers to carbon which is contained in biomass (both above-ground and below-ground), dead organic matter, soil organic matter, and harvested products.
- Land use management: Movement of CO2 from carbon stocks in soils, above and below-ground woody biomass, and dead organic matter (DOM) stocks, and the combustion of crop residues for non-energy purposes.
- Sequestration during land use change: CO2 removals by soils and biomass following afforestation or reforestation.
Additional information
(C-AC6.8a/C-FB6.8a/C-PF6.8a) Account for biogenic carbon data pertaining to your direct operations and identify any exclusions.
Question dependencies
This question only appears if you select "Yes" in response to C-AC6.8/C-FB6.8/C-PF6.8.
Change from last year
Modified guidance
Rationale
This question gathers data on biogenic carbon that is not included in your Scope 1 and Scope 2 figures. This information provides context to data users on the extent of your biogenic carbon fluxes and on the neutrality of you CO2 emissions.
Response options
Please complete the following table:
| Type of change
|
Emissions (metric tons CO2)
|
Methodology
|
Please explain
|
|
CO2 emissions from land use management
|
Numerical field [enter a number from 0-99,999,999,999 using a maximum of 3 decimal places]
|
Select all that apply:
- Default emissions factors
- Region-specific emissions factors
- Empirical models
- Process-based models
- Field measurements
- Other, please specify
|
Text field [maximum
2,400 characters]
|
|
CO2 removals from land use management
|
|
|
|
|
Sequestration during land use change
|
|
|
|
|
CO2 emissions from biofuel combustion (land machinery)
|
|
|
|
|
CO2 emissions from biofuel combustion (processing/manufacturing machinery)
|
|
|
|
| CO2 emissions from biofuel combustion (other)
|
|
|
|
Requested content
General
- The biogenic carbon data requested here is linked to those business activities you indicated as relevant in C-AC0.6/C-FB0.6/C-PF0.6, e.g. if you selected "Own land only" or "Both own land and elsewhere in the value chain" for row "Agriculture/Forestry", you will be asked to report biogenic data on "CO2 emissions from land use management". Note that if you selected "Both own land/direct operations and elsewhere in the value chain" for an activity, you should only report biogenic data associated with your own operations.
- The GHG Protocol is developing new Land Sector and Removals Guidance. This new guidance is currently in the pilot testing and review phase, and will be finalized and published in 2023. Companies responding to the CDP 2023 climate change questionnaire should report in accordance with existing GHG Protocol corporate standards, and not use the draft land sector and removals guidance for CDP reporting in 2023, as it is still under development.
Type of change (column 1)
- "CO2 emissions/removals from land use management", "sequestration" and "CO2 emissions from biofuel combustion (land machinery)" only appear in the case you indicated that agricultural/forestry activities are relevant to your organization.
- "CO2 emissions from biofuel combustion (processing/manufacturing machinery)" only appears if you indicated that processing/manufacturing activities are relevant to your organization.
- "CO2 emissions from biofuel combustion (other)" only appears if you indicated that distribution activities are relevant to your organization.
Emissions (metric tons CO2) (column 2)
- Provide a figure in metric tons that is representative of the "type of change" indicated in column 1 within your direct operations.
Methodology (column 3)
- Select the option(s) that best describe the methods used to calculate your emissions figure reported in column 3 (Emissions…).
- You should consider the following:
- Default emissions factors: involve the multiplication of activity data by an international default emissions factor.
- Region-specific emissions factors: involve the multiplication of activity data by an emissions factor specific to the region.
- Empirical models: involve using field measurements to develop statistical relationships between GHG data and activity-specific factors.
- Process-based models: involve mathematically linking biogeochemical processes that control the production, consumption, and emission of GHGs.
- If none of the options are applicable to your organization, select "Other, please specify" and indicate the methodology you used to calculate the emissions figure in column 2.
Please explain (column 4)
- Specify and describe the methodology and tools used to calculate your biogenic carbon figure reported in column 2 (Emissions…), including your assumptions.
- If applicable, specify the sources of the biofuel used.
- Specify and explain any exclusions.
Additional information
Other emissions data: agricultural commodities
(C-AC6.9/C-FB6.9/C-PF6.9) Do you collect or calculate greenhouse gas emissions for each commodity reported as significant to your business in C-AC0.7/C-FB0.7/C-PF0.7?
Question dependencies
This question only appears if you responded to C-AC0.7/FB0.7/PF0.7.
Change from last year
Modified question
Rationale
In question C-AC0.7/FB0.7/PF0.7, you disclosed the agricultural commodities on which your business is most reliant. These commodities were listed because of their dependency on natural capital and its associated ecosystem services under threat by climate change and/or their association with large CO2e emissions. This question gathers information on whether your organization collects and/or calculates greenhouse gas (GHG) emissions data on these commodities. This information provides further context to data users about the magnitude of the climate-related risks associated with your business.
Response options
Please complete the following table. You are able to add rows by using the “Add Row” button at the bottom of the table.
| 1
|
2
|
3
|
4
|
5
|
6
|
7
|
8
|
| Agricultural commodities
|
Do you collect or calculate GHG emissions for this commodity?
|
Reporting emissions by*
|
Emissions (metric tons CO2e)*
|
Denominator: unit of production*
|
Change from last reporting year*
|
Please explain*
|
Explain why you do not calculate GHG emission for this commodity and your plans to do so in the future*
|
|
Select from:
List created with commodities selected in C-AC0.7/C-FB0.7/C-PF0.7.
|
Select from:
- Yes
- No
|
Select from:
|
Numerical field [enter a number from 0-999,999,999,999 using a maximum of 10 decimal places]
|
Select from:
- Kilograms
- Liters
- Metric tons
- Unit of product
- Unit of revenue
- Other, please specify
|
Select from:
- This is our first year of measurement
- Much lower
- Lower
- About the same
- Higher
- Much higher
|
Text field [maximum 2,000 characters]
|
Text field [maximum 2,000 characters]
|
[Add Row]
Requested content
General
- Organizations are encouraged to collect/calculate GHG emissions data for all commodities specified as highly relevant to their business.
Agricultural commodities (column 1)
- Note that only those commodities that you specified in C-AC0.7/FB0.7/PF0.7 will appear in the list. If you collect/calculate data for a commodity that is not listed here, you should modify your response to C-AC0.7/FB0.7/PF0.7 by adding a new row for the additional commodity.
Reporting emissions by (column 3)
- This column is only presented if you select “Yes” in column 2.
- Organizations are encouraged to report the commodity associated emissions per unit of production, e.g. CO2e/kg of product. However, if you are unable to provide this, you may report your emissions as an absolute figure by selecting “Total”.
Emissions (metric tons CO2e) (column 4)
- This column is only presented if you select “Yes” in column 2.
- This figure should be representative of your reporting year, boundaries for data collection/calculation as indicated in column 3 of C-AC6.9/C-FB6.9/C-PF6.9, and expressed in metric tons.
Denominator: unit of production (column 5)
- This column will appear only if you select “Unit of production” in column 3.
- If none of the options are applicable for your organization, select “Other, please specify” and provide the unit of production applicable to your calculations.
Change from last reporting year (column 6)
- This column is only presented if you select “Yes” in column 2.
Please explain (column 7)
- This column is only presented if you select “Yes” in column 2.
- If you selected "Yes" specify the boundaries used for data collection/calculation, e.g. company-wide, direct operations, supply chain or only selected facilities.
- Specify any exclusions in the case your reported figure does not cover your entire boundary for data collection/calculation. In this, provide an explanation as to why you have excluded certain parts of your business.
- Provide details on the methods/tools and assumptions used to calculate your figure reported in column 4.
Explain why you do not calculate GHG emission for this commodity and your plans to do so in the future (column 8)
- This column is only presented if you select either “No” option in column 2.
- If you selected "No, not currently but intend to collect or calculate this data within the next two years", detail your plans, by including:
- Coverage of data collection/calculation, e.g. company-wide, supply chain or only selected facilities.
- Timeframe for starting to collect/calculate this information.
- Methods/tools you plan to use.
- If you selected "No", specify your main reason for not collecting/calculating this data and provide an explanation.
Additional information
The following tools can be used for calculating commodity-specific agricultural emissions:
For an overview of the available resources (i.e. standards, methodologies, tools, and calculators) for assessing emissions from agricultural production and agriculturally-driven land use change, please refer to: Measure the Chain: Tools for Assessing GHG Emissions in Agricultural Supply Chains.
Emissions intensities
(C6.10) Describe your gross global combined Scope 1 and 2 emissions for the reporting year in metric tons CO2e per unit currency total revenue and provide any additional intensity metrics that are appropriate to your business operations.
Change from last year
Modified question
Rationale
Intensity measures describe an organization’s CO2e emissions in the context of another business metric. In this way, the emissions are normalized to account for growth etc. Many companies and investors have historically tracked environmental performance with intensity ratios.
Ambition: Companies disclose that intensity metrics covering their gross global Scope 1 and 2 emissions have decreased in the reporting year.
Connection to other frameworks
SDG
Goal 13: Climate action
S&P Global Corporate Sustainability Assessment
TCFD Disclosure
Response options
Please complete the following table. It is requested that you first report your emissions intensity figure per unit of currency total revenue. You are able to add rows by using the “Add Row” button at the bottom of the table.
| Intensity figure
|
Metric numerator (Gross global combined Scope 1 and 2 emissions, metric tons CO2e)
|
Metric denominator
|
Metric denominator: Unit total
|
Scope 2 figure used
|
% change from previous year
|
Direction of change
|
Reason(s) for change
|
Please explain
|
|
Numerical field [enter
a number from 0- 999,999,999,999,999 using a
maximum of 10 decimal places and no commas]
|
Numerical field [enter a number from 0-999,999,999,999,999 using a maximum of 2 decimal places and no commas]
|
Select from:
- unit total revenue
- barrel of oil equivalent (BOE)
- billion (currency) funds under management
- full time equivalent (FTE) employee
- kilometer
- liter of product
- megawatt hour generated (MWh)
- megawatt hour transmitted (MWh)
- metric ton of product
- ounce of gold
- ounce of platinum
- passenger kilometer
- room night produced
- square foot
- square meter
- metric ton of aggregate
- metric ton of aluminum
- metric ton of coal
- metric ton of ore processed
- metric ton of steel
- unit hour worked
- unit of production
- unit of service provided
- vehicle produced
- Other, please specify
|
Numerical field [enter a number from 0-999,999,999,999,999 using a maximum of 2 decimal places and no commas]
|
Select from:
- Location-based
- Market-based
|
Numerical field [enter
a number from 0-999 using a maximum of 2 decimal places]
|
Select from:
- Increased
- Decreased
- No change
|
Select all that apply:
- Change in renewable energy consumption
- Other emissions reduction activities
- Divestment
- Acquisitions
- Mergers
- Change in output
- Change in revenue
- Change in methodology
- Change in boundary
- Change in physical operating conditions
- Unidentified
- Other, please specify
|
Text field [maximum 2,400 characters]
|
[Add Row]
Requested content
General
- It is requested that you first report your emissions intensity figure per unit of currency total revenue and if applicable provide any additional intensity metrics that are appropriate to your business operations. The currency reported here should be the same one selected in C0.4. Emissions intensity per unit of revenue is one the most common and easy means to calculate emissions intensity, which is why it is requested that you provide this figure. However, this is not necessarily always the most appropriate to individual businesses and therefore you can also report an additional intensity or normalized metric that is most appropriate to your organization’s own operations.
- If you are a privately held organization, you may report whichever intensity is relevant for you. Please note that per unit of revenue is the preferred disclosure.
- If you did not disclose to CDP last year, or did not use this data point, please use last year’s inventory and financial data to provide a calculation of percentage change. If you did not measure your emissions last year, complete column 1 and explain why you do not have the data available in column 9.
- If your change in emissions intensity is attributed to a decline or an increase in your business output (products or services) due to the COVID-19 pandemic, please select "Change in output" in column 8 "Reason for change" and provide further details of how your output was affected in the "Please explain" column.
Intensity figure (column 1)
- Intensity ratios express GHG impact per unit of physical activity or unit of economic output.
- Your intensity figure per unit of currency total revenue is calculated by dividing total Scope 1 and 2 emissions by unit revenue, making sure that the revenue figure used applies to the same organizational boundary as your emissions data.
- Important points to remember when calculating intensity are:
- Intensity = Emissions (metric tons CO2e) (Numerator) / Business metric (e.g. revenue) (Denominator)
- Numerator units: the intensity metrics requested in question C6.10 should have emissions in metric tons CO2e as the numerator. They should include Scope 1 and Scope 2 emissions combined. This figure can be obtained by summing the figures given in answer to questions C6.1 and C6.3.
- Denominator units: When calculating your intensity, you should ensure that the units of your data match those specified in the intensity metric. For example, question C6.10 requests for intensity in metric tons CO2e per unit currency revenue. This means that your revenue figure (the denominator) should be in the currency you specified in C0.4 and in single units, i.e. if your revenue is 5 Million US$ your unit revenue is 5000000. Another example would be metric tons CO2e per MWh – if your data is in kWh you must convert it to MWh before using it in the calculation.
- Boundary and Exclusions: You should ensure that the organizational boundary and any exclusions specified for your numerator is the same as for your denominator. For example, when entering your emissions per FTE employee you should ensure that you only include those FTE employees that are within the sections of the organization covered by the organizational boundary of your emissions and take into account any exclusions (as specified in question C6.4a).
Metric numerator (column 2)
- This column is fixed and specifies that the emissions should be in metric tons CO2e, derived from your gross global Scope 1 emissions figure (question C6.1) plus your gross global Scope 2 emissions figure (question C6.3).
Metric denominator (column 3)
- To report your organization’s emissions intensity per unit currency total revenue, select "unit total revenue" in column 3 (metric denominator) for this figure.
- Please note that the denominator in the selection “unit total revenue” is per single unit (1) of the currency specified in question C0.4. Please do not report your revenue emissions intensity based on multiples of your selected currency (e.g. do not report in multiples of Yen). It is understood that this will likely result in your intensity figure being quite small (less than 0.01).
- If you select “Other, please specify”, provide a label for the Metric denominator.
Metric denominator: Unit total (column 4)
- Ensure that the metric denominator figure provided in this column is the same unit that was chosen in column 3.
- For example, if your chosen metric in the previous column was FTE, you should input here how many FTE you had during the reporting year.
Scope 2 figure used (column 5)
- Indicate which Scope 2 figure has been used in your metric numerator.
% change from previous year (column 6)
- If you have experienced no change, please enter 0 (zero) in this column.
- If the previous year’s figure has been reported but recalculated since, please use the recalculated figure for the calculation of percentage change and note this in the last column (8). The previous year compared should apply to the 12-month period directly prior to the reporting period, even if it does not completely overlap with the period previously reported to CDP.
Direction of change (column 7)
- A declining intensity ratio reflects a positive performance (improvement), while an increasing intensity ratio reflects a negative performance (decline).
- If the percentage change from last year is 0 (zero) select "No change".
Reason(s) for change (column 8).
- Further details on each of the options are provided below:
- Change in renewable energy consumption – a change in your organization's emissions intensity due to any consumption of self-generated or purchased renewable energy that was additional in the reporting year. Note that if your emissions intensity has changed due to changing Scope 2 accounting method (i.e., from Scope 2 location-based to Scope 2 market-based or vice versa), you should not select this option, but select “Change in methodology” (see below).
- Other emissions reduction activities – a change in your organization’s emissions intensity because of proactive emissions reduction initiatives or activities, for example those listed in question C4.3b, other than those caused by a change in renewable energy consumption.
- Divestment – a change that occurred due to selling off certain aspects of the businesses.
- Acquisitions – a change that occurred due to purchasing or obtaining another company/subsidiary/facility.
- Mergers – a change that occurred due to business mergers.
- Change in output – a change that occurred as a result of changes (increases or decreases) in your business output (i.e. a product or service); this could be, for example, organic growth, purchase of additional facilities due to business expansion, declines in sales due to a global recession, or release of a new product.
- Change in revenue – a change that occurred due to changes (increases or decreases) in your organization’s revenue (irrespective of business output); this could be, for example, due to an increase in price of products or services sold.
- Change in methodology – a change that occurred due to modifications in the way that the inventory is calculated, for example, changes in emissions factors used or changes in methodology protocol followed. If your Scope 1+2 emissions intensity has changed as a result a change in Scope 2 accounting practices for low-carbon energy, you should select this option.
- Change in boundary – a change in your organization’s emissions intensity due to a change in the boundary used for your inventory calculation, i.e. changing from financial control to operational control. This option could also apply if you have incorporated facilities into your inventory that were excluded in previous years.
- Change in physical operating conditions – a change that occurred due to changes in the weather that cannot be accounted for under the other options available, e.g. increased production of hydroelectricity because of increased rainfall.
- Unidentified – select this option if you are not able to identify the reason for the change in your Scope 1+2 emissions intensity from the previous year.
Please explain (column 9)
- Expand on the reason(s) selected in column 8, providing regional, sectoral and/or operational context.
- Explain the degree to which different factors influenced the change in your intensity figure.
- If you selected “Other emissions reduction initiatives” in column 8, specify the initiatives that contributed to the change, including those reported in C4.3b.
- You may also use this column to provide any additional explanation that is relevant to capture the full complexity of the emissions intensity change.
Note for coal sector companies:
- Coal sector companies are requested to provide an emissions intensity figure per unit of currency total revenue and in addition, per metric ton of coal.
Note for electric utility sector companies:
- Electric utility sector organizations are requested to provide an emissions intensity figure per unit of currency total revenue and in addition, report your organization’s gross global combined Scope 1 and 2 emissions intensity per MWh of gross power generated and/or per MWh of power transmitted – make sure to select megawatt hour generated (MWh) and/or megawatt hour transmitted (MWh).
Note for oil and gas sector companies:
- Oil and gas sector organizations are requested to provide an emissions intensity figure per unit of currency total revenue.
- Please note that question C-OG6.12 asks oil and gas organizations to provide the intensity figures for Scope 1 emissions (metric tons CO2e) per unit of hydrocarbon category.
Note for transport OEMs and transport services sector companies:
- Transport OEMs and transport services sector organizations are requested to provide an emissions intensity figure per unit of currency total revenue.
- Please note that, dependent on the extent you are able to disaggregate your emissions intensity for each transport mode between Scopes 1, 2, and 3: Category 4 upstream transportation and distribution, transport services organizations are asked to provide primary intensity (activity-based) metrics that are appropriate to emissions from transport activities in Scope 1, 2, and 3 in question C-TS6.15.
Note for real estate sector companies:
- In addition to reporting emissions intensity figure per unit of currency total revenue, real estate companies should consider reporting emissions intensity by occupants or square area.
Note for capital goods sector companies:
- In addition to reporting an emissions intensity figure per unit of currency total revenue, capital goods companies should consider reporting emissions intensity by unit of production or unit of service provided.
- If you measure the emissions intensity of specific products or product ranges, you will have the opportunity to provide this information in questions C-CG8.5 and C-CG8.5a.
Explanation of terms
- Intensity metrics: Intensity metrics describe an organization’s CO2e emissions in the context of another business metric. In this way, the emissions are normalized to account for growth. Intensity is calculated by dividing the CO2e emissions figure (the numerator) by an alternative business metric (the denominator), such as the number of full-time equivalent employees, the revenue or tons of aggregate produced.
- Revenue: Income arising in the
course of an entity’s ordinary activities (less returns, allowances and
discounts) - before deducting costs for the goods/services sold and operating
expenses to arrive at profit (based on the
International Financial Reporting Standard).
Example response
Worked example of calculating emissions intensities figures
A reporting organization has gross total combined Scope 1 and 2 emissions of 300,000 metric tons CO2e, revenue of 5 Million US$ and 3,000 FTE employees. In this case, the company could calculate and report its emission intensity figures by revenue and by FTE as follows:
1. Emissions intensity in metric tons CO2e per unit currency total revenue
Intensity = 300,000 (metric tons CO2e)/5,000,000 (US$)= 0.06
2. Emissions intensity in metric tons CO2e per FTE employee
Intensity = 300,000 (metric tons CO2e)/3,000 (FTE employee)= 100
| Intensity figure
|
Metric numerator (Gross global combined Scope 1 and 2 emissions)
|
Metric denominator
|
Metric denominator: Unit total
|
Scope 2 figure used
|
% change from previous year
|
Direction of change
|
Reason(s) for change
|
Please explain
|
| 0.06
|
300,000
|
unit total revenue
|
5,000,000
|
Market-based
|
3
|
Decreased
|
Change in renewable energy consumption
|
We have been making progress on our initiative to increase our renewable energy consumption. Our additional renewable electricity procurement directly from an off-site wind farm has increased our share of RE by 10% this year, leading to a decrease in emissions intensity. We have reported details of this initiative in C4.3b.
|
| 100
|
300,000
|
full time equivalent (FTE)
|
3,000
|
Market-based
|
4
|
Decreased
|
Other emissions reduction activities
|
In addition to reducing our emissions by shifting to electric vehicles we have hired more full time employees in the reporting year. We have an ongoing initiative to shift our company fleet to electric vehicles which we have detailed in C4.3b.
|
C7 Emissions breakdown
Module Overview
This module enables respondents to break down Scope 1 and Scope 2 emissions by country, business division, facility and sector.
By breaking down emissions by country or region, this data can be made available to regions, states and sub-national bodies to help guide the development of emissions-related legislation.
Breaking down emissions by business division, facility and activity grants data users and investors transparency into the sources of a company's Scope 1 and 2 emissions and allows tracking the performance of divisions and individual facilities over time.
The module also requests data on emissions other than carbon dioxide. These gases are often only reported in CO2-equivalents (CO2e), and so their contribution to overall emissions is sometimes masked.
Key changes
- New questions:
- C7.7 asks whether you include emissions data for subsidiaries in your CDP response.
- C7.7a requests a breakdown of Scope 1 and 2 emissions by subsidiary.
For the agricultural commodities, food/beverage/tobacco and paper/forestry sectors only:
- Modified guidance:
- C-CE7.4/C-CH7.4/C-CO7.4/C-EU7.4/C-MM7.4/C-OG7.4/C-ST7.4/C-TO7.4/C-TS7.4 – additional information on the use of biogas certificates for scope 1 reporting has been updated.
- C-AC7.4a/C-FB7.4a/C-PF7.4a – clarification that companies should not be using the draft GHG Protocol land sector and removals guidance for their 2023 CDP response.
- C-AC7.4b/C-FB7.4b/C-PF7.4b – clarification that companies should not be using the draft GHG Protocol land sector and removals guidance for their 2023 CDP response.
Click here for a list of all changes made this year.
Sector-specific content
Additional questions on emission breakdowns for the following high-impact sectors:
- Agricultural commodities
- Capital goods
- Cement
- Chemicals
- Coal
- Electric utilities
- Food, beverage & tobacco
- Metals & mining
- Oil & gas
- Paper and forestry
- Steel
- Transport original equipment manufacturers (OEMs)
- Transport services
Pathway diagram - questions
This diagram shows the general questions contained in module C7. To access question-level guidance, use the menu on the left to navigate to the question.
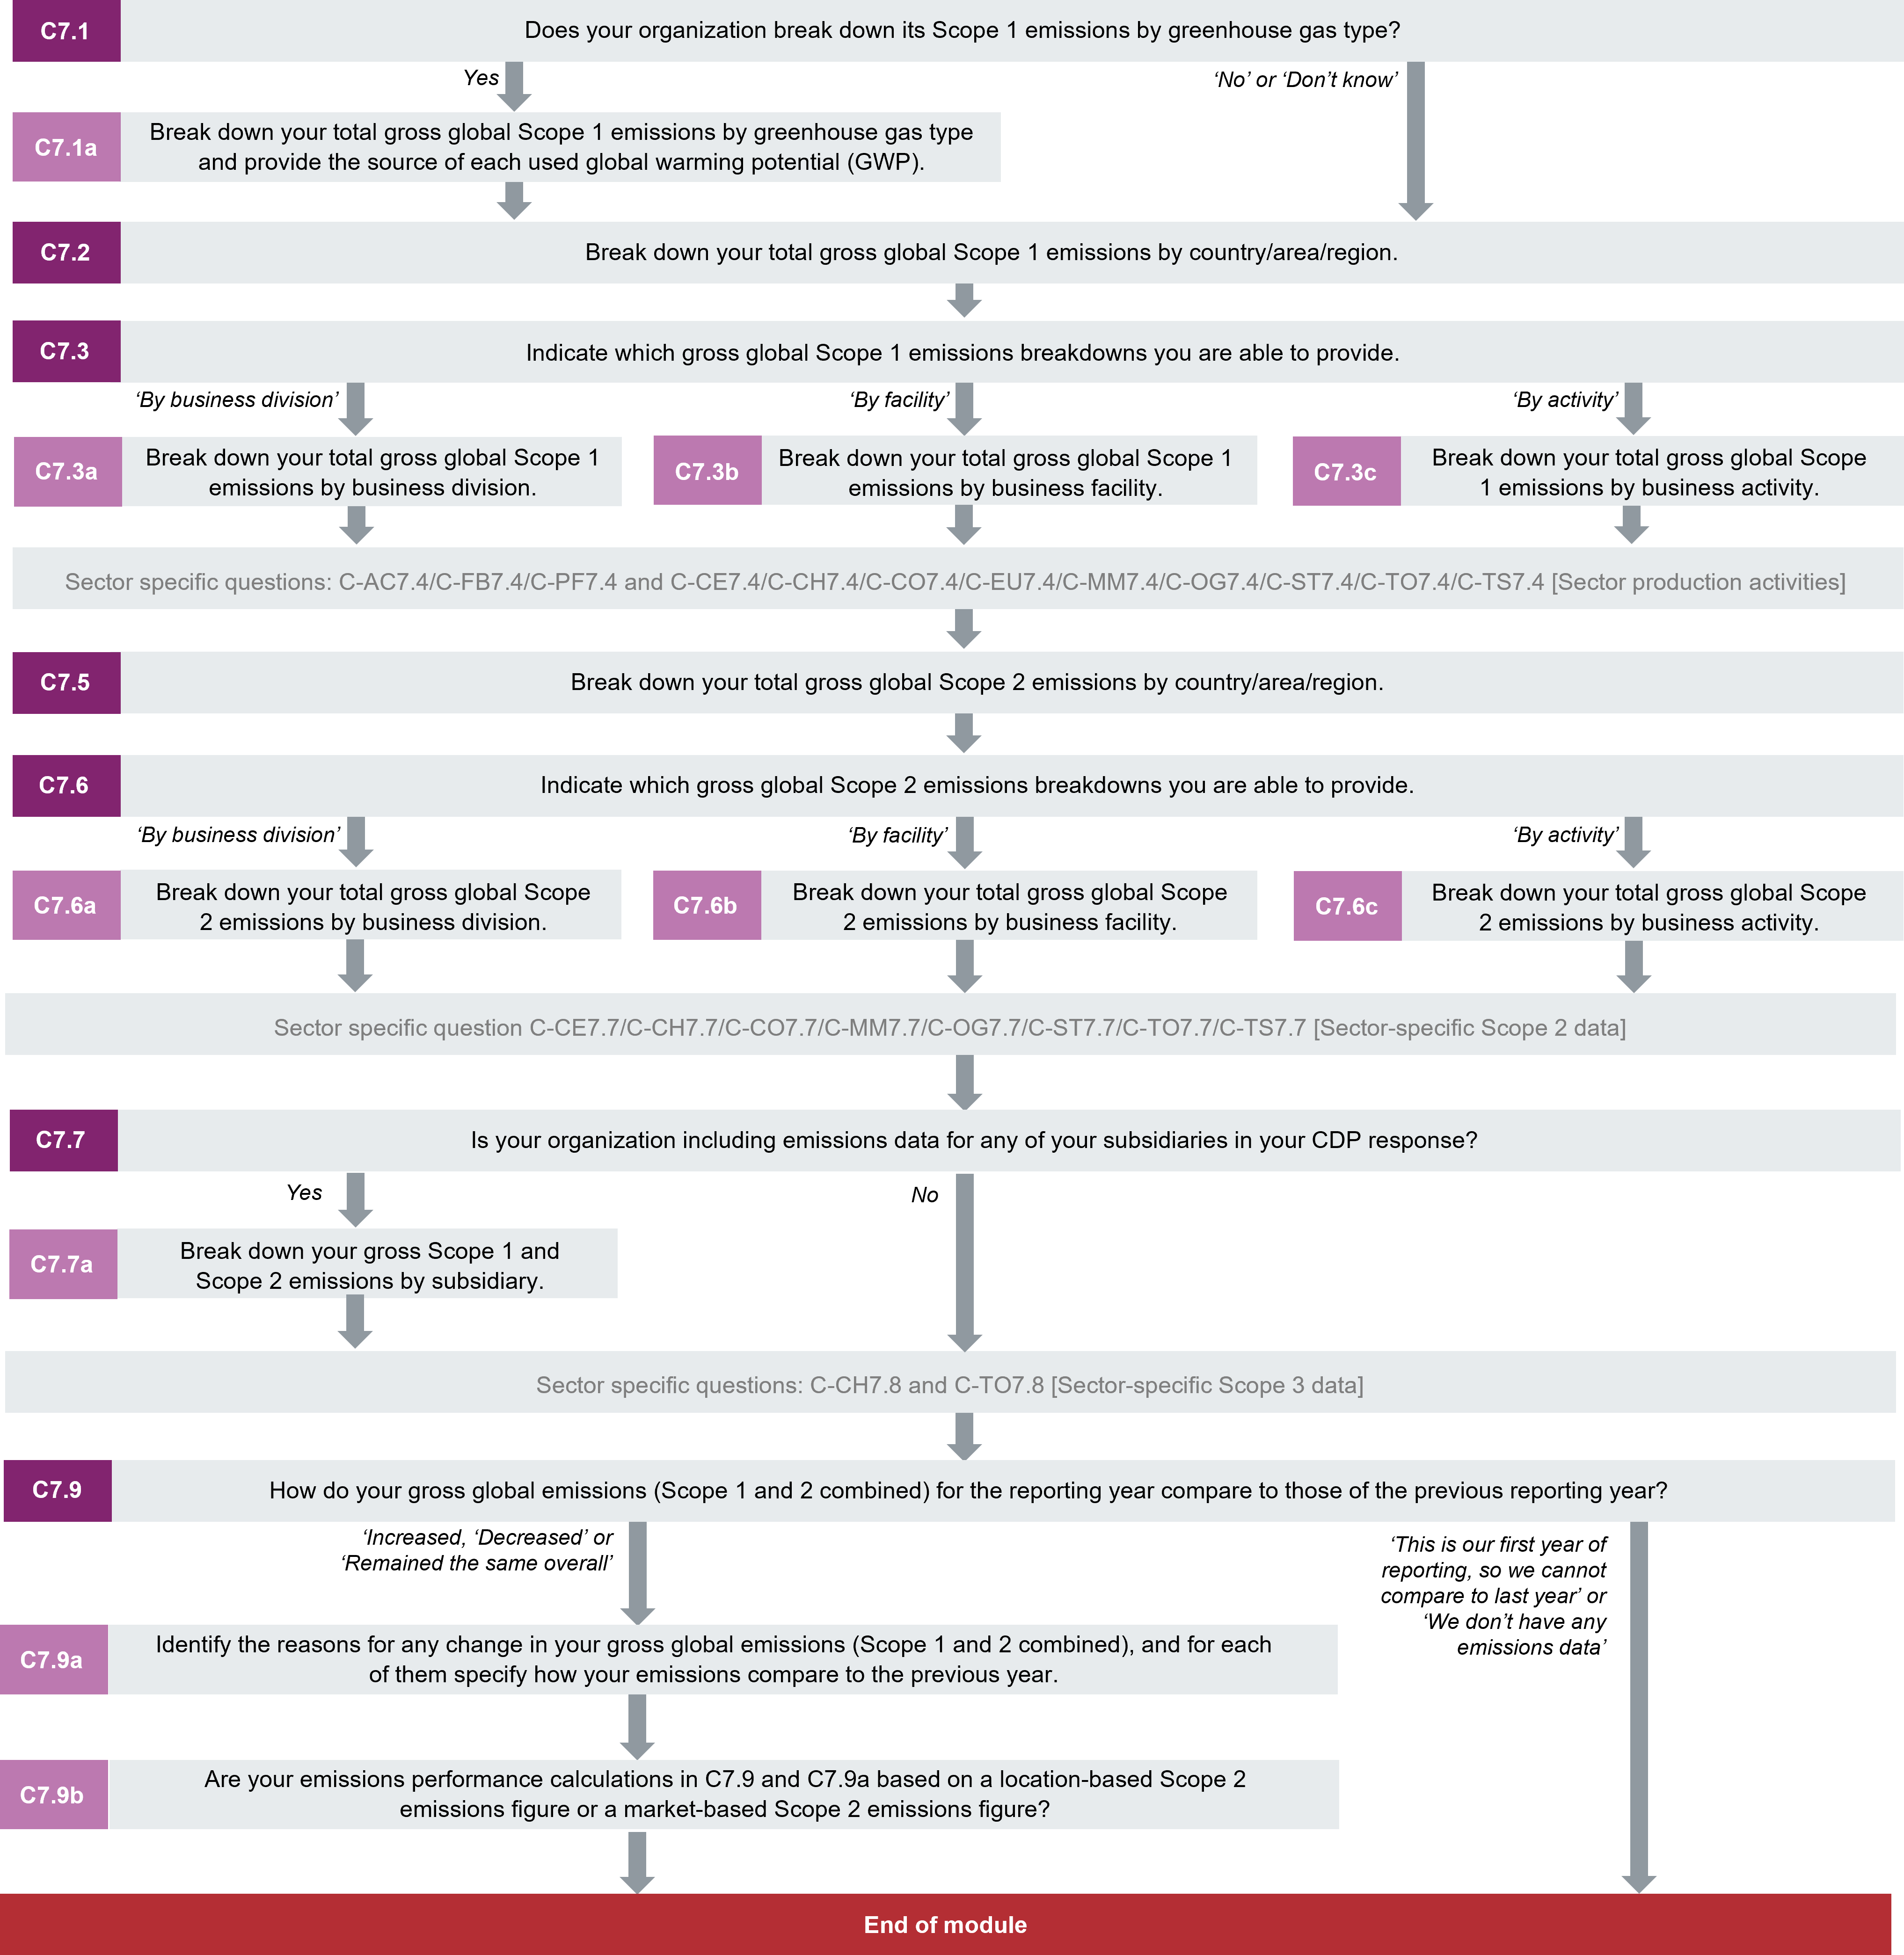
Scope 1 breakdown: GHGs
(C7.1) Does your organization break down its Scope 1 emissions by greenhouse gas type?
Change from last year
No change
Rationale
For many sectors and business activities, greenhouse gases other than carbon dioxide are significant and relevant. Since these gases are often only reported in CO2-equivalents (CO2e), their contribution to overall emissions is sometimes masked. CDP therefore requests companies to break down their gross Scope 1 emissions by GHG type.
Response options
Select one of the following options:
Requested content
General
- Select “Yes” if your organization’s gross Scope 1 emissions inventory contains greenhouse gases other than carbon dioxide; for example, any of the other five greenhouse gases covered by the Kyoto Protocol (methane, nitrous oxide, hydrofluorocarbons, perfluorocarbons, and sulfur hexafluoride).
Additional information
(C7.1a) Break down your total gross global Scope 1 emissions by greenhouse gas type and provide the source of each used global warming potential (GWP).
Question dependencies
This question only appears if you select “Yes” in response to C7.1.
Change from last year
No change
Rationale
For many sectors and business activities, greenhouse gases other than carbon dioxide are significant and relevant. Since these gases are often only reported in CO2-equivalents (CO2e), their contribution to overall emissions is sometimes masked. CDP therefore requests companies to break down their gross Scope 1 emissions by GHG type.
Connection to other frameworks
S&P Global Corporate Sustainability Assessment
Methane Emissions
Perfluorocarbons Emissions
SF6 Emissions
Response options
Please complete the following table. You are able to add rows by using the “Add Row” button at the bottom of the table.
| Greenhouse gas
|
Scope 1 emissions (metric tons in CO2e)
|
GWP Reference
|
|
Select from:
- CO2
- CH4
- N2O
- HFCs
- PFCs
- SF6
- NF3
- Other, please specify
|
Numerical field [enter a range of 0-999,999,999,999 using a maximum of 3 decimal places and no commas]
|
Select from:
- IPCC Sixth Assessment Report (AR6 – 100 year)
- IPCC Fifth Assessment Report (AR5 – 100 year)
- IPCC Fourth Assessment Report (AR4 - 100 year)
- IPCC Third Assessment Report (TAR - 100 year)
- IPCC Second Assessment Report (SAR - 100 year)
- IPCC Fourth Assessment Report (AR4 - 50 year)
- IPCC Third Assessment Report (TAR - 50 year)
- IPCC Second Assessment Report (SAR - 50 year)
- IPCC Sixth Assessment Report (AR6 – 20 year)
- IPCC Fifth Assessment Report (AR5 – 20 year)
- IPCC Fourth Assessment Report (AR4 - 20 year)
- IPCC Third Assessment Report (TAR - 20 year)
- IPCC Second Assessment Report (SAR - 20 year)
- Other, please specify
|
[Add Row]
Requested content
General
- Please report your organization’s emissions of the Kyoto greenhouse gases, which are:
- Carbon dioxide (CO2);
- Methane (CH4);
- Nitrous oxide (N2O);
- Hydrofluorocarbon family of gases (HFCs);
- Perfluorocarbon family of gases (PFCs);
- Sulfur hexafluoride (SF6).
- Nitrogen trifluoride (NF3) has been included in the basket of mandated GHGs as it is now considered a potent contributor to climate change and is therefore mandated to be included in national inventories under the United Nations Framework Convention on Climate Change (UNFCCC). Similarly, following an amendment issued by the Greenhouse Gas Protocol on May 2013, NF3 should also be included in GHG inventories under the Corporate Standard and the Corporate Value Chain (Scope 3) Standard.
- The total value for emissions reported in column 2, Scope 1 emissions (metric tons of CO2e), should equal the value for gross global Scope 1 emissions reported in C6.1.
- If using global warming potentials from the IPCC Sixth Assessment Report (AR6 – 100 year or AR6 – 20 year) to calculate your Scope 1 emissions CO2e from CH4, you should first calculate the CO2e emissions from fossil CH4 and non-fossil CH4 separately using the relevant GWP, then sum these figures to provide in column 2 the total Scope 1 CO2e emissions from both fossil and non-fossil CH4.
Greenhouse gas (column 1)
- You can add rows for multiple greenhouse gas types and we request that you also add a row to report CO2.
Scope 1 emissions (metric tons of CO2e) (column 2)
- Report your organization’s emissions of the greenhouse gas selected in column 1, in CO2-equivalents (CO2e)
GWP Reference (column 3)
- Identify the global warming potential your organization has applied to the selected greenhouse gas in order to standardize it to a carbon dioxide equivalent (CO2e). Your gross Scope 1 emissions are reported in carbon dioxide equivalents in C6.1. If you have used a calculation tool and do not know which GWPs have been applied to your data, consult the tool documentation or reference sources.
- If you select “Other, please specify”, provide a label for the GWP Reference.
Explanation of terms
- Global warming potential (GWP): The Intergovernmental Panel on Climate Change (IPCC)’s Sixth Assessment Report (AR6) defines the Global Warming Potential (GWP) as “an index measuring the radiative forcing following an emission of a unit mass of a given substance, accumulated over a chosen time horizon, relative to that of the reference substance, carbon dioxide (CO2). The GWP thus represents the combined effect of the differing times these substances remain in the atmosphere and their effectiveness in causing radiative forcing.” By using GWPs, GHG emissions from multiple gases can be standardized to a carbon dioxide equivalent (CO2e).
Additional information
- Changes in Global Warming Potentials (GWPs): Estimates of GWPs have changed over time as scientific understanding has developed. GWP factors are reassessed every few years in the IPCC Assessment Reports and accordingly, CDP recommends that companies use the latest GWPs given in the IPCC’s Sixth Assessment Report (AR6). This approach is aligned with the GHG Protocol Corporate and Accounting Reporting Standard, which states that the company “shall use 100-year GWP values from the IPCC and should use GWP values from the most recent Assessment Report, but may choose to use other IPCC Assessment Reports.”
Scope 1 breakdown: country/area/region
(C7.2) Break down your total gross global Scope 1 emissions by country/area/region.
Change from last year
Minor change
Rationale
By breaking down emissions to country/area or regional level, information and data can be made available to regions, states and sub-national bodies to help guide the development of emissions-related legislation.
Connection to other frameworks
SDG
Goal 12: Responsible consumption and production
Goal 13: Climate action
Response options
Please complete the following table. You are able to add rows by using the “Add Row” button at the bottom of the table.
| Country/area/region
|
Scope 1 emissions (metric tons CO2e)
|
|
Select from a drop-down list of countries, areas and regions. Please see the Technical Note “Country, Areas and Regions” for details around the available regions and their constituent countries/areas.
|
Numerical field [enter a number from 0-999,999,999,999 using a maximum of 3 decimal places and no commas]
|
[Add Row]
Requested content
General
- Breaking down emissions to the country/area level is useful to investors as this is often the level at which emissions-related legislation is introduced. Emissions should be attributed to individual countries/areas wherever possible. CDP considers reporting emissions broken down by country/area best practice.
- Where states (or other sub-national entities) have the right to introduce emissions-related legislation, companies operating in these states (or other sub-national entities) may consider that breaking down emissions to a sub-national level is more informative. To provide this breakdown, select “Other: please specify” and provide a label for the sub-national entity.
- Where emissions are sufficiently low, or for parts of your business where your inventory does not allow for a country/area level of granularity, use the available region options. Please see CDP's Technical Note "Countries, Areas and Regions" for details around the available regions and their constituent countries/areas.
- If you disclose the value for a region that overlaps with a country/area you are also disclosing, you should report the value for the region minus the emissions of that country/area. If all emissions breakdowns are added, they should add to your Scope 1 total.
- Due to the difficulties of delineating Asia, CDP has not provided a single "Asia" category. Companies may choose either Asia Middle East (AME) or Asia Pacific (JAPA). Please see the Technical Note “Countries, Areas and Regions” for more information.
Country/area/region (column 1)
Scope 1 emissions (metric tons CO2e) (column 2)
- Report your organization’s greenhouse gas emissions in CO2-equivalent for the country/area/region selected in column 1.
- Negative numbers are not allowed as organizations are to report gross, not net figures.
- Emissions figures should be for the reporting year only (as defined by your answer to C0.2).
Scope 1 breakdown: business breakdown
(C7.3) Indicate which gross global Scope 1 emissions breakdowns you are able to provide.
Change from last year
No change
Rationale
By requesting companies to break down emissions by business division, facility, and activity, CDP grants data users and investors transparency into the sources of a company's Scope 1 emissions.
Response options
Select all that apply from the following options:
- By business division
- By facility
- By activity
Requested content
General
- You should identify breakdowns that are relevant to your business/sector, and as such those that investors would find interesting.
- Identify the category of emissions that are relevant by ticking the boxes provided in the ORS adjacent to each of the three options.
- By business division
- This breakdown can give an indication of the relative GHG performance of your company’s divisions. When reported over time, your company and information users will be able to review improvements or declines in division performance. This breakdown can be used alongside revenue segments found in company annual filings to understand companies’ emissions profiles in greater detail. To facilitate this process, it is recommended that companies match the divisions reported here with those found in company filings and financial statements.
- The GHG Protocol stationary combustion tool document states that a “facility includes all buildings, equipment, structures and other stationary items which are located on a single site or on contiguous or adjacent sites and which are owned or operated by the same person or entity (or by any person or entity which controls, is controlled by or is under common control, with such person or entity)”.
- Facilities may also be referred to as installations. More than one business activity may take place at a facility and a facility may include more than one combustion unit, such as a boiler. It is preferable that the facility type is included. Some examples of facility type are: gas works, refinery, coal mine, integrated steelworks, cement plant, and office buildings.
- Reporting at this level can provide a useful indicator for making comparisons between facilities. In some cases, individual facilities may come within the scope of particular legislation, requiring baselining and subsequent reduction of GHG emissions through improvements in energy efficiency. This is particularly the case for industrial plants. Therefore, providing facility-level emission figures may give data users insight into your organization’s current/potential exposure to regulation in this area.
- Relevant activities are defined by the reporting company and could include stationary combustion, mobile combustion (transport), fugitive emissions, process activities, office activities, etc. These activities can take place over multiple business divisions, countries, or facilities. Reporting by activity allows a more in-depth understanding of business risk related to future regulation. To facilitate comparability of data between companies, you are asked to report a breakdown of your activities using language that would be clear to someone outside of your organization and avoid using company-specific terminology. Furthermore, the level of aggregation of activities should be set so that it is meaningful to investors or customers viewing your response. Each activity should be broken down to a level granular enough to provide a data user with a relevant and complete understanding of your company’s activities and how these contribute to your emissions profile. Each activity should be broken down to a level sufficient for understanding the complete activity emissions profile and where further disaggregation would not add value for data users to understand the associated GHG emissions.
- Integrated companies should attempt, where possible, to provide a breakdown of emissions associated with each stage of their owned value chain.
- Companies that generate their own electricity should include it here as a separate activity, preferably with separation by fuel type.
- Companies involved in extracting and/or processing/refining natural resources should consider reporting these activities separately for each product type.
Note for organizations responding to high-impact sector requests
- If you select “By activity”, you will be presented with question C7.3c. If your company’s primary CDP sector is one of the following: AC, FB, PF, CE, CH, CO, EU, MM, OG, ST, TO, or TS the response to C7.3c is not required. Organizations responding to these sector requests are presented with additional questions on this topic (C-CE7.4/C-CH7.4/C-CO7.4/C-EU7.4/C-MM7.4/C-OG7.4/C-ST7.4/C-TO7.4/C-TS7.4; C-AC7.4/C-FB7.4/C-PF7.4, C-MM9.3a, C-MM9.3b, C-CO7.1b, C-EU7.1b, C-OG7.1b) relating specifically to activities in the sector. Your primary CDP sector is displayed in your response dashboard.
(C7.3a) Break down your total gross global Scope 1 emissions by business division.
Question dependencies
This question only appears if you select “By business division” in response to C7.3.
Change from last year
No change
Rationale
This question can give an indication of the relative GHG performance of your company’s divisions. When reported over time, your company and CDP’s data users will be able to review improvements or declines in division performance.
Response options
Please complete the following table. You are able to add rows by using the “Add Row” button at the bottom of the table.
| Business division
|
Scope 1 emissions (metric tons CO2e)
|
|
Text field [maximum 500 characters]
|
Numerical field [enter a range of 0- 999,999,999,999 using a maximum of 3 decimal places and no commas]
|
[Add Row]
Requested content
Business division (column 1)
- Using no more than 500 characters, state the business division you are disclosing Scope 1 emissions for.
- For more details on reporting your business divisions, see guidance to C7.3.
Scope 1 emissions (metric tons CO2e) (column 2)
- Report your organization’s greenhouse gas emissions in CO2-equivalent for the business division stated in column 1.
- Negative numbers are not allowed as organizations are to report gross, not net figures.
- Emissions figures should be for the reporting year only (as defined by your answer to C0.2).
(C7.3b) Break down your total gross global Scope 1 emissions by business facility.
Question dependencies
This question only appears if you select “By facility” in response to C7.3.
Change from last year
No change
Rationale
Providing facility-level emission figures may give data users insight into your organization’s current/potential exposure to regulation in this area. Reporting at this level can provide a useful indicator for making comparisons between facilities.
Response options
Please complete the following table. You are able to add rows by using the “Add Row” button at the bottom of the table.
| Facility
|
Scope 1 emissions (metric tons CO2e)
|
Latitude
|
Longitude
|
|
Text field [maximum 500 characters]
|
Numerical field [enter a range of 0-999,999,999,999 using a maximum of 3 decimal places and no commas]
|
Enter the latitude of your facility here using numbers between 90.000000 and -90.000000, e.g. 51.524810
|
Enter the longitude of your facility using numbers between 180.000000 and -180.000000, e.g. -0.106958
|
[Add Row]
Requested content
General
- CDP provides a place for companies to provide basic data for the geo-location of their facilities. This information will be useful to link CDP data with other sources of information and can help investors assess physical risks of climate change and exposure of assets. It will also help CDP to link the information requested by investors to cities preparing their inventory for CDP.
- If your organization has Scope 1 emissions from non-stationary sources (i.e. transportation vehicles) that cannot be attributed to a specific facility, then you can report the emissions from these sources collectively in one row. You can identify these emissions by inputting “Non-stationary sources” in column 1 “Facility”, and entering 0 in both column 3 “Latitude” and column 4 “Longitude”.
- If using the Export/Import functionality, it is essential that you check that data has entered correctly into each field in a question.
Facility (column 1)
- Using no more than 500 characters, identify the facility you are disclosing Scope 1 emissions for.
- For more details on reporting your facilities, see guidance to C7.3.
Scope 1 emissions (metric tons CO2e) (column 2)
- Report your organization’s greenhouse gas emissions in CO2-equivalent for the facility identified in column 1.
- Negative numbers are not allowed as organizations are to report gross, not net figures.
- Emissions figures should be for the reporting year only (as defined by your answer to C0.2).
Latitude (column 3)
- Using standard geographic coordinates specify the north-south position (+90° to -90°) of the facility that you are reporting Scope 1 emissions for in column 2.
Longitude (column 4)
- Using standard geographic coordinates specify the east-west position (+180° to -180°) of the facility that you are reporting Scope 1 emissions for in column 2.
Additional information
- Latitude and longitude: Latitude and longitude are geographic coordinates that specify, respectively, the north-south and east-west position, of a point on the Earth's surface. They are expressed as angular measures and thus, latitude can vary from +90° to -90° and longitude from +180° to -180°.
- The geodetic system that should be used is the WGS 84, which is the system used by GPS (Global Positioning System), Google Maps, Google Earth, and all major web applications providing coordinates to users. If you want to report information to CDP but have the coordinates in another geodetic system (or datum) we ask you to please attach the information to this question.
- If you don’t have this information and want to locate your facilities using the internet, there are various web tools available to assist companies getting latitude and longitude coordinates according to WGS84. For example, iTouch Map allows you to enter an address or identify a location on a map and will return the latitude and longitude coordinates.
- Google Maps also allows you to find the latitude and longitude of any point. When you are in Google Maps, if you right-click anywhere, you will find an option “What’s here?”. If you click that option, the latitude and longitude will be displayed in the information that appears.
(C7.3c) Break down your total gross global Scope 1 emissions by business activity.
Question dependencies
This question only appears if you select “By activity” in response to C7.3.
Change from last year
No change
Rationale
Reporting emissions by activity allows a more in-depth understanding of business risks related to future regulation and climate-related issues, and allows organizations to identify potential opportunities to reduce emissions associated with operational activities.
Response options
Please complete the following table. You are able to add rows by using the “Add Row” button at the bottom of the table.
| Activity
|
Scope 1 emissions (metric tons CO2e)
|
|
Text field [maximum 500 characters]
|
Numerical field [enter a range of 0-999,999,999,999 using a maximum of 3 decimal places and no commas]
|
[Add Row]
Requested content
Activity (column 1)
- Using no more than 500 characters, state the activity you are disclosing Scope 1 emissions for.
- For more details on which activities to report, see guidance to C7.3.
Scope 1 emissions (metric tons CO2e) (column 2)
- Report your organization’s greenhouse gas emissions in CO2-equivalent for the activity stated in column 1.
- Negative numbers are not allowed as organizations are to report gross, not net figures.
- Emissions figures should be for the reporting year only (as defined by your answer to C0.2).
Note for organizations responding to high-impact sector requests
- If your company’s primary CDP sector is one of the the following: AC, FB, PF, CE, CH, CO, EU, MM, OG, ST, TO, or TS the response to C7.3c is not required. Organizations responding to these sector requests are presented with additional questions on this topic (C-CE7.4/C-CH7.4/C-CO7.4/C-EU7.4/C-MM7.4/C-OG7.4/C-ST7.4/C-TO7.4/C-TS7.4; C-AC7.4/C-FB7.4/C-PF7.4, C-MM9.3a, C-MM9.3b, C-CO7.1b, C-EU7.1b, C-OG7.1b) relating specifically to activities in the sector. Your primary CDP sector is displayed in your response dashboard.
Scope 1 breakdown: agriculture
(C-AC7.4/C-FB7.4/C-PF7.4) Do you include emissions pertaining to your business
activity(ies) in your direct operations
as part of your global gross Scope 1 figure?
Question dependencies
This question only appears if you select the following options in response to C-AC0.6/C-FB0.6/C-PF0.6:
- "Own land only" or "Both own land and elsewhere in value chain" for "Agriculture/Forestry" business activity, AND/OR,
- "Direct operations only" or "Both direct operations and elsewhere in value chain" for "Processing/Manufacturing" and/or "Distribution" business activities.
Change from last year
No change
Rationale
This question gathers data on whether an emissions figure has been calculated for activities pertaining this sector, taking place within your organizational boundary, and is being reported as part of your gross Scope 1. This informs data users on whether your Scope 1 figure is representative of your business’ activities and their associated climate-related impacts.
Response options
Select one of the following options:
Requested content
General
- If your organization has calculated emissions from your relevant business activities (i.e. agricultural/forestry, processing/manufacturing and/or distribution) and these emissions are included in the global gross Scope 1 emissions figure reported in C6.1, please select “Yes”, if these emissions have been included in their entirety, or “Partially”, if some of these emissions were included. Otherwise, select “No”.
(C-AC7.4a/C-FB7.4a/C-PF7.4a) Select the form(s) in
which you are reporting your agricultural/forestry emissions.
Question dependencies
This question only appears if you select "Yes" or "Partially" in response to C-AC7.4/C-FB7.4/C-PF7.4, AND select "Own land only" or "Both own land and elsewhere in value chain" in response to the 'Agriculture/Forestry' row in C-AC0.6/C-FB0.6/C-PF0.6
Change from last year
Modified guidance
Rationale
This question provides you the option to breakdown CO2e emissions associated with agricultural/forestry activities in your land in further categories, as advised by the GHG Protocol.
Response options
Select one of the following options:
- Total emissions
- Emissions disaggregated by category (advised by the GHG Protocol)
Requested content
General
- Non-mechanical: Emissions from biological processes shaped by climatic and soil conditions or the burning of crop/timber residues.
- Land use change: Emissions from land use change that results in a reduction in the size of carbon stocks e.g. from the conversion of native habitats into farmlands/production units.
- Mechanical: Emissions from equipment or machinery operated on farms.
- If you select “Emissions disaggregated by category”, you will be able to report a breakdown of your agricultural/forestry emissions in the subsequent question.
- If you are unable to report your agricultural/forestry emissions disaggregated by the categories listed above, you should select "Total emissions".
- The GHG Protocol is developing new Land Sector and Removals Guidance. This new guidance is currently in the pilot testing and review phase, and will be finalized and published in 2023. Companies responding to the CDP 2023 climate change questionnaire should report in accordance with existing GHG Protocol corporate standards, and not use the draft land sector and removals guidance for CDP reporting in 2023, as it is still under development.
Additional information
(C-AC7.4b/C-FB7.4b/C-PF7.4b) Report the Scope 1 emissions pertaining to your business activity(ies) and explain any exclusions. If applicable, disaggregate your agricultural/forestry by GHG emissions category.
Question dependencies
This question only appears if you select "Yes" or "Partially" in response to C-AC7.4/C-FB7.4/C-PF7.4.
Change from last year
Modified guidance
Rationale
This question gathers information on Scope 1 data pertaining your relevant business activities and gives organizations an opportunity to provide further emissions breakdowns, as advised by the GHG Protocol.
Response options
Please complete the following table. You are able to add rows by using the “Add Row” button at the bottom of the table:
| Activity
|
Emissions category
|
Emissions (metric tons CO2e)
|
Methodology
|
Please explain
|
|
Select from:
• [List created from your response to C-AC0.6/C-FB0.6/C-PF0.6]
|
Select from:
- Non-mechanical
- Land use change
- Mechanical
- Total
|
Numerical field [enter a number from 0-999,999,999,999 using a maximum
of 3 decimal places]
|
Select all that apply:
- Default emissions factor
- Region-specific emissions factors
- Empirical models
- Process-based models
- Field measurements
- Other, please specify
|
Text field [maximum
2,400 characters]
|
[Add Row]
Requested content
General
- You should provide Scope 1 emissions data pertaining every business activity areas that are relevant to your organization, as indicated in C-AC0.6/C-FB0.6/C-PF0.6.
- The GHG Protocol is developing new Land Sector and Removals Guidance. This new guidance is currently in the pilot testing and review phase, and will be finalized and published in 2023. Companies responding to the CDP 2023 climate change questionnaire should report in accordance with existing GHG Protocol corporate standards, and not use the draft land sector and removals guidance for CDP reporting in 2023, as it is still under development.
Activity (column 1)
- The list presented in this column includes all activities that are relevant to your organization as you indicated in C-AC0.6/C-FB0.6/C-PF0.6. Add one row for each activity, except if "Agriculture/Forestry" is relevant to you and you indicated previously that you can provide a breakdown of Scope 1 data by categories. In this case, you should add four rows for "Agriculture/Forestry" and one row for the other relevant activities.
Emissions category (column 2)
- This column appears if you select "Emissions disaggregated by category" in response to C-AC7.4a/C-FB7.4a/C-PF7.4a.
- When disclosing data for "Agriculture/Forestry", you should disclose to all of the options listed here, including "Total." For all other relevant business activities, you should only select "Total". For example, if you are disclosing data for "Agriculture/Forestry" and "Processing/Manufacturing" and have indicated that you can breakdown your agricultural/forestry emissions by categories in C-AC7.4a/C-FB7.4a/C-PF7.4a, your table should look like as follows (for columns 1 and 2):
| Activity
|
Emissions category
|
| Agriculture/Forestry
|
Non-mechanical
|
| Agriculture/Forestry
|
Land use change
|
| Agriculture/Forestry
|
Mechanical
|
| Agriculture/Forestry
|
Total
|
| Processing/Manufacturing
|
Total
|
Whereas, if have selected "Total emissions" in response to C-AC7.4a/C-FB7.4a/C-PF7.4a, your table should look like as follows (for columns 1 and 2):
| Activity
|
Emissions metric tons (metric tons CO2e)
|
| Agriculture/Forestry
|
Numerical field [enter a number from 0-999,999,999,999 using a maximum of 3 decimal places]
|
| Processing/Manufacturing
|
Numerical field [enter a number from 0-999,999,999,999 using a maximum of 3 decimal places]
|
Emissions (metric tons CO2e) (column 3)
- If you do not know your Scope 1 emissions figure, do not add a 0 (zero). A 0 (zero) indicates you have measured your emissions and that they are equal to 0 (zero).
Methodology (column 4)
- Select the option(s) that best describe the methods used to calculate your Scope 1 emissions figure reported in column 3 (Emissions…).
- You should consider the following:
- Default emissions factors: involve the multiplication of activity data by an international default emissions factor.
- Region-specific emissions factors: involve the multiplication of activity data by an emissions factor specific to the region.
- Empirical models: involve using field measurements to develop statistical relationships between GHG data and activity-specific factors.
- Process-based models: involve mathematically linking biogeochemical processes that control the production, consumption, and emission of GHGs.
- Field measurements: these can be direct (e.g. livestock chambers that measure methane emissions from enteric fermentation) or indirect (e.g. measurement of carbon stocks before and after a change in management practices).
- If none of the options are applicable to your organization, select "Other, please specify" and indicate the methodology your organization applied.
Please explain (column 5)
- Specify and describe the assumptions, methods and tools used to calculate your Scope 1 emissions figure reported in column 3 (Emissions…).
- Specify and explain any exclusions.
Example response
For a company disclosing total agricultural emissions:
| Activity
|
Emissions (metric tons CO2e)
|
Methodology
|
Please explain
|
|
Agriculture/Forestry
|
200
|
Region-specific emissions
factors; Field measurements
|
Our main agricultural input is
beef (95% of our total production), and we understand that cattle can be a
significant source of methane emissions (a potent greenhouse gas - GHG) due to
enteric fermentation. We consider cattle to be our most significant source of
GHG emissions and have focused our attention and efforts toward quantifying
these emissions to date. Our entire beef production, and all its farm components
(animals, input materials, land activities, and machinery) are included in the emissions
accounting. We used the GHGs Accounting tool to calculate GHG emissions, which uses
default and region-specific emissions factors and farm specific data. At the
moment, we measure GHG emissions directly in a percentage of our sites (20%)
but intend to increase these field measurements in the near future.
In
the next year, we plan to start collecting emissions data from our agricultural
crops, that encompass 5% of our total production. We will initially target
crops that we grow in the largest quantities including sugarcane and barley.
|
For a company disclosing agricultural emissions disaggregated by category:
| Activity
|
Emissions category
|
Emissions (metric tons CO2e)
|
Methodology
|
Please explain
|
|
Agriculture/Forestry
|
Non-mechanical
|
150
|
Default emissions factors; Region-specific
emissions factors; Field measurements
|
Our main agricultural input is
beef, and we understand that cattle can be a significant source of methane
emissions (a potent greenhouse gas - GHG) due to enteric fermentation. We
consider cattle to be our most significant source of GHG emissions and have
focused our attention and efforts toward quantifying these emissions to date.
Our entire beef production is included in the emissions analysis. For the
non-mechanical emissions, we included all GHG emissions from enteric
fermentation, soil nitrous oxide emissions and emissions from manure
management. We used the GHGs Accounting tool to calculate GHG emissions, which considered
region-specific emissions factors and farm specific data. At the moment, we
measure GHG emissions directly in a percentage of our sites (20%) but intend to
increase these field measurements in the near future.
In the next year, we plan to start collecting emissions data from our agricultural crops, that encompass 5% of our total production. We will initially target crops that we grow in the largest quantities including sugarcane and barley.
|
|
Agriculture/Forestry
|
Land
use change
|
35
|
Field measurements
|
For the emissions from land use change, we
included CO2e emissions from all croplands that have been converted into
pastures in the reporting year. We used field measurements to calculate our
total emissions figure and extrapolated to the total area converted. This
accounted for 3% of our total farmland area. Note that we have not amortized
our emissions because the quantification interval has not exceeded one year.
|
|
Agriculture/Forestry
|
Mechanical
|
15
|
Default emissions factors
|
For the mechanical emissions figure, we
accounted for the emissions from all the machinery in our farms and slaughterhouses.
We used default emissions factors as inputs in the GHGs Accounting tool to
calculate our total CO2e figure.
|
|
Agriculture/Forestry>
|
Total
|
200
|
Default emissions factors; Region-specific
emissions factors; Field measurements
|
This total emissions figure combines
non-mechanical, mechanical emissions, and emissions from land use change. We
used the GHGs Accounting tool to calculate GHG emissions, which considered
default and region-specific emissions factors and farm specific data. This
accounts for the majority of our production units (95%).
In the next year, we plan to start collecting emissions data from our agricultural crops, that encompass 5% of our total production. We will initially target crops that we grow in largest quantities including sugarcane and barley.
|
Additional information
Refer to:
(C-AC7.4c/C-FB7.4c/C-PF7.4c) Why do you not include greenhouse gas emissions pertaining your business activity(ies) in your direct operations as part of your global gross Scope 1 figure?
Describe any plans to do so in the future.
Question dependencies
This question only appears if you select "No" in response to C-AC7.4/C-FB7.4/C-PF7.4.
Change from last year
No change
Rationale
This question aims to identify the main reason for why you have not included emissions pertaining to relevant business activities taking place within your organizational boundary, as part of your gross Scope 1 figure. This informs data users on whether your Scope 1 figure is representative of your business’ activities and their associated climate-related impacts and indicates if have any plans to do so in the next two years.
Response options
Please complete the following table:
| Primary reason | Please explain |
| Select from: - Analysis in progress
- We are planning to include in the next two years
- Judged to be unimportant
- Not an immediate business priority
- No instruction from management
- Lack of internal resources
- Other, please specify
| Text field [maximum 4,000 characters] |
Requested content
General
- You can provide either your primary reason for why you have not included emissions pertaining to your relevant business activities taking place within your organizational boundary as part of your gross Scope 1 figure, or describe any future plans to include these data in the next two years, if applicable.
Primary reason (column 1)
- If none of the reasons are applicable to your organization, select "Other, please specify" and indicate your primary reason. If you need more than 40 characters, please use column 2 (Please explain).
Please explain (column 2)
- Provide an explanation in line with the primary reason selected in column 1.
- If you selected the dropdown "Analysis in progress" in column 1, describe your evaluation methods, indicating the procedures and tools used for calculating your figures; specify whether this analysis will cover your entire reporting boundary; and provide a date for when the analysis will be finalized.
- If you selected "We are planning to include in the next two years," describe the methods and coverage (e.g., entire reporting boundary, relevant business activity) you plan to use in the analysis.
- If you selected "Lack of internal resources," specify the main challenges you experience.
Scope 2 breakdown: country/area/region
(C7.5) Break down your total gross global Scope 2 emissions by country/area/region.
Change from last year
Minor change
Rationale
By breaking down emissions to country/area or regional level, information and data can be made available to regions, states and sub-national bodies to help guide the development of emissions-related legislation.
Connection to other frameworks
SDG
Goal 7: Affordable and clean energy
Goal 12: Responsible consumption and production
Goal 13: Climate action
Response options
Please complete the following table. You are able to add rows by using the “Add Row” button at the bottom of the table.
| Country/area/region
|
Scope 2, location-based (metric tons CO2e)
|
Scope 2, market-based (metric tons CO2e)
|
|
Select from a drop-down list of countries/areas and regions. Please see the Technical Note “Countries, Areas and Regions”, for details around the available regions and their constituent countries/areas.
|
Numerical field [enter a number from 0-99,999,999,999 using a maximum of 3 decimal places and no commas]
|
Numerical field [enter a number from 0-99,999,999,999 using a maximum of 3 decimal places and no commas]
|
[Add Row]
Requested content
General
- Breaking down emissions to the country/area level is useful to investors as this is often the level at which emissions-related legislation is introduced. Please note that emissions should be attributed to individual countries/areas wherever possible. CDP considers reporting emissions broken down by country/area best practice.
- Where emissions are sufficiently low, or for parts of your business where your inventory does not allow for a country/area level of granularity, use the available region options from the dropdown menu to group emissions from a number of countries/areas. Please see CDP’s Technical Note “Countries, Areas and Regions” for details around the available regions and their constituent countries/areas.
- For countries/areas like USA, Canada, or Brazil where several grids can exist within a country/area and emission factors are calculated at state/sub-regional level, companies are welcome to provide further breakdown details using “Other, please specify” option.
- Negative numbers are not allowed as organizations are to report gross, not net figures.
- Emissions figures should be for the reporting year only (as defined by your answer to C0.2).
Country/area/region (column 1)
- Select country/area/region in accordance with CDP’s Technical Note “Countries, Areas and Regions”.
- If you wish to report your emissions at sub-national level, select “Other, please specify” and provide a label for the sub-national entity.
Scope 2, location-based (metric tons CO2e) (column 2)
- Report your organization’s Scope 2 emissions in CO2-e for the country/area/region selected in column 1, on a location-based method, i.e. reflecting the average emissions intensity of grids on which energy consumption occurs.
Scope 2, market-based (metric tons CO2e) (column 3)
- Report your organization’s Scope 2 emissions in CO2-e for the country/area/region selected in column 1, on a market-based method, i.e. reflecting emissions from electricity that companies have purposefully chosen (or their lack of choice).
Scope 2 breakdown: business breakdowns
(C7.6) Indicate which gross global Scope 2 emissions breakdowns you are able to provide.
Change from last year
No change
Rationale
By requesting companies to break down emissions by business division, facility, and activity, CDP grants data users and investors transparency into the sources of a company's Scope 2 emissions.
Response options
Select all that apply from the following options:
- By business division
- By facility
- By activity
Requested content
General
- You should identify breakdowns that are relevant to your business/sector and as such, those that investors would find interesting.
- Identify those that are relevant by ticking the boxes provided in the ORS adjacent to each of the three options.
- By business division
- This breakdown can give an indication of the relative GHG performance of your company’s divisions. When reported over time, your company and the information users will be able to review improvements or declines in division performance. This breakdown can be used alongside revenue segments found in company annual filings to understand companies’ emissions profiles in greater detail. It is recommended that companies match the divisions reported here with those found in company filings and financial statements to facilitate this process.
- The GHG Protocol stationary combustion tool document states that a “facility includes all buildings, equipment, structures and other stationary items which are located on a single site or on contiguous or adjacent sites and which are owned or operated by the same person or entity (or by any person or entity which controls, is controlled by or is under common control, with such person or entity)”.
- Facilities may also be referred to as installations. More than one business activity may take place at a facility and a facility may include more than one combustion unit, such as a boiler.
- Reporting at this level can provide a useful indicator for making comparisons between facilities. In some cases, individual facilities may come within the scope of particular legislation, requiring baselining and subsequent reduction of GHG emissions through improvements in energy efficiency. This is particularly the case for industrial plants. Therefore, providing facility-level emission figures may give data-users insight into your organization’s current/potential exposure to regulation in this area.
- Relevant activities should be defined by the reporting company but could include process activities, office activities etc. These activities can take place over multiple business divisions, countries/areas or facilities. Reporting by activity allows a more in depth understanding of business risk to future regulation. To facilitate comparability of data between companies, you are asked to report a breakdown of your activities using language that would be clear to someone outside of your organization and avoid using company-specific terminology. Furthermore, the level of aggregation of activities should be set so it is meaningful to investors or customers viewing your response. Each activity should be broken down to a level granular enough to provide a data user with a relevant and complete understanding of your company’s activities and how these contribute to your emissions profile. Each activity should be broken down to a level sufficient for understanding the complete activity emissions profile and where further disaggregation would not add value for data users to understand the associated GHG emissions.
Note for agricultural sectors:
- You should consider the business activity areas that are relevant to your organization, as indicated in C-AC0.6/C-FB0.6/C-PF0.6 (i.e., if you selected ‘Own land only/Direct operations only’ or ‘Both own land/direct operations and elsewhere in your value chain’ for the following activities: agriculture/forestry, processing/manufacturing, and/or distribution).
Note for organizations responding to high-impact sector requests
- If you select “By activity”, you will be presented with question 7.6c. If your company’s primary CDP sector is one of the following: OG, CO,TO, TS, MM, ST, CH or CE, the response to 7.6c is not required. Organizations responding to these requests are presented with additional questions on this topic (C-CE7.7/C-CH7.7/C-CO7.7/C-MM7.7/C-OG7.7/C-ST7.7/C-TO7.7/C-TS7.7, C-MM9.3a, MM9.3b) relating specifically to activities in the sector. Your primary CDP sector is displayed in your response dashboard.
(C7.6a) Break down your total gross global Scope 2 emissions by business division.
Question dependencies
This question only appears if you select “By business division” in response to C7.6.
Change from last year
No change
Rationale
This question can give an indication of the relative GHG performance of your company’s divisions. When reported over time, your company and CDP’s data users will be able to review improvements or declines in division performance.
Response options
Please complete the following table. You are able to add rows by using the “Add Row” button at the bottom of the table.
| Business division
|
Scope 2, location-based (metric tons CO2e)
|
Scope 2, market-based (metric tons CO2e)
|
|
Text field [500 maximum characters]
|
Numerical field [enter a number from 0-99,999,999,999 using a maximum of 3 decimal places and no commas]
|
Numerical field [enter a number from 0-99,999,999,999 using a maximum of 3 decimal places and no commas]
|
[Add Row]
Requested content
Business division (column 1)
- Using no more than 500 characters, state the business division you are disclosing Scope 2 emissions for.
Scope 2, location-based (metric tons CO2e) (column 2)
- Report your organization’s Scope 2 emissions in CO2e for the business division stated in column 1, on a location-based method, i.e. reflecting the average emissions intensity of grids on which energy consumption occurs.
- Negative numbers are not allowed as organizations are to report gross, not net figures.
- Emissions figures should be for the reporting year only (as defined by your answer to C0.2).
Scope 2, market-based (metric tons CO2e) (column 3)
- Report your organization’s Scope 2 emissions in CO2e for business division stated in column 1, on a market-based method, i.e. reflecting emissions from electricity that companies have purposefully chosen (or their lack of choice).
- Negative numbers are not allowed as organizations are to report gross, not net figures.
- Emissions figures should be for the reporting year only (as defined by your answer to C0.2).
(C7.6b) Break down your total gross global Scope 2 emissions by business facility.
Question dependencies
This question only appears if you select “By facility” in response to C7.6.
Change from last year
No change
Rationale
Providing facility-level emission figures may give data users insight into your organization’s current/potential exposure to regulation in this area. Reporting at this level can provide a useful indicator for making comparisons between facilities.
Response options
Please complete the following table. You are able to add rows by using the “Add Row” button at the bottom of the table.
| Facility
|
Scope 2, location-based (metric tons CO2e)
|
Scope 2, market-based (metric tons CO2e)
|
|
Text field [maximum 500 characters]
|
Numerical field [enter a number from 0-99,999,999,999 using a maximum of 3 decimal places and no commas]
|
Numerical field [enter a number from 0-99,999,999,999 using a maximum of 3 decimal places and no commas]
|
[Add Row]
Requested content
Facility (column 1)
- Using no more than 500 characters, identify the facility you are disclosing Scope 1 emissions for.
- If your organization has Scope 2 emissions from non-stationary sources that cannot be attributed to a specific facility then you can report the emissions from these sources collectively in one row. You can identify these emissions by inputting "Non-stationary sources" in this column.
Scope 2, location-based (metric tons CO2e) (column 2)
- Report your organization’s Scope 2 emissions in CO2e for the facility identified in column 1, on a location-based method, i.e. reflecting the average emissions intensity of grids on which energy consumption occurs.
- Negative numbers are not allowed as organizations are to report gross, not net figures.
- Emissions figures should be for the reporting year only (as defined by your answer to C0.2).
Scope 2, market-based (metric tons CO2e) (column 3)
- Report your organization’s Scope 2 emissions in CO2e for the facility identified in column 1, on a market-based method, i.e. reflecting emissions from electricity that companies have purposefully chosen (or their lack of choice).
- Negative numbers are not allowed as organizations are to report gross, not net figures.
- Emissions figures should be for the reporting year only (as defined by your answer to C0.2).
(C7.6c) Break down your total gross global Scope 2 emissions by business activity.
Question dependencies
This question only appears if you select “By activity” in response to C7.6.
Change from last year
No change
Rationale
Reporting emissions by activity allows a more in-depth understanding of business risks related to future regulation and climate-related issues, and allows organizations to identify potential opportunities to reduce emissions associated with operational activities.
Response options
Please complete the following table. You are able to add rows by using the “Add Row” button at the bottom of the table.
| Activity
|
Scope 2, location-based (metric tons CO2e)
|
Scope 2, market-based (metric tons CO2e)
|
|
Text field [maximum 500 characters]
|
Numerical field [enter a number from 0-99,999,999,999 using a maximum of 3 decimal places and no commas]
|
Numerical field [enter a number from 0-99,999,999,999 using a maximum of 3 decimal places and no commas]
|
[Add Row]
Requested content
Activity (column 1)
- Using no more than 500 characters, disclose the activity you are disclosing Scope 2 emissions for.
Scope 2, location-based (metric tons CO2e) (column 2)
- Report your organization’s Scope 2 emissions in CO2e for the activity reported in column 1, on a location-based method, i.e. reflecting the average emissions intensity of grids on which energy consumption occurs.
- Negative numbers are not allowed as organizations are to report gross, not net figures.
- Emissions figures should be for the reporting year only (as defined by your answer to C0.2).
Scope 2, market-based (metric tons CO2e) (column 3)
- Report your organization’s Scope 2 emissions in CO2e for the activity reported in column 1, on a market-based method, i.e. reflecting emissions from electricity that companies have purposefully chosen (or their lack of choice).
- Negative numbers are not allowed as organizations are to report gross, not net figures.
- Emissions figures should be for the reporting year only (as defined by your answer to C0.2).
Note for agricultural sectors
- You should provide Scope 2 emissions data pertaining to all your relevant business activity areas (i.e., agriculture/forestry, processing/manufacturing, and/or distribution), as indicated in C-AC0.6/C-FB0.6/C-PF0.6.
Note for organizations responding to high-impact sector requests
- If your company’s primary CDP sector is one of the following: OG, CO,TO, TS, MM, ST, CH or CE, the response to 7.6c is not required. Organizations responding to these requests are presented with additional questions on this topic (C-CE7.7/C-CH7.7/C-CO7.7/C-MM7.7/C-OG7.7/C-ST7.7/C-TO7.7/C-TS7.7, C-MM9.3a, MM9.3b) relating specifically to activities in the sector. Your primary CDP sector is displayed in your response dashboard.
Emissions breakdown by subsidiary
(C7.7) Is your organization able to break down your emissions data for any of the subsidiaries included in your CDP response?
Change from last year
New question
Rationale
Awareness of subsidiary-level emission figures enables a parent company to better target action to reduce emissions. The breakdown also provides investors and other data users with the opportunity of better understanding the emissions sources and therefore the risks and opportunities throughout the business.
Ambition: Companies are transparent about their emissions inventories, including their subsidiaries.
Connection to other frameworks
SDG
Goal 12: Responsible consumption and production
Goal 13: Climate action
Response options
Select from:
- Yes
- No
- Not relevant as we do not have any subsidiaries
Requested content
General
- The “consolidation approach” identifies which entities are included within the reporting boundary. Unless stated otherwise, the information you provide in response to the CDP climate change questionnaire should be presented as one “consolidated” result covering all of the companies, entities, businesses, etc., within your reporting boundary.
- Select “Yes” if, based on your chosen consolidation approach (provided in C0.5), your responses to questions C6.1, C6.3, and C6.5 include emissions data from subsidiaries that fall within your reporting boundary, and you are able to provide a breakdown of these emissions by subsidiary. If you select “Yes” you will be asked to break down your Scope 1 and Scope 2 emissions by subsidiary in the subsequent question.
- Select “No” if your organization does have subsidiaries which fall within your reporting boundary, but you are not able to breakdown emissions data from the subsidiaries included in your CDP response. Note that if the subsidiaries fall within your organization’s reporting boundary and you are not including emissions data from the subsidiaries in your responses to C6.1, C6.3, and C6.5, you should disclose the subsidiaries as exclusions in C6.4a.
- Select “Not relevant as we do not have subsidiaries” if based on your chosen consolidation approach (provided in C0.5) you do not have any subsidiaries which fall within your organization’s reporting boundary.
Explanation of terms
- Subsidiary: a company owned or controlled by a parent company or holding company.
- Consolidation approach: The identification of companies, businesses, organizations etc. for inclusion within the reporting boundary of the responding organization is known as the “consolidation approach”. The way in which you report information for the companies that are included within the reporting boundary is known as the “consolidation approach” because, unless stated otherwise, the information you provide in response to the questionnaire should be presented as one “consolidated” result covering all of the companies, entities, businesses etc within your reporting boundary. The GHG Protocol states that two distinct approaches may be used to consolidate GHG emissions; the equity share and the control approaches. Control can be defined in either financial (financial control) or operational (operational control) terms.
(C7.7a) Break down your gross Scope 1 and Scope 2 emissions by subsidiary.
Question dependencies
This question only appears if you select “Yes” in response to C7.7.
Change from last year
New question
Rationale
Awareness of subsidiary-level emissions enables a parent company to target actions to reduce emissions. The breakdown also provides investors and other data users with the opportunity to better understand the emissions sources and therefore risks and opportunities throughout the business.
Ambition: Companies are transparent about their emissions inventories, including their subsidiaries
Connection to other frameworks
SDG
Goal 12: Responsible consumption and production
Goal 13: Climate action
Response options
Please complete the following table. You are able to add rows by using the "Add row" button at the bottom of the table.
*Column/row appearance is dependent on selections in this or other questions.
| 1
|
2
|
3
|
4
|
5
|
6
|
7
|
| Subsidiary name
|
Primary activity
|
Select the unique identifier(s) you are able to provide for this subsidiary
|
ISIN code – bond*
|
ISIN code – equity*
|
CUSIP number*
|
Ticker symbol*
|
| Text field [maximum 200 characters]
|
Select from
[Drop-down list of CDP-ACS activities]
|
Select all that apply:
- ISIN code – bond
- ISIN code - equity
- CUSIP number
- Ticker symbol
- SEDOL code
- LEI number
- Another unique identifier, please specify
- No unique identifier
|
Text field [maximum 12 characters]
|
Text field [maximum 12 characters]
|
Text field [maximum 9 characters]
|
Text field [maximum 5 characters]
|
| 8
|
9
|
10
|
11
|
12
|
13
|
14
|
| SEDOL code*
|
LEI number*
|
Other unique identifier* |
Scope 1 emissions (metric tons CO2e)
|
Scope 2, location-based emissions (metric tons CO2e)
|
Scope 2, market-based emissions (metric tons CO2e)
|
Comment
|
| Text field [maximum 7 characters]
|
Text field [maximum 20 characters]
|
Text field [maximum 50 characters]
|
Numerical field [enter a number from 0-99,999,999,999 using a maximum of 3 decimal places and no commas]
|
Numerical field [enter a number from 0-99,999,999,999 using a maximum of 3 decimal places and no commas]
|
Numerical field [enter a number from 0-99,999,999,999 using a maximum of 3 decimal places and no commas]
|
Text field [maximum 2,500 characters]
|
[Add row]
Requested content
General
- Add a new row for each subsidiary you are providing emissions data for. You should aim to break down your Scope 1 and Scope 2 emissions by all subsidiaries that fall within your organization’s reporting boundary (as defined by your chosen consolidation approach in C0.5) but note that the total emissions entered will not be cross-checked by CDP for consistency with your total emissions reported in C6.1 and C6.3. If you are not able to provide a breakdown for all subsidiaries, please ensure that you have included at a minimum any subsidiaries who were requested to disclose to investors for the reporting year.
- Emissions must be reported in gross, not net figures. Therefore, negative numbers are not allowed.
- Emissions figures should be for the reporting year only (as defined by your answer to C0.2).
- If you are unable to provide either a Scope 1 or Scope 2 emissions figure for a subsidiary, leave the relevant column blank and do not enter zero. Entering zero indicates that you have measured the emissions and that they are equal to zero.
Subsidiary name (column 1)
- Provide the full legal entity name of the subsidiary you are entering data for.
Primary activity (column 2)
- Select the option that best describes the primary activity from which the subsidiary derives revenue. If the subsidiary engages in multiple activities, select the activity from which it derives the greatest share of its revenue.
- For a full list of classifications including descriptions of each activity, see CDP’s Activity Classification System.
Select the unique identifier(s) you are able to provide for this subsidiary (column 3)
- If your subsidiary organization has multiple unique identifiers, select all the unique identifiers you are able to provide.
- For each unique identifier selected, columns 4-10 will appear for you to enter the unique identifier.
- Ensure that you enter the correct format for the unique identifier(s) you are providing. For example, ISIN codes include a two-letter country code, followed by a nine-character alphanumeric identifier and a single check digit.
Scope 1 emissions (metric tons CO2e) (column 11)
- Report in metric tons CO2e the proportion of organization’s Scope 1 emissions attributed to the subsidiary identified in column 1.
Scope 2 location-based emissions (metric tons CO2e) (column 12)
- Report in metric tons CO2e the proportion of organization’s Scope 2, location-based emissions attributed to the subsidiary identified in column 1.
Scope 2 market-based emissions (metric tons CO2e) (column 13)
- Report in metric tons CO2e the proportion of organization’s Scope 2, market-based emissions attributed to the subsidiary identified in column 1.
Comment (column 14)
- You can use this text field to enter any additional relevant information. For example, you may wish to provide context to the subsidiaries you have included within your response to this question, based on your chosen consolidation approach.
Explanation of terms
- Subsidiary: a company owned or controlled by a parent company or holding company.
- Consolidation approach: The identification of companies, businesses, organizations etc. for inclusion within the reporting boundary of the responding organization is known as the “consolidation approach”. The way in which you report information for the companies that are included within the reporting boundary is known as the “consolidation approach” because, unless stated otherwise, the information you provide in response to the questionnaire should be presented as one “consolidated” result covering all of the companies, entities, businesses etc within your reporting boundary. The GHG Protocol states that two distinct approaches may be used to consolidate GHG emissions; the equity share and the control approaches. Control can be defined in either financial (financial control) or operational (operational control) terms.
- ISIN: International Securities Identification Number, a 12-character alphanumeric code used to identify a security, such as a stock or bond. It is structured with the first two letters referencing the country of origin of the issuer for the security, in accordance with ISO 3166. The second grouping consists of nine characters made up of digits and letters, which is the unique identifying code for the security. In the U.S. and Canada this is known as the CUSIP number (see below). The final digit is the check digit, which ensures the authenticity of the code.
- CUSIP number: Committee on Uniform Security Identification Procedures number, a 9-character alphanumeric code that identifies a security for the purposes of facilitating clearing and settlement of trades. CUSIPs are used to distinguish, among other reasons, between multiple share classes or bond tranches. CUSIPs are mostly used in the United States and Canada.
- Ticker symbol: A ticker symbol, also known as a stock symbol, is a unique series of letters assigned to a security for trading purposes. Ticker symbols are usually related to the organization’s name, and additional letters denote additional characteristics such as share class or trading restrictions.
- LEI number: The Legal Entity Identifier (LEI) is a 20-character, alpha-numeric code based on the ISO 17442 standard developed by the International Organization for Standardization (ISO). It connects to key reference information that enables clear and unique identification of legal entities participating in financial transactions.
- SEDOL code: Stock Exchange Daily Official List code, a 7-character identification code consisting of two parts: a 6-character alphanumeric code and a trailing check digit. SEDOLs issued prior to January 26, 2004 were composed only of numbers. SEDOLs serve as the National Securities Identifying Number for all securities issued in the United Kingdom.
Question C-CE7.7/C-CH7.7/C-CO7.7/C-MM7.7/C-OG7.7/C-ST7.7/C-TO7.7/C-TS7.7 only applies to organizations with activities in the following sectors:
- Cement
- Chemicals
- Coal
- Metals & mining
- Oil & gas
- Steel
- Transport OEMS
- Transport services
Question C7.8 only applies to organizations with activities in the following sectors:
- Chemicals
- Transport manufacturers
Emissions performance
(C7.9) How do your gross global emissions (Scope 1 and 2 combined) for the reporting year compare to those of the previous reporting year?
Change from last year
No change
Rationale
Investors and data users are interested in understanding whether companies are successfully reducing their emissions year over year.
Connection to other frameworks
SDG
Goal 7: Affordable and clean energy
Goal 12: Responsible consumption and production
Goal 13: Climate action
Response options
Select one of the following options:
- Increased
- Decreased
- Remained the same overall
- This is our first year of reporting, so we cannot compare to last year
- We don’t have any emissions data
Requested content
General
- This question requires you to select the option from the drop-down menu that best describes how your combined Scope 1 and 2 emissions have changed compared with the previous year.
- The change in emissions can be calculated using the following formula:
Total gross Scope 1+2 emissions for the current reporting year – previous year’s total gross Scope 1+2 emissions = total change in emissions
- If the resulting figure is negative, then your company’s overall emissions decreased compared to the previous year. If the resulting figure is positive, overall emissions have increased compared to the previous year. If the resulting figure is equal to zero, overall emissions have not changed compared to the previous year.
- In this context your Scope 1 emissions are the figure supplied in response to question C6.1, and your Scope 2 emissions are the figure supplied in response to question C6.3.
- If the previous year’s figures have been restated, please refer to CDP’s Technical Note on “Restatements” on whether to use the emissions figures originally reported to CDP or the restated figures for the calculation. The previous year compared should apply to the 12-month period directly prior to the reporting period, even if it does not completely overlap with the period previously reported to CDP.
(C7.9a) Identify the reasons for any change in your gross global emissions (Scope 1 and 2 combined), and for each of them specify how your emissions compare to the previous year.
Question dependencies
This question only appears if you select “Increased”, “Decreased” or “Remained the same overall” in response to C7.9.
Change from last year
Minor change
Rationale
When investigating how year-on-year gross global emissions (Scope 1 + 2 combined) have changed, CDP and its investors are interested in changes at a granular level; thus allowing CDP’s data users to gain an insight into factors than have contributed to these changes.
Connection to other frameworks
SDG
Goal 7: Affordable and clean energy
Response options
Please complete the following table:
| Reason
|
Change in emissions (metric tons CO2e)
|
Direction of change in emissions |
Emissions value (percentage)
|
Please explain calculation
|
|
Change in renewable energy consumption
|
Numerical field [enter a number from 0-999,999,999,999 using a maximum of 3 decimal places and no commas]
|
Select from:
- Increased
- Decreased
- No change
|
Numerical field [enter a number from 0-999 using a maximum of 4 decimal places and no commas]
|
Text field [maximum 2,400 characters]
|
|
Other emissions reduction activities
|
|
|
|
|
|
Divestment
|
|
|
|
|
|
Acquisitions
|
|
|
|
|
|
Mergers
|
|
|
|
|
|
Change in output
|
|
|
|
|
|
Change in methodology
|
|
|
|
|
|
Change in boundary
|
|
|
|
|
|
Change in physical operating conditions
|
|
|
|
|
|
Unidentified
|
|
|
|
|
|
Other
|
|
|
|
|
Requested content
General
- Categorize the changes that have occurred in your gross global emissions. You are asked to break down all the different factors that have influenced any overall change in Scope 1+2 emissions; whether increasing or decreasing factors.
- Break down each applicable factor, describe each in a separate row, and provide the value for the change in overall emissions that is attributed to each of the factors.
- Even if companies have experienced no change overall or an increase in absolute emissions for Scopes 1 and 2, companies should still disclose reduction activities.
- In the unlikely event that companies have genuinely not experienced any change in any of the categories, they should complete the row “Other”, specifying “No change” in the text box provided and then enter 0 in column 2 ‘Emissions value (percentage)’.
- Emissions reduction activities could arise from a number of different sources, including reductions in energy consumption or lower emission equipment/processes. If your emissions have changed compared to the previous reporting year due to several emissions reduction activities, you should aggregate the emissions change that occurred due to these activities and provide this information in row 2 in C7.9a.
- Any changes in emissions that are attributed to a decline or an increase in your business output (products or services) due to the COVID-19 pandemic should be reported using row “Change in output”. Please state how your output was affected in “Please explain calculation”.
Reason (column 1)
- This column is fixed; however, if a row does not apply to you, for example, your company did not experience any mergers or acquisitions during the reporting year, leave that row blank.
- Further details on each of the options are provided below:
- Change in renewable energy consumption (row 2)
- Report the change in your organization's emissions because of the consumption of self-generated or purchased renewable energy.
- In cases where you have renewable energy, you may include this on the provision that you have accounted for those renewable energy purchases in your market-based Scope 2 figure reported in C6.3 and the purchases reported here were additional purchases in the reporting year.
- Due to the change in accounting practices around Scope 2 with the addition of Scope 2 market-based emissions and low-carbon energy, companies may see their Scope 2 emissions decrease. Any change in Scope 2 emissions due to the change in accounting method from Scope 2 location-based to Scope 2 market-based should not be reported here, but rather under “Change in methodology” (see below).
- CDP requires disclosure of gross emissions. Gross means total emissions before any deductions or other adjustments are made to take account of offset credits, avoided emissions from the use of goods and services, and/or reductions attributable to the sequestration or transfer of GHGs.
- Other emissions reduction activities (row 3)
- This refers to changes in emissions that have occurred because of proactive emissions reduction initiatives or activities, for example those listed in question C4.3b, other than those caused by a change in renewable energy consumption (which should be reported in the row ‘Change in renewable energy consumption’).
- Divestment (row 4)
- This refers to changes that occur as a result of selling off certain aspects of the businesses.
- Acquisitions (row 5)
- This refers to changes that occur as a result of purchasing or obtaining another company/subsidiary/facility.
- Mergers (row 6)
- This refers to changes that occur as a result of business mergers.
- Change in output (row 7)
- This refers to changes that occur as a result of changes (increases or decreases) in your business output (i.e. a product or service); this could be, for example, organic growth, purchase of additional facilities due to business expansion, declines in sales due to a global recession, or release of a new product.
- Change in methodology (row 8)
- This refers to changes that occur due to modifications in the way that the inventory is calculated, for example, changes in emissions factors used or changes in methodology protocol followed.
- Companies that have amended their Scope 2 emissions figure as a result of the changes in Scope 2 accounting practices for low carbon energy should report this here.
- Change in boundary (row 9)
- This refers to changes in the boundary used for your inventory calculation, i.e. changing from financial control to operational control. This option could also apply if you have incorporated facilities into your inventory that were excluded in previous years.
- Change in physical operating conditions (row 10)
- This refers to changes in weather that have a significant influence on how the company operates, but that cannot be accounted for under the other options available, e.g. increase production of hydroelectricity because of increased rainfall.
- Unidentified (row 11)
- Complete this row if you are not able to identify the reason for the change in emissions from year to year.
- Other (row 12)
- Complete this row if there is an alternative reason(s) for the change. Where you have used this option, please provide details of the reason(s) for the change in the ‘Please explain’ column.
Direction of change in emissions (column 3)
- Enter the direction of change of gross global (Scope 1 + Scope 2) emissions due to the reason specified, i.e. increased; decreased, or; No change.
- You should only select “No change” if the percentage change is exactly zero, or zero to four decimal places (e.g. 0.00003).
Emissions value (percentage) (column 4)
- Enter the change in emissions attributed to the reason (factor) provided in column 1 as a percentage of the Scope 1 and 2 combined emissions. This value should not be greater than 999 and should not have more than four decimal places. If the value rounds to less than zero to four decimal places (e.g. 0.00003), you should enter 0.0000. There is no need to enter the % symbol, and direction of change will be indicated in column 3. This value should be calculated as follows:

Please explain calculation (column 5)
- Report the figures used in the calculation for the figure in the ‘emissions value %’ column. Refer to Example responses for further guidance.
- Using no more than 2,400 characters you may also use this text box to provide any additional explanation that is relevant to capture the full complexity of the emissions changes.
Note for electric utility sectors
- Variations in emissions may be attributable to changes in capacity (that translated into changes in output), plant outages (which can also translate into changes in output) and weather events (changes in physical operating conditions). If so, this should be included in your answer to C7.9a.
- You can specify the specific drivers (e.g. changes in output due to the utilization of additional capacity coming in operation) in the comment box.
Example response
Worked example of reporting change in emissions
Example 1: The gross global emissions (Scope 1 + 2) of company X for this reporting year are 208 metric tons of CO2e. Its gross global emissions for the previous reporting year were 200 metric tons of CO2e. This means that the total change in emissions is 8 metric tons of CO2e, equal to a 4% increase, according to the formula in the explanation of terms, above: (8/200) * 100 = 4%.
The change from 200 to 208 metric tons is attributed to two reasons: 1) an increase in 12 metric tons of CO2e emissions due to increased production (i.e. a change in output); and 2) an estimated reduction of 4 metric tons of CO2e achieved due to emissions reduction activities.
The emissions value (percentage) for each of these two individual factors can also be calculated using the same formula described in the guidance, above. In this example, the percentage change in emissions due to increased production is: (12/200) * 100 = 6%. This represents a 6% increase in emissions due to increased production.
The percentage change in emissions due to emissions reduction activities: (-4/200) * 100 = -2%. This represents a 2% decrease in emissions due to emissions reduction activities.
This company should respond in the following way to questions C7.9 and C7.9a:
(C7.9) How do your gross global emissions (Scope 1 and 2 combined) for the reporting year compare to those of the previous reporting year?
Increased
(C7.9a) Identify the reasons for any change in your gross global emissions (Scope 1 and 2 combined) and for each of them specify how your emissions compare to the previous year.
| Reason
|
Change in emissions (metric tons CO2e)
|
Direction of change in emissions |
Emissions value (percentage)
|
Please explain calculation
|
| Other emissions
reduction activities
|
4
|
Decreased
|
2
|
Due to ‘other
emissions reduction activities’ implemented during the year, despite an
increase in production, emissions have not grown as high as could be expected.
Last year 4 tons of CO
2e were reduced by our emissions reduction projects, and
our total Scope 1 and Scope 2 emissions in the previous year was 200 tCO
2e,
therefore we arrived at -2% through (-4/200) * 100= -2% (i.e. a 2% decrease in
emissions).
|
| Change in output
|
12
|
Increased
|
6
|
If no measures had
been introduced, increased demand leading to increase output would have
generated an extra 6% more of emissions.
|
Example 2: Companies may be used to seeing emissions information presented graphically where reductions appear below the horizontal axis. The tables below the graph shows how this data can be used to complete question C7.9a.
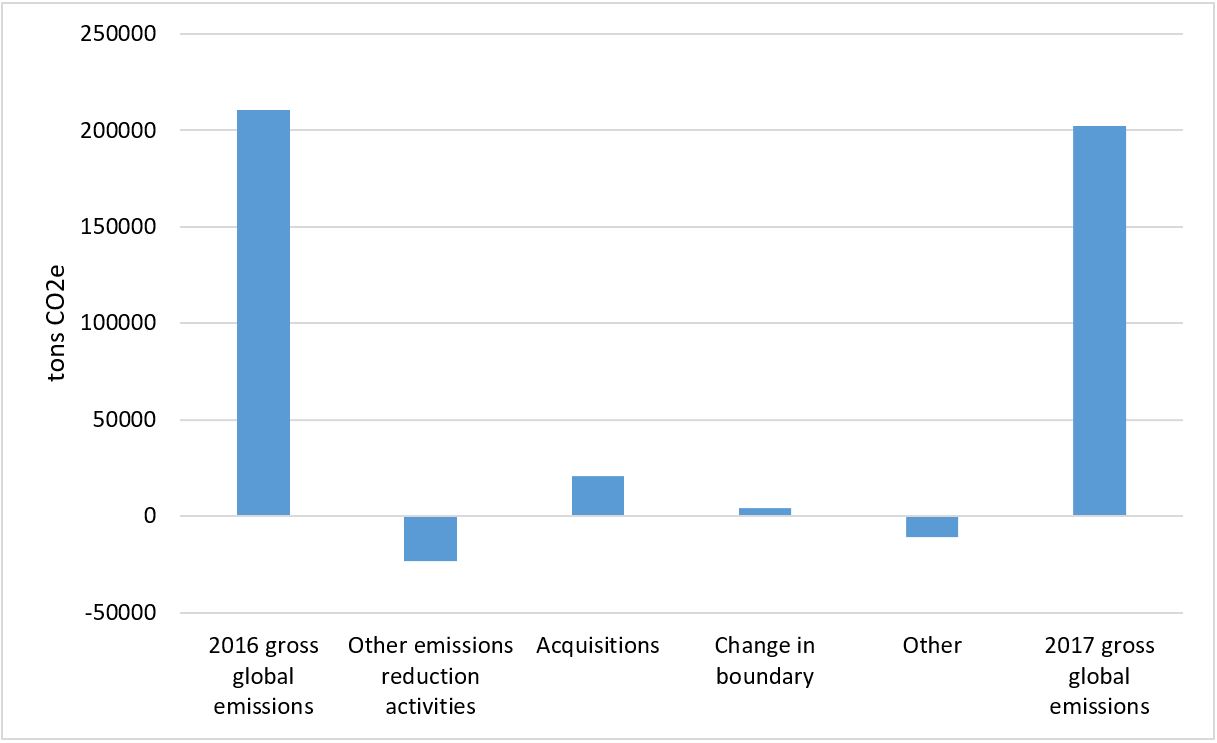
|
|
2016 gross global emissions
|
What happened during the reporting year
|
2017 gross global emissions
|
|
Other emissions reduction activities
|
Acquisitions
|
Change in boundary
|
Other
|
|
Emissions value (percentage)
|
|
-11
|
10
|
2
|
-5
|
-4
|
|
Tons CO2e
|
210573
|
-23163
|
21057.3
|
4211.5
|
-10542.8
|
202136
|
(C7.9a) Identify the reasons for any change in your gross
global emissions (Scope 1 and 2 combined) and for each of them specify how your
emissions compare to the previous year.
| Reason
|
Change in emissions (metric tons CO2e)
|
Direction of change in emissions |
Emissions value (percentage)
|
Please explain calculation
|
| Other emissions reduction activities
|
23163
|
Decreased
|
11
|
Gross Scope 1+2 emissions decreased by 11%, due
to energy efficiency activities undertaken. We have achieved energy consumption
reductions of 14% in New Zealand, 9% in Australia and 8% in USA. These are due
to energy efficiency measurements in all our main buildings, which have
obtained maximum GreenStar certification, a tri-generation plant which
increased the efficiency of our largest data center, and improved metering and
monitoring of energy consumption. All have led to an overall reduction of
energy consumption across our offices. Changes due to variation of emission
factors associated with the grid mix have also contributed to a decrease of
emissions, although that is not considered here. Through these activities we
reduced our emissions by 23163 tons CO
2e, and our total S1 and S2 emissions in
the previous year was 210573 tons CO
2e, therefore we arrived at -11% through
(-23163/210573) * 100 = -11% (i.e. an 11% decrease in emissions).
|
| Acquisitions
|
21057.3
|
Increased
|
10
|
In the United States, the acquisition of a major
business competitor resulted in a circa 36% increase of the emissions in the
USA and a 10% increase of our gross global emissions. This is mainly the result
of additional buildings being included as new sources of GHG emissions.
|
| Change in boundary
|
4211.5
|
Increased
|
2
|
Emissions increased by 2% due to the inclusion
of additional inventory items for our minority positions in Asia. As an example
the Hong Kong office reported for the first time the emissions due to vehicle
fleet and business travel.
|
| Other
|
10542.8
|
Decreased
|
5
|
Scope 1 emissions for our USA operations
decreased 25% compared to previous year inventory. This is equivalent to a
decrease of 3100 tons CO
2e. This decrease is due to the new gas powered
tri-generation plant, substituting previous fuel oil boiler. This and other
changes cumulated in a decrease of 10542.8 tons CO
2e, therefore we arrived at
-5% through (-10542.8/210573) * 100 = -5% (i.e. an 5% decrease in emissions).
|
(C7.9b) Are your emissions performance calculations in C7.9 and C7.9a based on a location-based Scope 2 emissions figure or a market-based Scope 2 emissions figure?
Question dependencies
This question only appears if you select “Increased”, “Decreased” or “Remained the same overall” in response to C7.9.
Change from last year
No change
Rationale
This question provides more transparency on how your organization’s emissions performance figures are derived.
Response options
Select one of the following options:
- Location-based
- Market-based
- Don’t know
Requested content
General
- In alignment with the GHG Protocol Scope 2 Guidance, companies are only required to compare their Scope 2 emissions for either their location-based or market-based figure, but are required to be transparent about which figure they use.
- You should only select one option, as your market-based figure may inherently be a combination of location-based and market-based calculations if you have operations in regions where there are contractual instruments, and other operations in regions where there are not contractual instruments.
C8 Energy
Module Overview
Energy related activities represent, for many sectors, the most significant GHG emission sources. This module provides transparency on the consumption and generation of energy by organizations.
Accurate emissions accounting depends on a comprehensive account of energy. It is expected that organizations have already collected the necessary energy data for the disclosure of emissions in previous modules. Unless otherwise stated in the question-specific guidance, energy generation data requested in this module is in alignment with Scope 1 emissions sources i.e. from generating units owned or controlled by the organization. The requested data on purchased or acquired energy is in alignment with Scope 2 emissions reporting.
Key changes
- Modified questions:
- C8.2e – updated sourcing method options and question structure updated for clarity.
- C8.2g – has revision to text to specify the reporting year with two new columns to capture the breakdown of consumption of purchased and self-generated energy.
For RE100 members only:
- Modified question:
- C8.2h – has been modified for clarity, with revised sourcing method options, and to request additional details of companies’ renewable electricity purchases.
- C8.2i – has reordered columns for clarity.
- C8.2j – has five columns removed and one new column asking if energy attribute certificates have been issued for the renewable electricity generation being reported.
For the cement sector only:
- Modified question:
- C-CE8.2c – has a new comment column to provide the criteria used to classify biomass as sustainable.
For the electric utilities sector only
- Modified guidance:
- C-EU8.2d – has modified guidance on reporting bioenergy with carbon capture and storage (BECCS.)
Click here for a list of all changes made this year.
Sector-specific content
Additional questions on energy-related activities for the following high-impact sectors:
- Capital goods
- Cement
- Chemicals
- Electric utilities
- Metals & mining
- Steel
- Transport original equipment manufacturers (OEMs)
- Transport services
Pathway diagram - questions
This diagram shows the general questions contained in module C8. To access question-level guidance, use the menu on the left to navigate to the question.
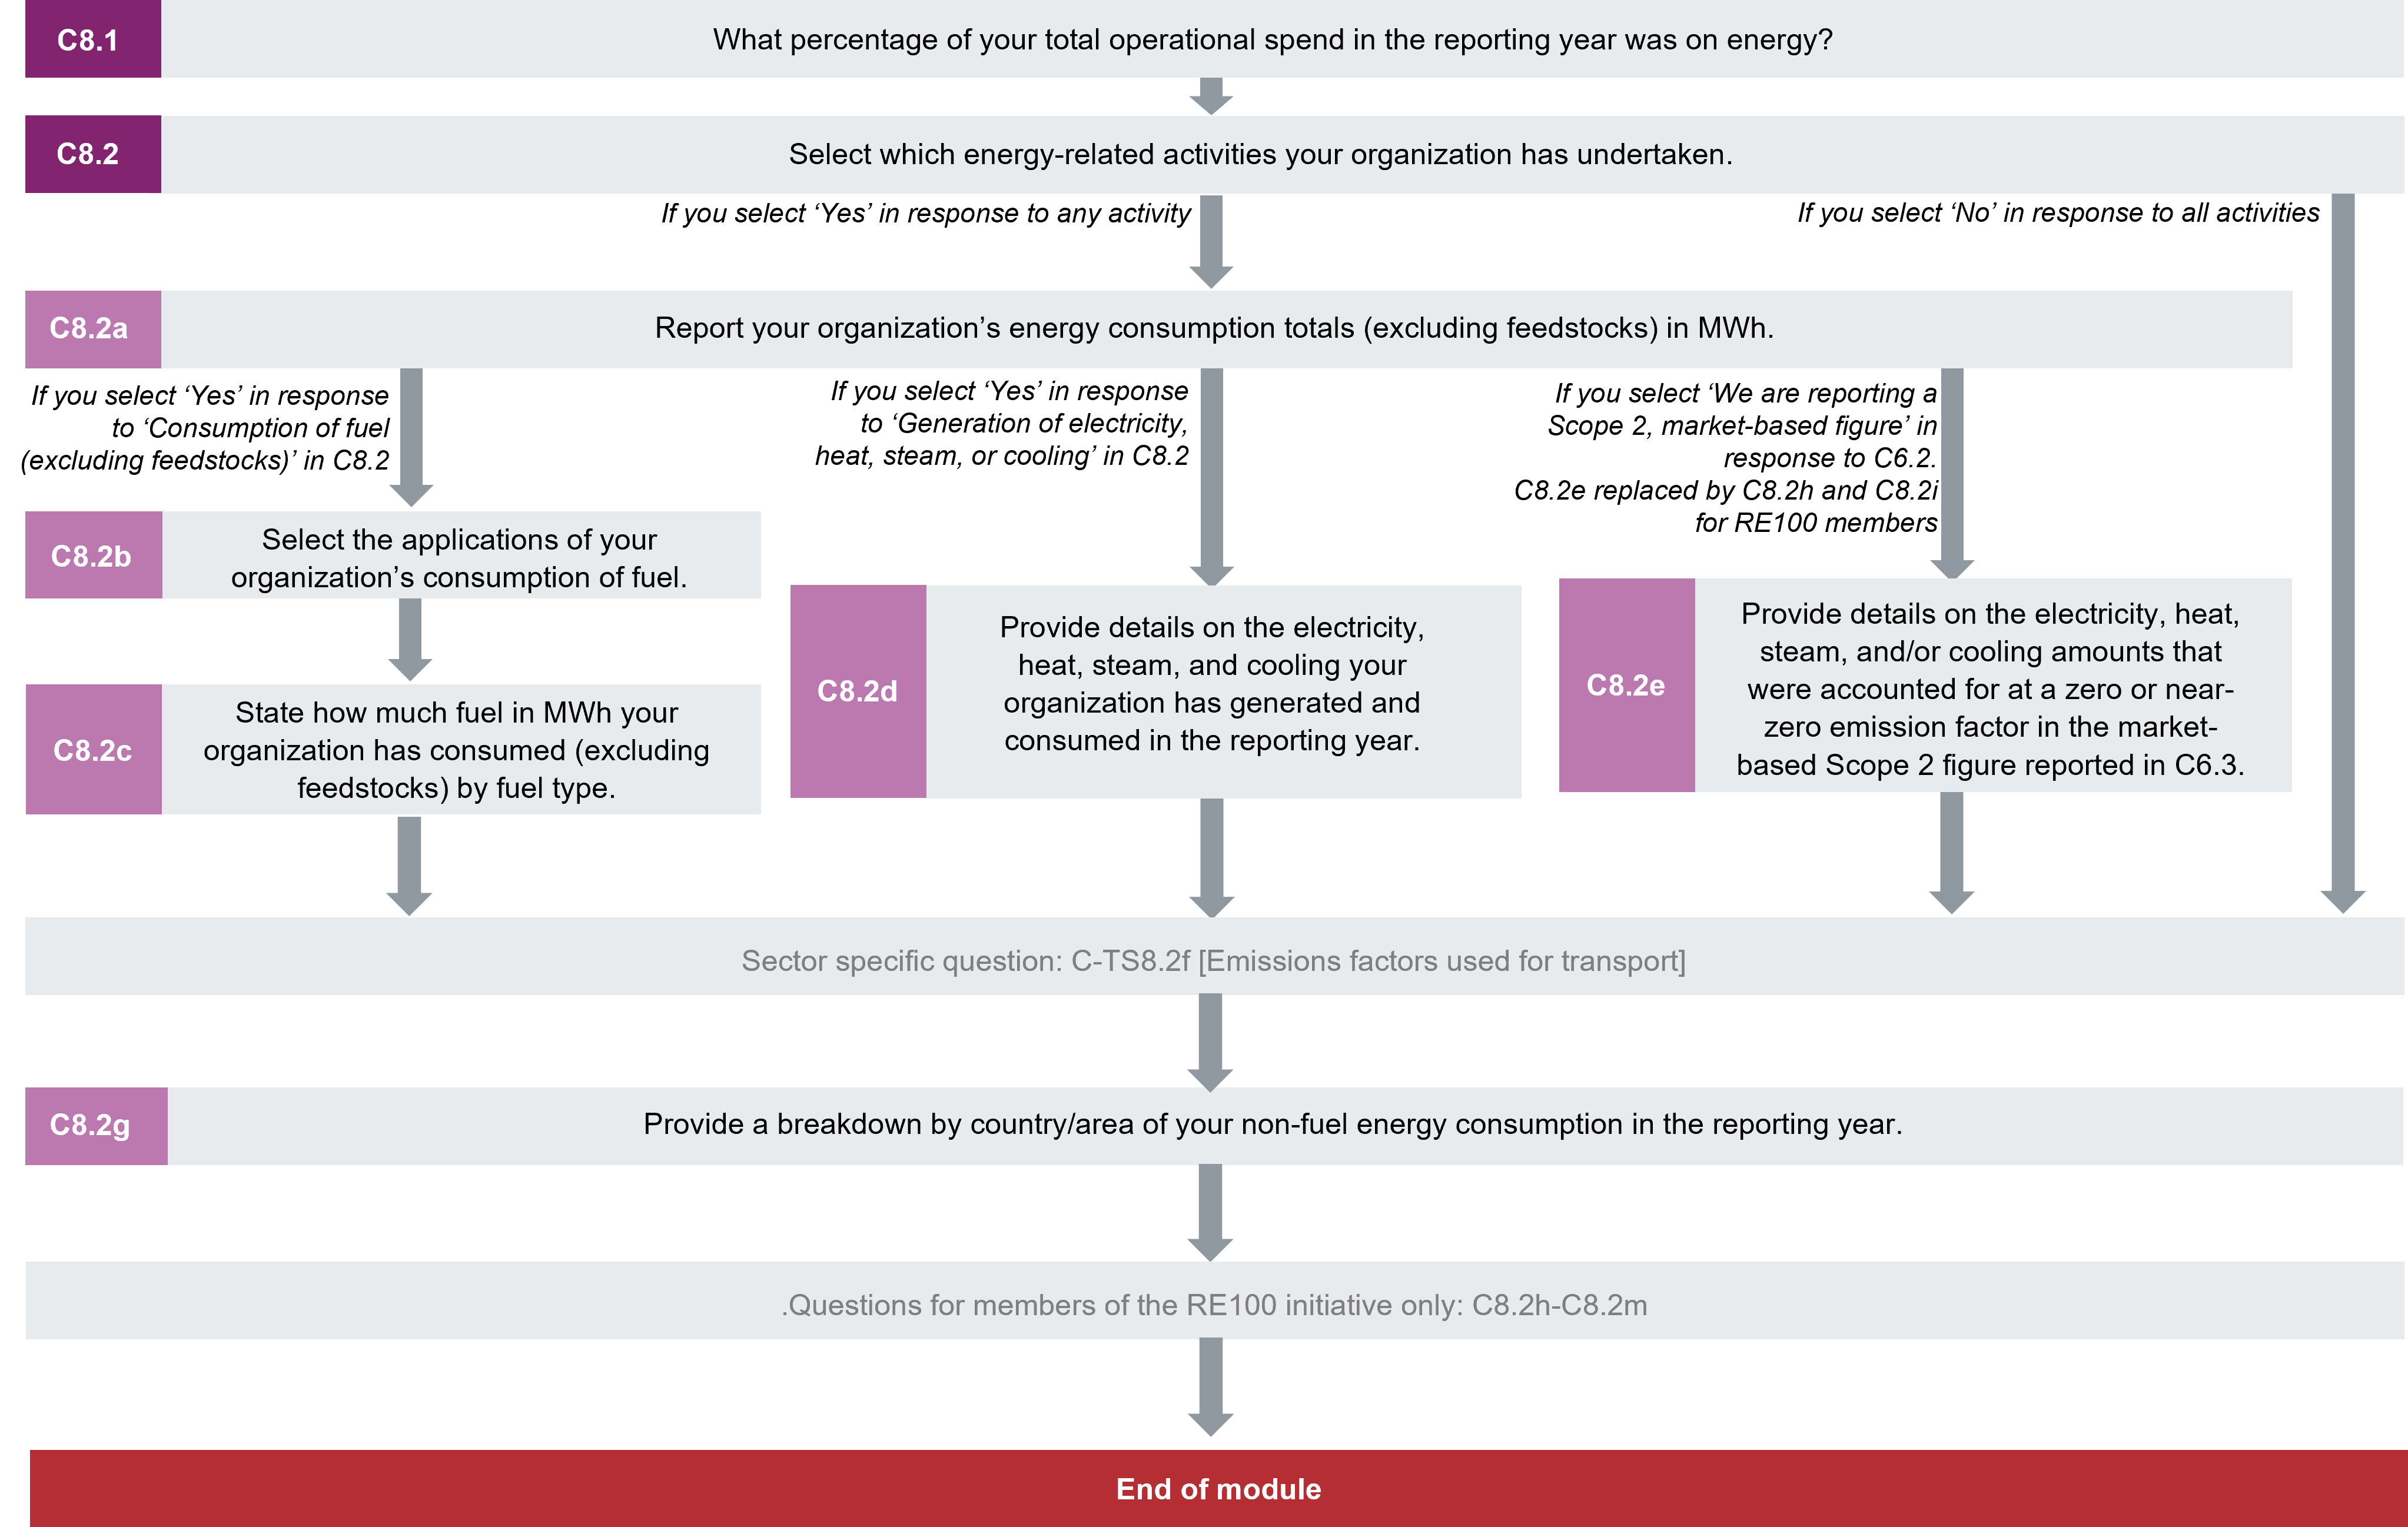
Energy spend
(C8.1) What percentage of your total operational spend in the reporting year was on energy?
Change from last year
No change
Rationale
The aim of this question is to identify the degree to which your organization’s activities are sensitive to energy costs and energy supply.
Response options
Select one of the following options:
- 0%
- More than 0% but less than or equal to 5%
- More than 5% but less than or equal to 10%
- More than 10% but less than or equal to 15%
- More than 15% but less than or equal to 20%
- More than 20% but less than or equal to 25%
- More than 25% but less than or equal to 30%
- More than 30% but less than or equal to 35%
- More than 35% but less than or equal to 40%
- More than 40% but less than or equal to 45%
- More than 45% but less than or equal to 50%
- More than 50% but less than or equal to 55%
- More than 55% but less than or equal to 60%
- More than 60% but less than or equal to 65%
- More than 65% but less than or equal to 70%
- More than 70% but less than or equal to 75%
- More than 75% but less than or equal to 80%
- More than 80% but less than or equal to 85%
- More than 85% but less than or equal to 90%
- More than 90% but less than or equal to 95%
- More than 95% but less than or equal to 100%
- Don’t know
Requested content
General
- Ensure that the boundary used for calculating your operational spend is the same as that for your energy spend (i.e. it includes the same facilities, geographies, etc.).
- “Operational spend” should exclude extraordinary expenses such as gains or losses on the sale of assets. The calculation should also exclude the cost of interest or taxes on profits.
Explanation of terms
- Operational spend: Operational spend should be the sum of the costs for the following two types of costs to the business:
- Cost of goods sold (also known as 'direct costs'): This generally refers to the raw material, energy and labor costs directly identified in the cost of the end product. These costs fluctuate and vary depending on the number or volume of goods sold.
- Operating costs (also known as 'indirect costs' or 'overheads'): This generally refers to the essential expenses incurred in order to maintain the business including wages, rent, transport, energy (electricity, fuel, etc.), maintenance, and so on. These expenses cannot be attributed to the manufacture of a particular job or the provision of a particular service - they are standard costs that apply regardless of the volume of goods produced.
Energy-related activities
(C8.2) Select which energy-related activities your organization has undertaken.
Question dependencies
The energy-related activities that you select in response to C8.2 determine which energy breakdowns you will be prompted to respond to in the proceeding questions. Please note, if your response to C8.2 is amended, data in dependent questions may be erased.
Change from last year
No change
Rationale
This question provides data users with information on the organization’s consumption of energy forms relating to Scope 1 and Scope 2 emissions, and transparency on the generation of energy.
Response options
Please complete the following table:
| Activity
|
Indicate whether your organization undertook this energy-related activity in the reporting year
|
|
Consumption of fuel (excluding feedstocks)
|
Select from:
|
|
Consumption of purchased or acquired electricity
|
|
|
Consumption of purchased or acquired heat
|
|
|
Consumption of purchased or acquired steam
|
|
|
Consumption of purchased or acquired cooling
|
|
|
Generation of electricity, heat, steam, or cooling
|
|
Requested content
Consumption of fuel (excluding feedstocks) (Row 1)
- You should select ‘Yes’ in row 1 ‘Consumption of fuel (excluding feedstocks)’ if fuel was consumed inside your organizational boundary in the reporting year. All fuels accounted for in the calculation of Scope 1 emissions (C6.1) and fuels accounted for in the calculation of emissions from biogenic carbon (C6.7a) are included. Consumption of nuclear fuel is not included.
Consumption of purchased or acquired electricity heat, steam and/or cooling (Rows 2-5)
- You should select ‘Yes’ in rows 2-5 according to whether your organization has consumed electricity, heat, steam, and/or cooling that was purchased or acquired, i.e. brought into the organizational boundary. This excludes consumption of electricity, heat, steam or cooling that was produced by the organization, i.e. from inside the organizational boundary. It also excludes purchased or acquired electricity, heat, steam or cooling that is not consumed inside the organizational boundary.
- Purchased or acquired electricity, heat, steam or cooling that is wasted should still be counted as consumption.
- The activities of rows 2-5 are aligned with the boundary for Scope 2 emissions.
Generation of electricity, heat, steam, or cooling (Row 6)
- You should select ‘Yes’ in row 6 if your organization generated electricity, heat, steam, or cooling in the reporting year, regardless of whether this generation was consumed, exported, or wasted.
Explanation of terms
- Excluding feedstocks: Fuels consumed as feedstocks are fuels that are not combusted for energy purposes. For example, naphtha and ethane are feedstocks that may be converted into petrochemical products such as ethylene, and should not be included. The steel industry is a special case because coke and fuel injectants consumed at the blast furnace serve as feedstocks and a source of energy. These fuels are considered feedstocks and should not be counted. However, all fuels consumed that are derived from fuel feedstocks, e.g. blast furnace gas, coke oven gas, and smelting reduction gas, should be counted. Companies that consume fuel as feedstocks will have the opportunity to disclose these fuels in sector specific questions.
- Purchased or acquired electricity, steam, heat, cooling: Specific information on these energy carriers can be found in section 5.3.1 and Appendix A of the GHG Protocol Scope 2 Guidance. The terms ‘purchased’ and ‘acquired’ are used when your organization has received the energy from a third party. This rules out energy that is sourced from within the organizational/sector boundary. It should be noted that purchased or acquired heat does not include the heat content, or calorific value, of fuels that are purchased or acquired by the organization. This is accounted for at the point of fuel consumption, which falls inside the Scope 1 boundary. You should also be aware that steam, heat or cooling received via direct line as ‘waste’ from an industrial process, should still be accounted for if it is consumed.
(C8.2a) Report your organization’s energy consumption totals (excluding feedstocks) in MWh.
Question dependencies
This question only appears if you select “Yes” to any of the activities listed in C8.2. A row will appear in this table for each energy-related activity selected in C8.2. The "Total energy consumption" row will always appear.
Change from last year
No change
Rationale
Given the importance of energy consumption in emissions accounting, this question attempts to provide transparency to data users on the consumption of energy by the organization. The question provides the opportunity for organizations to disclose their total energy consumption and distinguish renewable and non-renewable forms of energy.
Connection to other frameworks
SDG
Goal 7: Affordable and clean energy
Goal 12: Responsible consumption and production
Goal 13: Climate action
S&P Global Corporate Sustainability Assessment
Energy Consumption
Renewable Energy Consumption
Response options
Please complete the following table:
| Activity
|
Heating value
|
MWh from renewable sources
|
MWh from non-renewable sources
|
Total (renewable + non-renewable) MWh
|
|
Consumption of fuel (excluding feedstock)
|
Select from:
- LHV
(lower heating value)
- HHV (higher heating value)
- Unable to confirm heating value
|
Numerical field [enter a number from 0 to 9,999,999,999 using up to 2 decimal places and no commas]
|
Numerical field [enter a number from 0 to 9,999,999,999 using up to 2 decimal places and no commas]
|
Numerical field [enter a number from 0 to 9,999,999,999 using up to 2 decimal places and no commas]
|
|
Consumption of purchased or acquired electricity
|
N/A
|
|
|
|
|
Consumption of purchased or acquired heat
|
N/A
|
|
|
|
|
Consumption of purchased or acquired steam
|
N/A
|
|
|
|
|
Consumption of purchased or acquired cooling
|
N/A
|
|
|
|
|
Consumption of self-generated non-fuel renewable energy
|
N/A
|
|
N/A
|
|
|
Total energy consumption
|
N/A
|
|
|
|
Requested content
General
- Figures you provide should be for the reporting year only (as defined by your answer to C0.2).
- If you have reported a market-based Scope 2 figure in question C6.3, you should use the market-based approach to calculate the share of renewable energy consumed in this question. This should be based on the same data sources as your applied emission factors and should be consistent with the market-based Scope 2 emission factor hierarchy. For example, if you purchased Energy Attribute Certificates (EACs) to claim half of your electricity consumption as renewable, you will need to use the relevant data source(s) from the emission factor hierarchy (e.g. residual mix data) to work out the share of renewables in the remaining half.
- If you have only reported a location-based Scope 2 figure in question C6.3, you should use the location-based approach to calculate the share of renewable energy consumed in this question using the location-based Scope 2 emission factor hierarchy.
- If you do not consume an energy carrier, then you should enter zero (0) in the relevant field.
- This table is for gross energy consumption data only. You should not provide net consumption nor deduct for energy produced or exported from the organizational boundary. Because feedstock fuels are excluded from this question, this approach should not lead to double counting.
- You should enter all energy data in Mega-Watt-hours (MWh). If your raw data is in energy units other than MWh, such as Giga-Joules (GJ) or British Thermal Units (Btu), then you should convert to MWh. For e.g., 1 Giga-Joule (GJ) = 0.277778 MWh, so if your data is in GJ then should multiply your data by 0.277778. If your data is in million Btu, then you need to multiply your data by 0.29307.
- Conversion factors from other energy units are available from a variety of online calculation tools, including from IEA and OnlineConversion.com, or from conversion tables such as those in EPA AP-42 (Annex A).
- If your raw data is in volume units, e.g. cubic feet or gallons, or in mass units, e.g. kilograms (kg) or pounds (lb), then you should convert to energy units using factors for fuel heating/calorific values. These are available from numerous sources, some of which are listed below:
- IPCC Guidelines for National GHG Inventories (Volume 2, Table 1.2, p1.18-1.19)
- EPA AP-42 (Annex A)
- IEA Statistics Manual (Annex 3, p180-183)
- API Compendium (Table 3-8, p3.20-3.21)
- Further guidance on unit conversion is available in the following Technical Note: “Conversion of fuel data to MWh”.
- Leaving a response blank is interpreted as non-disclosure. For numerical fields, values of zero imply a measurement has been made, and the value is zero. For numerical fields where no measurement has been made, please leave the field blank.
Activity (column 1)
- This column is driven by the activities for which you selected ‘Yes’ in response to C8.2.
Consumption of fuel (excluding feedstock)
- All fuel consumed for energy purposes inside the organizational boundary should be included, regardless of whether the fuel was purchased or produced by the organization. If a fuel is consumed as a feedstock for the production of another fuel, then the feedstock should not be included, but combustion of the produced fuel should be included. Ultimately, if a fuel is combusted, i.e. consumed for energy purposes and not as a feedstock, then it should be included (see ‘Explanation of terms’ for more detail).
- Consumption of renewable fuels should be accounted for here. This includes biomass (solid and liquid biofuels and biogas), biomass-derived wastes and renewably derived hydrogen.
- If you do not have exact consumption data, you may alternatively estimate your company’s consumption by reviewing fuel and energy purchasing orders.
Consumption of purchased or acquired electricity, heat, steam, cooling
- If your raw data for steam is in physical units, e.g. pounds (lb) or kilograms (kg), then you should convert to energy units. The energy content of steam varies with temperature and pressure. Organizations can refer to The Climate Registry’s General Reporting Protocol, Chapter 15, section 15.2, step 1, which explains how to calculate the energy content of steam.
- Cooling is frequently purchased in refrigeration-ton hours; 1 ton-hour is equal to 12,000 Btu, which is equal to 0.003516 MWh.
Consumption of self-generated non-fuel renewable energy
- If your organization produces renewable energy that is not based on fuel (such as solar, wind, hydro, geothermal, marine), then any consumption of this energy should be entered here.
- Consumption of renewable fuels (such as solid and liquid biofuels and biogas) should be excluded because these should be accounted for in the row “Consumption of fuel (excluding feedstock)”.
- All forms of non-fuel renewable energy - electricity, heat, steam, or cooling – shall be included.
Total energy consumption
- Enter the total energy consumption by your organization in this row, alongside total energy from renewable sources and non-renewable sources.
- The sum of renewable and non-renewable energy consumption should equal the total MWh entered in the last column.
- The data entered in each column of this row should also equal the sum of all the above rows (if the above rows have been fully disclosed for).
- If you do not disclose data for specific energy carriers in the rows above, but you are able to enter the total energy consumed by your organization, then you should do so.
Heating value (column 2)
- This column is only applicable to the consumption of fuels because it is a measure of combustion energy.
- Energy from fuel combustion can be measured by the higher heating value (HHV) or lower heating value (LHV) of the combusted fuel.
- Higher heating value (HHV) is also known as gross calorific value (GCV), and lower heating value (LHV) is also known as net calorific value (NCV). Typically, LHV/HHV ratio is 0.95 for solid and liquid hydrocarbon fuels, such as coal and oil, and 0.9 for gaseous hydrocarbon fuels, such as natural gas.
- Fuel energy data in HHV is typically used in the United States and Canada, whereas LHV is more commonly the unit used in other countries/areas and by international bodies. If you do not know the unit applicable to your raw data, you may wish to infer it based on the location from which the data is sourced, i.e. if the fuel related data is sourced from outside of the United States and Canada, then it is likely that LHV is applicable.
MWh from renewable sources (column 3)
- Renewable energy is energy taken from sources that are inexhaustible such as wind, solar, hydropower, geothermal, biomass and marine (tidal and wave energy).
- Waste energy should not be included if it is derived from fossil fuels.
- Hydrogen should not be included if it is derived from fossil fuels.
- Blended fuels deriving from both renewable and non-renewable sources should be split by the proportion contained from each source. For municipal waste and refuse-derived fuel, only the fraction of the fuel that is derived from biomass can be included as renewable energy, when calculating renewable energy consumption totals. Further explanations of municipal waste and a glossary of fuel definitions is provided in the CDP Technical Note: “Fuel Definitions”.
MWh from non-renewable sources (column 4)
- All energy not identified as deriving from renewable sources should be entered, e.g. coal, oil, natural gas, etc.
- Direct consumption of nuclear fuel should not be included, as this is covered in more detail in questions for electric utilities. Consumption of purchased or acquired electricity, steam, heat and/or cooling from nuclear sources, however, should be included.
Total (renewable + non-renewable) MWh (column 5)
- Total MWh is equal to the sum of MWh from renewable sources (column 3) and MWh from non-renewable sources (column 4).If you have entered data in column 3 and column 4, then you should ensure that the sum of this data is equal to the data in column 5.
Explanation of terms
- Renewable energy: CDP follows the definition of renewable energy given in the GHG Protocol, i.e. “energy taken from sources that are inexhaustible, e.g. wind, water, solar, geothermal energy and biofuels.”
- Excluding feedstocks: Fuels consumed as feedstocks are fuels that are not combusted for energy purposes. For example, naphtha and ethane are feedstocks that may be converted into petrochemical products such as ethylene, and should not be included. The steel industry is a special case because coke and fuel injectants consumed at the blast furnace serve as feedstocks and a source of energy. These fuels are considered feedstocks and should not be counted. However, all fuels consumed for energy, i.e. combusted, that are derived from fuel feedstocks, e.g. blast furnace gas, coke oven gas, and smelting reduction gas, should be counted. Companies that consume fuel as feedstocks will have the opportunity to disclose these fuels in sector specific questions.
- Heating Value: Lower heating value (LHV) and Higher heating value (HHV), also known as net calorific value (NCV) and gross calorific value (GCV) respectively, are different measures of heat energy released from fuel combustion. Figures measured in HHV are larger because HHV includes the latent heat of water vaporization from combustion, whereas LHV does not. The difference between LHV and HHV is related to the fuel’s hydrogen content.
- Purchased or acquired electricity, steam, heat, cooling: Specific information on these energy carriers can be found in section 5.3.1 and Appendix A of the GHG Protocol Scope 2 Guidance. The terms ‘purchased’ and ‘acquired’ are used when your organization has received the energy from a third party. This rules out energy that is sourced from within the organizational boundary. It should be noted that purchased or acquired heat does not include the heat content, or calorific value, of fuels that are purchased or acquired by the organization. This is accounted for at the point of fuel consumption, which falls inside the Scope 1 boundary. You should also be aware that steam, heat or cooling received via direct line as ‘waste’ from a third party’s industrial processes, should still be accounted for if it is consumed.
(C8.2b) Select the applications of your organization’s consumption of fuel.
Question dependencies
This question only appears if you select "Yes" to “Consumption of fuel (excluding feedstock)” in response to C8.2. Each option that you select in this table will appear as an additional column in C8.2c.
Change from last year
No change
Rationale
Scope 1 greenhouse gas emissions are directly associated with the consumption of fuel. This question provides data users with more transparency regarding the application of an organization’s fuel consumption for the generation of secondary energy carriers.
Response options
Please complete the following table:
| Fuel application
|
Indicate whether your organization undertakes this fuel application
|
|
Consumption of fuel for the generation of electricity
|
Select from:
|
| Consumption of fuel for the generation of heat
|
|
|
Consumption of fuel for the generation of steam
|
|
|
Consumption of fuel for the generation of cooling
|
|
Consumption of fuel for co-generation or tri-generation
|
|
Requested content
General
- Information you provide should be for the reporting year only (as defined by your answer to C0.2).
- This question drives the columns presented in question C8.2c.
- Select the fuel applications for which your organization consumes fuel by selecting “Yes” in the relevant fields.
- If your organization does not undertake a particular fuel application, select “No” in that row. If no fuel application is selected in C8.2b then only the “Total MWh consumed by the organization” column will appear in C8.2c which is where you will state your total fuel consumption for each applicable fuel.
- Companies who consume fuel for other applications such as transportation, industrial process plant and equipment etc. should select ‘Consumption of fuel for the generation of heat’.
- It does not matter whether your organization consumes or exports the electricity, steam, or cooling generated; if your organization generates any electricity, steam, or cooling from fuel combustion (thermal generation), then you should select ‘Yes’ in the relevant field.
- Co-generation is also known as combined heat and power (CHP). Tri-generation is also known as combined cooling, heat and power (CCHP). Combined cooling and power (CCP) is another system in which energy carriers are generated together. If your organization generates from any single configuration of plant in which electricity, steam, heat, or cooling are generated as simultaneous useful outputs, then you should select ‘Yes’ for the consumption of fuel for co-generation or tri-generation.
(C8.2c) State how much fuel in MWh your
organization has consumed (excluding feedstocks) by fuel type.
Question dependencies
This question only appears if you select “Consumption of fuel (excluding feedstock)” in C8.2. For each fuel application selected in C8.2b a column appears in the table in addition to the “MWh fuel consumed for self-generation of heat” and “Total MWh consumed by the organization” columns. If no fuel application or only "Consumption of fuel for the generation of heat" is selected in C8.2b then only the “Total MWh consumed by the organization” column will appear.
Change from last year
No change
Rationale
Scope 1 greenhouse gas emissions are directly associated with the consumption of fuel for energy purposes. This question provides data users with more transparency regarding the type of fuel an organization has consumed. Total consumption of fuels and their consumption for different energy applications also provides insight on the way in which fuels are used by the organization, which can allow for a fairer and more consistent understanding of corporate energy and emissions from data users.
Connection to other frameworks
SDG
Goal 7: Affordable and clean energy
Goal 13: Climate action
Response options
Please complete the following table.
| Fuels (excluding feedstocks) |
Heating value
|
Total fuel MWh consumed by the organization
|
MWh fuel consumed for self-generation of electricity*
|
MWh fuel consumed for self-generation of heat*
|
MWh fuel consumed for self-generation of steam*
|
MWh fuel consumed for self-generation of cooling*
|
MWh fuel consumed for self- cogeneration or self-trigeneration*
|
Comment
|
|
Sustainable biomass
|
Select from:
- LHV
- HHV
- Unable to confirm heating value
|
Numerical field [enter a number from 0 to 9,999,999,999 using up to 2 decimal places and no commas]
|
Numerical field [enter a number from 0 to 9,999,999,999 using up to 2 decimal places and no commas]
|
Numerical field [enter a number from 0 to 9,999,999,999 using up to 2 decimal places and no commas]
|
Numerical field [enter a number from 0 to 9,999,999,999 using up to 2 decimal places and no commas]
|
Numerical field [enter a number from 0 to 9,999,999,999 using up to 2 decimal places and no commas]
|
Numerical field [enter a number from 0 to 9,999,999,999 using up to 2 decimal places and no commas]
|
Text field [maximum 2,400 characters]
|
| Other biomass
|
|
|
|
|
|
|
|
|
| Other renewable fuels (e.g. renewable hydrogen)
|
|
|
|
|
|
|
|
|
| Coal
|
|
|
|
|
|
|
|
|
| Oil
|
|
|
|
|
|
|
|
|
| Gas
|
|
|
|
|
|
|
|
|
| Other non-renewable fuels (e.g. non-renewable hydrogen)
|
|
|
|
|
|
|
|
|
| Total fuel
|
|
|
|
|
|
|
|
|
[Fixed Row]
Requested content
General
- Complete all the cells within the table. Do not leave blanks.
- Figures you provide should be for the reporting year only (as defined by your answer to C0.2).
- You should provide information for all fuel (excluding feedstocks) consumed by your organization in the reporting year. Therefore, the sum of all rows for column 3 (total MWh consumed by the organization) should equal the total consumption of fuel (excluding feedstock) in MWh (from renewable and non-renewable sources) as reported in C8.2a.
- Fuel consumed for generation is fuel consumed for ‘self-generation’. Self-generation means generation from inside the organizational boundary. This includes all generation plant owned or controlled by the organization. Do not provide information for fuel consumed by another organization for the generation of electricity, steam, heat, and cooling that your organization has purchased or acquired.
- This table is for gross fuel consumption data only. You should not provide net consumption nor deduct for energy produced and exported from the organizational boundary. Because feedstock fuels are excluded from this question, this approach should not lead to double counting.
- All fuel consumed inside the organizational boundary should be included, regardless of whether the fuel was purchased or produced by the organization. If a fuel is consumed as a feedstock for the production of another fuel, then the feedstock should not be included, but combustion of the produced fuel should be included. Ultimately, if a fuel is combusted, e.g. consumed for energy purposes and not as a feedstock, then it should be included (see "Explanation of terms" for more detail).
- Companies who consume fuel for electricity, steam, and/ or cooling applications and who consume fuel for other applications (i.e. transportation, industrial process plant and equipment etc.) should report the MWh of fuel consumed for these other applications in column 5 ‘MWh fuel consumed for self-generation of heat’.
- If you do not have exact consumption data, you may alternatively estimate your company’s consumption by reviewing fuel and energy purchasing orders.
- If your raw data is in energy units other than MWh, such as Giga-Joules (GJ) or British Thermal Units (Btu), then you should convert to MWh. For example, 1 Giga-Joule (GJ) = 0.277778 MWh, so if your data is in GJ then should multiply your data by 0.277778. If your data is in million Btu, then you should multiply your data by 0.29307.
- If your raw data is in volume units, e.g. cubic feet or gallons, or in mass units, e.g. kilograms (kg) or pounds (lb), then you should convert to energy units using fuel heating/calorific values. These are available from numerous sources, some of which are listed below:
- IPCC Guidelines for National GHG Inventories (Volume 2, Table 1.2, p1.18-1.19)
- EPA AP-42 (Annex A)
- IEA Statistics Manual (Annex 3, p180-183)
- API Compendium (Table 3-8, p3.20-3.21)
- Further guidance on unit conversion is available in the following Technical Note: “Conversion of fuel data to MWh” and a glossary of definitions on some fuels is provided in Technical Notes: “Fuel Definitions”.
- If you want to provide additional information on the methods or assumptions used to determine the breakdown of fuel consumed for the self-generation of electricity/heat/steam/cooling/self-cogeneration or self-trigeneration then please do so in the Comment column.
Fuels (excluding feedstocks) (column 1)
- Please refer to the CDP Technical note on Biofuels for guidance on biomass/biofuel sustainability. If you report information in the “Sustainable biomass” row, provide the criteria used to classify the biomass as sustainable (e.g. certification) in the “Comment” column (column 9).
- “Other renewable fuels” and “Other non-renewable fuels” are aggregations of any other renewable and non-renewable fuels you consume that do not fit within the categories of fuels listed.
- If you have not consumed any fuels within a category in the reporting year, select a heating value and then enter 0 in the subsequent columns.
Heating value (column 2)
- Fuel should be reported consistently in either LHV or HHV.
- Your choice of HHV or LHV should be consistent with your choice in C8.2a.
- Higher heating value (HHV) is also known as gross calorific value (GCV), and lower heating value (LHV) is also known as net calorific value (NCV). Typically, LHV/HHV ratio is 0.95 for solid and liquid hydrocarbon fuels, such as coal and oil, and 0.9 for gaseous hydrocarbon fuels, such as natural gas.
- Fuel energy data in HHV is typically used in the United States and Canada, whereas LHV is more commonly the unit used in other countries/areas and by international bodies. If you do not know the unit applicable to your raw data, you may wish to infer it based on the location from which the data is sourced, i.e. if the fuel related data is sourced from outside of the United States and Canada, then it is likely that LHV is applicable.
Total MWh fuel consumed by the organization (column 3)
- Enter the total fuel in MWh consumed by your organization in the reporting year for the category of fuel in column 1. It should be equal to the sum of fuel consumed for the self-generation of electricity, heat, cooling, steam and/or cogeneration or trigeneration.
MWh fuel consumed for self-generation of electricity (column 4)
- Enter in MWh the total consumption of fuel within the category in column 1 for the self-generation of electricity.
- Make sure that you do not enter data for the actual electricity generated from these fuels. This table is for the consumption of the fuels themselves and aims to capture the energy content of the initial fuel used, not the energy content of the electricity generated from these fuels.
MWh fuel consumed for self-generation of heat (column 5)
- This column will be presented if you selected “Yes” for any fuel application in C8.2b except if you selected only “Consumption of fuel for the generation of heat”. This is because combustion reactions are exothermic and thus generate heat in addition to any secondary energy carrier generated (electricity, steam, and/or cooling).
- This column is not presented if only “Consumption of fuel for the generation of heat” is selected in C8.2b, because in this case the “MWh fuel consumed for self-generation of heat” will be equal to the “Total fuel MWh consumed by the organization”.
- Enter in MWh the total consumption of fuel within the category in column 1 for the self-generation of heat.
- Fuel consumed for heat is fuel that is combusted for the direct use of the heat/thermal energy its combustion releases.
- This heat is used in applications such as direct heating for industrial process plant and equipment, engines, turbines, furnaces, heaters, stoves, incinerators, kilns, dryers, thermal oxidizers, space heating, open burning, flaring, or any other combustion that is not for the generation of secondary energy carriers (electricity, steam, and/or cooling).
- Do not enter the heat delivered for the application. This question asks for fuel energy, which is the total heat of fuel combustion and is equal to the heating value (or calorific value) of the fuels themselves.
MWh fuel consumed for self-generation of steam (column 6)
- Enter in MWh the total consumption of fuel within the category in column 1 for the self-generation of steam. This excludes fuel consumed for steam generated in cogeneration or trigeneration plant.
MWh fuel consumed for self-generation of cooling (column 7)
- Enter in MWh the total consumption of fuel within the category in column 1 for the self-generation of cooling. This excludes fuel consumed for cooling generated in cogeneration or trigeneration plant.
MWh fuel consumed for self-cogeneration or self-trigeneration (column 8)
- Enter in MWh the total consumption of fuel within the category in column 1 for self-cogeneration or self-trigeneration.
Comment (column 9) (optional)
- Any further information about the data provided may be entered here.
- For example, you may comment on the specific fuels consumed within each category in column 1.
- If you report information in the “Sustainable biomass” row, provide the criteria used to classify the biomass as sustainable (e.g. certification).
Explanation of terms
- Excluding feedstocks: Fuels consumed as feedstocks are fuels that are not combusted for energy purposes. For example, naphtha and ethane are feedstocks that may be converted into petrochemical products such as ethylene, and should not be included. The steel industry is a special case because coke and fuel injectants consumed at the blast furnace serve as feedstocks and a source of energy. These fuels are considered feedstocks and should not be counted. However, all fuels consumed for energy, i.e. combusted, that are derived from fuel feedstocks, e.g. blast furnace gas, coke oven gas, and smelting reduction gas, should be counted. Companies that consume fuel as feedstocks will have the opportunity to disclose these fuels in sector specific questions.
- Heating Value: Lower heating value (LHV) and Higher heating value (HHV), also known as net calorific value (NCV) and gross calorific value (GCV) respectively, are different measures of heat energy released from fuel combustion. Figures measured in HHV are larger because HHV includes the latent heat of water vaporization from combustion, whereas LHV does not. The difference between LHV and HHV is related to the fuel’s hydrogen content.
- Biomass: any organic matter, i.e. biological material, available on a renewable basis. Includes feedstock derived from animals or plants, such as wood and agricultural crops, and organic waste from municipal and industrial sources. Biomass fuels should be sustainably sourced and certified where possible, and include:
- Solid biofuels - solid fuels derived from biomass. Includes feedstock derived from animals or plants, such as wood and agricultural crops, and organic waste from municipal and industrial sources.
- Biogas - a mixture of methane (CH4) and carbon dioxide (CO2) used as fuel and produced by bacterial degradation of organic matter or through gasification of biomass.
- Liquid biofuels - liquid fuels derived from biomass such as ethanol and biodiesel.
(C8.2d) Provide details on the electricity, heat, steam, and cooling your organization has generated and consumed in the reporting year.
Question Dependencies
This question only appears if you select “Generation of electricity, heat, steam, or cooling” in response to C8.2.
Change from last year
No change
Rationale
Many organizations generate their own electricity, steam, heat, and/or cooling. Bringing the generation of these secondary energy carriers inside the organizational boundary has the effect of reducing an organization’s Scope 2 emissions while increasing Scope 1 emissions. Because the scale of self-generation can be highly variable, this can create additional uncertainty for data users when comparing Scope 1 and 2 emissions across company samples or portfolios. CDP aims to alleviate this distorting factor by bringing transparency on the extent of self-generation by organizations.
Connection to other frameworks
SDG
Goal 7: Affordable and clean energy
Goal 12: Responsible consumption and production
Goal 13: Climate action
Response options
Please complete the following table:
| Energy Carrier
|
Total Gross generation (MWh)
|
Generation that is consumed by the organization (MWh)
|
Gross generation from renewable sources (MWh)
|
Generation from renewable sources that is consumed by the organization (MWh)
|
|
Electricity
|
Numerical field [enter a number from 0 to 999,999,999 using up to 2 decimal places and no commas]
|
Numerical field [enter a number from 0 to 999,999,999 using up to 2 decimal places and no commas]
|
Numerical field [enter a number from 0 to 999,999,999 using up to 2 decimal places and no commas]
|
Numerical field [enter a number from 0 to 999,999,999 using up to 2 decimal places and no commas]
|
|
Heat
|
|
|
|
|
|
Steam
|
|
|
|
|
|
Cooling
|
|
|
|
|
Requested content
General
- Figures you provide should be for the reporting year only (as defined by your answer to C0.2).
- If you do not have any activity then you should enter zero (0) in the relevant field.
- Enter all energy data in Mega-Watt-hours (MWh). Conversion factors from other energy units are available from a variety of online calculation tools, including from IEA and OnlineConversion.com, or from conversion tables such as those in EPA AP-42 (Annex A)
- Further guidance on unit conversion is available in the following Technical Note: “Conversion of fuel data to MWh”.
- Nuclear power generation is not to be included for this question, as nuclear power is covered in more detail in questions for electric utilities.
- Fuel consumption data provided in C8.2c is split by their use in the generation of energy carriers that are also listed in this question, e.g. ‘fuel consumed for the generation of electricity’, with the exception of heat. The heat referred to in this question includes heat only where it can be measured in the form of transferrable mediums, e.g. hot water. In reality, the proportion of fuel combustion heat made available for use in applications (after losses) may be difficult to measure or would require detailed process monitoring equipment readings. You should only account for heat generated in transferable mediums, i.e. the forms of heat that may also be purchased or acquired from third parties (as listed in question C8.2a).
Total Gross generation (MWh) (column 2)
- Enter the total gross generation of electricity, heat, steam and/or cooling in MWh produced by facilities or installations inside your organizational boundary during the reporting year.
- Gross generation should be reported, where 'Gross' covers the total output from all generating installations or facilities without deducting for electricity, steam, heat, or cooling used by the generating plant or facility for the purpose of the generation.
- Include electricity, heat, steam and/or cooling you produced from both renewable sources and non-renewables sources.
- Include electricity, heat, steam and/or cooling that you produced and did not consume, as well as the amount you did consume.
Generation that is consumed by the organization (MWh) (column 3)
- Enter the amount of your organization’s generation of electricity, heat, steam, and/or cooling in MWh that your organization has consumed in the reporting year.
- This column is a subset of column 2; the amount entered cannot be higher than the amount entered in column 2. If the entered amount is equal to the amount in column 2, then your organization consumed (or wasted) all of the electricity, steam, heat, or cooling that your organization generated.
Gross generation from renewable sources (MWh) (column 4)
- Enter the total gross generation of electricity, heat, steam and/or cooling in MWh produced from renewable sources by facilities or installations inside your organizational boundary during the reporting year.
- Include electricity, heat, steam and/or cooling that you produced from renewable sources and did not consume, as well as the amount you did consume.
Generation from renewable sources that is consumed by the organization (MWh) (column 5)
- Enter the amount of your organization’s generation of electricity, heat, steam, and/or cooling in MWh from renewable sources that your organization has consumed in the reporting year.
- This column is a subset of column 4; the amount entered cannot be higher than the amount entered in column 4. If the entered amount is equal to the amount in column 4, then your organization consumed all of the electricity, steam, heat, or cooling that your organization generated from renewable sources.
- For reporting self-generated renewable electricity in markets where using electricity tracking systems or certificates are mandatory, a company shall generate Energy Attribute Certificates (such as REC) for all of the electricity generation and retain the certificates for all electricity that it wishes to report as consumed. To prove self-generation and consumption of renewable electricity from a facility that is entirely off-grid, and only connected by a direct line to consumer, certificates need not be produced. Meter readings shall constitute sufficient proof of consumption. However, any certificates produced shall be also retained or retired by the consumer.
Explanation of terms
- Gross generation: covers the total output from all generating installations or facilities without deducting for amount of generated electricity, steam, heat or cooling used by those installations or facilities for the purpose of generation. Deducting this self-consumption of output gives the net generation. To avoid double-counting, consumption of one energy carrier (i.e., electricity, heat, steam, or cooling) to produce another (i.e., electricity, heat, steam, or cooling) within the same installation should not be included. For example, the generation of steam which is consumed in a steam turbine for the generation of electricity should not be included.
- Renewable energy
sources:
CDP follows
the definition of renewable energy given in the GHG Protocol, i.e. “energy
taken from sources that are inexhaustible, e.g. wind, water, solar, geothermal
energy and biofuels.”
(C8.2e) Provide details on the electricity, heat, steam, and/or cooling amounts that were accounted for at a zero or near-zero emission factor in the market-based Scope 2 figure reported in C6.3.
Question dependencies
This question only appears if you select “We are reporting a Scope 2, market-based figure” in response to C6.2 and select “Yes” in C8.2 in any of the “Consumption of purchased or acquired [electricity/heat/steam/cooling]” rows. This question is not presented to RE100 members.
Change from last year
Modified question
Rationale
This question provides investors and data users with more transparency regarding organizations’ active sourcing of low-carbon energy.
Ambition: Companies choose impactful procurement options, that lead to new low-carbon or renewable energy capacity being brought into the grid, such as power purchase agreements.
Connection to other frameworks
SDG
Goal 7: Affordable and clean energy
Goal 12: Responsible consumption and production
Goal 13: Climate action
Response options
Please complete the following table. You are able to add rows by using the “Add Row” button at the bottom of the table.
| Country/area of low-carbon energy consumption | Sourcing method
|
Energy carrier
|
Low-carbon technology type
|
Low-carbon energy consumed via selected sourcing method in the reporting year (MWh)
|
Tracking instrument used
|
Country/area of origin (generation) of the low-carbon energy or energy attribute
|
Are you able to report the commissioning or re-powering year of the energy generation facility?
|
Commissioning year of the energy generation facility (e.g. date of first commercial operation or repowering)
|
Comment
|
Select from:
[Country/area drop-down list] |
Select from:
- None (no active purchases of low-carbon electricity, heat, steam or cooling)
- Purchase from an on-site installation owned by a third party (on-site PPA)
- Direct line to an off-site generator owned
by a third party with no grid transfers (direct line PPA)
- Physical power purchase agreement (physical PPA) with a grid-connected generator
- Financial (virtual) power purchase agreement (VPPA)
- Project-specific contract with an electricity supplier
- Retail supply contract with an electricity supplier (retail green electricity)
- Unbundled procurement of energy attribute certificates (EACs)
- Default delivered electricity from the grid (e.g. standard product offering by an energy supplier), supported by energy attribute certificates
- Default delivered electricity from the grid (e.g. standard product offering by an energy supplier) from a grid that is 95% or more low-carbon and where there is no mechanism for specifically allocating low-carbon electricity
- Heat/steam/cooling supply agreement
- Other, please specify
|
Select from:
- Electricity
- Heat
- Steam
- Cooling
- Heat, steam and cooling combined
|
Select from:
- Solar
- Wind
- Large hydropower (>25 MW)
- Small hydropower (<25 MW)
- Hydropower (capacity unknown)
- Nuclear
- Sustainable biomass
- Other biomass
- Renewable hydrogen fuel cell
- Marine
- Geothermal
- Fossil-fuel plants fitted with CCS
- Low-carbon energy mix, please specify
- Renewable energy mix, please specify
|
Numerical field [enter a number from 0 to 999,999,999,999 using up to 2 decimal places and no commas]
|
Select from:
- Contract
- GEC
- GO
- Indian REC
- I-REC
- J-Credit (Renewable)
- Korean REC
- Australian LGC
- NFC – Renewable
- NZREC
- REGO
- TIGR
- T-REC
- US-REC
- Other, please specify
- No instrument used
|
Select from:
[Country/area drop-down list]
|
Select from:
|
Numerical field [enter a number between 1900-2023]
|
Text field [maximum 2,500 characters]
|
[Add Row]
Requested content
General
- Note that all purchases of low-carbon energy (as defined in the "Explanation of terms") should be reported in this question, even if their associated emission factor is marginally above zero. Whereas most low-carbon technologies do not directly emit GHGs and are accounted for at a zero emission factor, some low-carbon technologies such as biomass and geothermal may have an emission factor that is low but above zero.
- To claim the use of renewable electricity, companies must source renewable electricity from within the boundary of the market in which they are consuming the electricity. For more information on the market boundary criteria please refer to the CDP Technical Note: Accounting of Scope 2 emissions.
- Different sourcing methods in the same country/area should be reported in separate rows. E.g. if you have a green electricity contract in India for one of your offices and purchased unbundled Indian RECs to cover the electricity consumption of another office, you should add a separate row for each sourcing method and select “India” in column 1 for both.
Country/area of low-carbon energy consumption (column 1)
- Select the country/area in which the sourced low-carbon energy has been consumed.
- For companies selecting “Default delivered electricity (e.g. standard product offering by an energy supplier) from a grid that is 95% or more low-carbon and where there is no mechanism for specifically allocating low-carbon electricity”, note that the country/area of consumption (this column) must be the same as the country/area of origin (column 7).
Sourcing method (column 2)
- Select the option that best describes the sourcing method that you use for low-carbon electricity, heat, steam and cooling:
- None (no active purchases of low-carbon electricity, heat, steam or cooling). Select this option if your company doesn’t actively purchase low-carbon electricity, heat, steam or cooling i.e. you do not have any contractual instruments (e.g. power purchase agreement, heat/steam supply agreement, energy attribute certificates, etc.) to claim low-carbon energy consumption. Note that companies with operations in a country/area with a grid that is more than 95% low-carbon and where there is no mechanism for specifically allocating low-carbon energy should refer to the option “Default delivered electricity (e.g. standard product offering by an energy supplier) from a grid that is 95% or more low-carbon and where there is no mechanism for specifically allocating low-carbon electricity” below.
- Purchase from an on-site installation owned by a third party (on-site PPA). This option refers to low-carbon electricity that is purchased by the company from on-site, behind the meter facilities owned and operated by a third-party supplier. The low-carbon electricity consumption claimed by a company using this option must be substantiated by an electricity supply contract with the supplier that conveys the project’s energy attributes.
- Direct line to an off-site generator owned by a third party with no grid transfers (direct line PPA). This option includes low-carbon electricity produced from off-site installations owned and operated by a third party and delivered to the company via a direct line, with no grid transfers. The low-carbon electricity consumption claimed by a company using this option must be backed by an electricity supply contract with the project owners and operators which conveys the project’s energy attributes.
- Physical power purchase agreement (physical PPA) with a grid-connected generator. A contract signed directly between the company consuming the electricity and a power generator. The contract ensures the purchase of electricity from a specific low-carbon electricity generator that is delivered through the local grid. The associated energy attributes must be conveyed within the contract.
- Financial (virtual) power purchase agreement (VPPA). A purely financial transaction between the company and a power generator, in which the company assumes market risk related to the sale of the generator’s electricity and receives energy attributes. The power generator sells the electricity into the local wholesale power market. The generator and the company then settle the difference between the variable wholesale market price and the contract strike price, and the company receives the certificates that are generated from the project. A VPPA is not an electricity supply contract (it only delivers energy attributes), meaning electricity is procured in a separate contract.
- Project-specific contract with an electricity supplier. An arrangement whereby an electricity supplier procures from specified projects on behalf of the company. Often, the supplier holds a power purchase agreement. The contract may be advertised as a ‘green tariff’ and has complete transparency regarding the energy attributes in the supply (meaning the company always knows exactly which specific projects they are purchasing from through their electricity supplier), and typically uses a longer contract length.
- Retail supply contract with an electricity supplier (retail green electricity). An ‘off-the-shelf’ arrangement with an electricity supplier for the supply of low-carbon electricity. The company usually pays a premium for the low-carbon electricity. This contract may be advertised as a ‘green electricity product’ and has less transparency than a project-specific contract regarding the energy attributes in the supply, and typically uses a shorter contract length. The supplier may vary the projects from which energy attributes are sourced throughout the contract.
- Unbundled procurement of energy attribute certificates (EACs). Unbundled energy attribute certificates (e.g. RECs, GOs, I-RECs etc.) are purchased through an energy supplier or other intermediaries. They are purchased separately from the electricity to match a company’s purchased electricity consumption, and exist only as the attributes of that electricity.
- Default delivered electricity from the grid (e.g. standard product offering by an energy supplier), supported by energy attribute certificates. This option refers to the share of low-carbon electricity in the grid mix that is delivered by the electricity-supplier as a default supply to the company, and where an equivalent amount of energy attribute certificates are retired by the utility/supplier on behalf of the purchasing company. This option includes low-carbon electricity supplied under a supplier mandate – a regulation requiring electricity suppliers to source a percentage of their supply from specified energy sources, e.g. Renewable Portfolio Standards in the US or Large-Scale Generation Certificates (LGCs) retired by suppliers in Australia under the Renewable Energy Target (RET). Companies should verify how their utility/supplier is complying with the mandate in the “Comment” column (column 10).
- Default delivered electricity (e.g. standard product offering by an energy supplier) from a grid that is 95% or more low-carbon and where there is no mechanism for specifically allocating low-carbon electricity. This option refers to the share of low-carbon electricity in the grid mix that is delivered by the utility/supplier as a default supply to the customer, where the default grid mix of low-carbon electricity (as per CDP’s definition of low-carbon in the “Explanation of terms”) is over 95% and where there is no mechanism for actively sourcing low-carbon electricity from the grid (i.e. energy attribute certificates or another attribute tracking system). This option only applies when the entire national grid is over 95% low-carbon. Some current examples include Paraguay, Uruguay, and Ethiopia, but the list of countries/areas is subject to change as the market and the grids evolve. Companies selecting this option should provide supporting information in the “Comment” column (column 10).
- Heat/steam/cooling supply agreement. A contract signed between the company consuming the heat/steam/cooling and a supplier who provides low-carbon heat/steam/cooling.
- Other, please specify. Other sourcing methods not mentioned above that have been used to account for electricity, heat, steam or cooling at a zero or near-zero emission factor may be reported if the contractual instruments comply with the Scope 2 Quality Criteria of the GHG Protocol Scope 2 guidance. For more information on this refer to CDP Technical Note: Accounting of Scope 2 emissions.
Low-carbon technology type (column 4)
- Select the low-carbon technology type specified in the contractual instrument.
- Please refer to the CDP Technical note on Biofuels for guidance on biomass/biofuel sustainability. If you select the option “Sustainable biomass”, provide the criteria used to classify the biomass as sustainable (e.g. certification) in the “Comment” column (column 10).
- If you select either biomass option, specify in column 10 “Comment” if the biomass technology type refers to bioenergy plants fitted with carbon capture and storage (BECCS).
- If you have sourced low-carbon electricity of multiple technology types, you are encouraged to report them in separate rows. If you are unable to disaggregate by technology type, select either “Low-carbon energy mix” or “Renewable electricity mix”. See the “Explanation of terms” for definitions of low-carbon and renewable energy.
- If you are buying green electricity products or any other instruments for blended electricity from various low-carbon or renewable sources, select either “Low-carbon energy mix” or “Renewable electricity mix”.
- Note that natural gas and fossil fuel-based combined heat and power (CHP) are not considered low-carbon technologies and should not be included here. For more information on CDP’s definition of low-carbon, please refer to the "Explanation of terms".
Low-carbon energy consumed via selected sourcing method in the reporting year (MWh) (column 5)
- Note that all purchases of low-carbon energy (as defined in the "Explanation of terms") should be reported in this question, even if their associated emission factor is marginally above zero.
- Quantify how much electricity, heat, steam or cooling (in MWh) has been consumed in the reporting year that corresponds to the sourcing method selected in column 1.
Tracking instrument used (column 6)
- In markets where no certificates are available, the tracking instrument may be just an electricity supply contract with the supplier. In this case, select “Contract”.
- If you select “Other, please specify” to report a tracking instrument not listed here, ensure that the instrument complies with the Scope 2 Quality Criteria of the GHG Protocol Scope 2 guidance and provide more information in the “Comment” column (column 10). For more information on this refer to the CDP Technical Note: Accounting of Scope 2 emissions.
Country/area of origin (generation) of the low-carbon energy or energy attribute (column 7)
- Select the country/area in which the sourced low-carbon energy was generated.
- Note that this is referring to the country/area where the renewable electricity was generated and/or the country/area where the purchased attribute certificates were generated from. E.g. if you have a PPA with a solar energy generator supported by Guarantees of Origin certificates from Spain to cover your consumption in Spain, Italy, and France, you should enter “Spain” as the country of origin for your consumption in Spain, Italy, and France.
- Claims to use of low-carbon electricity are only credible if they observe market boundaries. This means claims to use of low-carbon electricity must be based on generation of low-carbon electricity occurring in the same market for low-carbon electricity that the use itself is claimed in. Markets for low-carbon electricity are always countries’ geographic boundaries, except for the international single markets for low-carbon electricity recognized by CDP between the United States and Canada, and between European countries meeting the criteria outlined in Chapter 2.3 Claiming renewable electricity use: the market boundary criteria of the CDP Technical Note: Accounting of Scope 2 emissions.
- For companies selecting “Default delivered electricity (e.g. standard product offering by an energy supplier) from a grid that is 95% or more low-carbon and where there is no mechanism for specifically allocating low-carbon electricity”, note that the country/area of origin (this column) must be the same as the country/area of consumption (column 1).
Are you able to report the commissioning or re-powering year of the energy generation facility? (column 8)
- This refers to the year when the power plant went in operation or if the facility was re-powered, the year of re-powering.
- If the commissioning or re-powering year information is not provided in your contract, contact your supplier to request this information.
- If you wish to report multiple generation facilities with a mix of known/unknown commissioning/re-powering dates, you should report the known and unknown facilities in separate rows, selecting “Yes” or “No” in this column accordingly.
Commissioning year of the energy generation facility (column 9)
- This column only appears if you select “Yes” in column 8 “Are you able to report the commissioning or re-powering year of the energy generation facility?”.
- If you are reporting multiple generation facilities in a single row (e.g., if you are unable/do not wish to disaggregate the supply by commissioning year), enter the commissioning/re-powering year of the oldest generation facility in the supply.
Comment (column 10) (optional)
- You may provide an accompanying narrative to your disclosure.
- If you selected “Other, please specify” in column “Sourcing method” you may provide more details on the sourcing method you are reporting and explain how the contractual instrument complies with the Scope 2 Quality Criteria of the GHG Protocol Scope 2 guidance.
- If you selected “Default delivered electricity (e.g. standard product offering by an energy supplier) from a grid that is 95% or more low-carbon and where there is no mechanism for specifically allocating low-carbon electricity”, provide supporting information on the grid mix of the country/area selected in columns 1 and 7.
- If you select the option “Sustainable biomass” in column “Low-carbon technology type” (column 4), provide the criteria used to classify the biomass as sustainable (e.g. certification).
- If you select either biomass option in column “Low-carbon technology type” (column 4), specify if the biomass technology type refers to bioenergy plants fitted with carbon capture and storage (BECCS).
Explanation of terms
- Attribute: Descriptive or performance characteristics of a particular generation resource. For Scope 2 GHG accounting, the GHG emission rate attribute of the energy generation is required to be included in a contractual instrument in order to make a claim.
- Contractual instrument (or ‘instrument’): Any type of contract between two parties for the sale and purchase of energy bundled with attributes about the energy generation, or for unbundled attribute claims. Markets differ as to what contractual instruments are commonly available or used by companies to purchase energy or claim specific attributes about it, but they can include energy attribute certificates (e.g. RECs, GOs), direct contracts (PPAs), green tariffs and other instruments.
- Energy attribute certificate: A category of contractual instruments used in the energy sector to convey information about energy generation to other entities involved in the sale, distribution, consumption, or regulation of electricity.
- Unbundled energy attribute certificate: An energy attribute certificate that is separate, and may be traded separately, from the underlying energy produced.
- Low-carbon energy: in line with the IEA definition, low-carbon technologies are technologies that produce low – or zero – greenhouse-gas emissions while operating. In the power sector this includes fossil-fuel plants fitted with carbon capture and storage, nuclear plants and renewable-based generation technologies. Natural gas, combined cycle gas turbine and fossil fuel-based combined heat and power (cogeneration), despite being less carbon intensive than other means of electricity production like coal, are not considered low-carbon.
- Renewable energy: CDP follows the definition of renewable energy given in the GHG Protocol, i.e. “energy taken from sources that are inexhaustible, e.g. wind, water, solar, geothermal energy and biofuels.”
- Biomass: any organic matter, i.e. biological material, available on a renewable basis. Includes feedstock derived from animals or plants, such as wood and agricultural crops, and organic waste from municipal and industrial sources. Biomass fuels should be sustainably sourced and certified where possible, and include:
- Solid biofuels - solid fuels derived from
biomass. Includes feedstock derived from animals or plants, such as wood and
agricultural crops, and organic waste from municipal and industrial sources.
- Biogas - a mixture of methane (CH4) and
carbon dioxide (CO2) used as fuel and produced by bacterial degradation of
organic matter or through gasification of biomass.
- Liquid biofuels - liquid fuels derived from biomass such as ethanol and biodiesel.
- Impactful electricity procurement: an electricity sourcing strategy which accelerates the transition to zero-carbon grids, either directly, by contributing to bringing new low-carbon or renewable capacity into the grid, or indirectly, through signals sent to markets and policymakers by a company’s demand for voluntarily procured low-carbon and renewable electricity.
Example response
| Country/area of low-carbon energy consumption
|
Sourcing method
|
Energy carrier
|
Low-carbon technology type
|
Low- carbon energy consumed via selected sourcing method in the reporting year (MWh)
|
| Peru |
Unbundled procurement of energy attribute certificates (EACs) |
Electricity
|
Solar
|
1000
|
| USA
|
Physical power purchase agreement (physical PPA) with a grid-connected generator |
Electricity
|
Wind
|
3500
|
Tracking instrument used
|
Country/area of origin (generation) of the low-carbon energy or energy attribute
| Are you able to report the commissioning or re-powering year of the energy generation facility? |
Commissioning year of the energy generation facility
|
Comment
|
I-REC
|
Peru | No |
N/A |
Our operations in Peru have purchased I-RECs to cover their entire electricity consumption during the reporting year
|
| REC
|
USA
| Yes |
2013
|
Our operations in the USA have signed a PPA with a wind farm project to cover part of the electricity consumption during the period. From the project they receive RECs which are all Green-e certified.
|
(C8.2g) Provide a breakdown by country/area of your non-fuel energy consumption in the reporting year.
Change from last year
Modified question
Rationale
Breaking down energy consumption to the country/area level is useful to data users as this is often the level at which energy-related legislation is introduced. Data from this question can help state, region and sub-national bodies guide the development of energy-related legislation.
Ambition: Companies provide a comprehensive account of their energy consumption, including a breakdown by country/area for transparency.
Connection to other frameworks
SDG
Goal 7: Affordable and clean energy
Goal 13: Climate action
RE100
Response options
Please complete the following table. You are able to add rows by using the “Add Row” button at the bottom of the table.
*Column presented to RE100 members only.
| Country/area
|
Consumption of purchased electricity (MWh)
|
Consumption of self-generated electricity (MWh)
|
Is this electricity consumption excluded from your RE100 commitment?*
|
Consumption of purchased heat, steam, and cooling (MWh)
|
Consumption of self-generated heat, steam, and cooling (MWh)
|
Total non-fuel energy consumption (MWh) [Auto-calculated]
|
Select from:
[Country/area drop-down list]
|
Numerical field [enter a number from 0-999,999,999,999 using a maximum of 2 decimal places]
|
Numerical field [enter a number from 0-999,999,999,999 using a maximum of 2 decimal places]
|
Select from:
|
Numerical field [enter a number from 0-999,999,999,999 using a maximum of 2 decimal places]
|
Numerical field [enter a number from 0-999,999,999,999 using a maximum of 2 decimal places]
|
Numerical field [0-999,999,999,999]
|
[Add row]
Requested content
General
- You should include consumption from both purchased/acquired energy and self-generated energy in this question. Energy that is purchased but not physically consumed (e.g. traded power, financial instruments), or energy that is self-generated but not physically consumed, should not be included here.
- Energy consumption figures should be for the reporting year only (as defined by your answer to C0.2).
- If you are a member of the RE100 initiative, the loads that your organization may have chosen to exclude from the boundary of its RE100 target under the RE100 materiality threshold provisions (see Section Six: Additional provisions in the RE100 technical criteria) must still be reported in this question, using column 4 to identify where the materiality threshold provisions have been applied.
Country/area (column 1)
- Select a country/area in accordance with CDP's Technical Note on “Countries, Areas and Regions”.
- For countries such as the USA, Canada, or Brazil where several grids can exist within a country/area, companies are welcome to provide further breakdown details at state/sub-national level using “Other, please specify”.
Consumption of purchased electricity (MWh) (column 2)
- Enter in megawatt hours (MWh) the total amount of purchased electricity consumed by your organization in the selected country/area in the reporting year.
Consumption of self-generated electricity (MWh) (column 3)
- Enter in megawatt hours (MWh) the total amount of self-generated electricity consumed by your organization in the selected country/area in the reporting year.
- If your organization has self-generated and consumed electricity using Combined Heat and Power (CHP), this electricity consumption should be included here.
Is this consumption excluded from your RE100 commitment? (column 4)
- This column only appears to RE100 companies.
- Select “Yes” if you are excluding the electricity consumption reported in both column 2 and column 3.
- This column must only be used to describe where your organization is exempting consumption in particular countries or areas from the boundary of its RE100 target as allowed under the RE100 materiality threshold provisions (see Section Six: Additional provisions in the RE100 technical criteria).
Consumption of purchased heat, steam, and cooling (MWh) (column 5)
- Enter in megawatt hours (MWh) the total amount of purchased heat, steam, and cooling consumed by your company in the selected country/area in the reporting year.
Consumption of self-generated heat, steam, and cooling (MWh) (column 6)
- Enter in megawatt hours (MWh) the total amount of heat, steam, and cooling self-generated and consumed by your company in the selected country/area in the reporting year.
Total non-fuel energy consumption (MWh) (column 7)
- This column will be auto-calculated in the ORS from columns 2, 3, 5 and 6. Ensure you have entered data into these columns.
C9 Additional metrics
Module Overview
This module requests reporting organizations to present relevant climate-related metrics that may indirectly or directly impact their emissions or energy use.
This module includes one general question on additional climate-related metrics and a number of sector-specific questions on metrics such as production outputs, low-carbon technology implementation, transfers & sequestration of CO2 emissions and low-carbon investments.
Key changes
For the oil and gas and coal sectors only:
- New question:
- C-OG9.5a/C-CO9.5a – requests details of investment in exploration/expansion of new fossil fuel resources.
For the electrical utilities sector only:
- Modified question:
- C-EU9.5a – has a new column requesting the most recent year in which a new power plant was approved for development for each primary power generation source.
For multiple sectors:
- Modified question:
- C-CE9.6a/C-CG9.6a/C-CH9.6a/C-CN9.6a/C-CO9.6a/C-EU9.6a/C-MM9.6a/C-OG9.6a/C-RE9.6a/C-ST9.6a/C-TO9.6a/C-TS9.6a – has a new column for planned R&D investment, and requests details of how R&D investment is aligned with companies’ climate commitments and/or climate transition plan.
For the oil and gas sector only:
- Modified question:
- C-OG9.8a – has an additional column requesting the type of CO2 transfer.
- C-OG9.8b – now requests additional data on CO2 leakage and long-term storage.
Click here for a list of all changes made this year.
Sector-specific content
Additional questions on climate-related metrics for the following high-impact sectors:
- Capital goods
- Cement
- Chemicals
- Coal
- Construction
- Electric utilities
- Metals & mining
- Oil & gas
- Real estate
- Steel
- Transport original equipment manufacturers (OEMs)
- Transport services
Pathway diagram - questions
This diagram shows the general questions contained in module C9. To access question-level guidance, use the menu on the left to navigate to the question.

Other climate-related metrics
(C9.1) Provide any additional climate-related metrics relevant to your business.
Change from last year
No change
Rationale
CDP data users seek to understand in which areas, beyond GHG emissions, companies are trying to reduce their environmental impacts.
Connection to other frameworks
TCFD
Metrics & Targets recommended disclosure a) Disclose the metrics used by the organization to assess climate-related risks and opportunities in line with its strategy and risk management process.
Response options
Please complete the following table. You are able to add rows by using the “Add Row” button at the bottom of the table.
| Description
|
Metric value
|
Metric numerator
|
Metric denominator (intensity metric only)
|
% change from previous year
|
Direction of change
|
Please explain
|
|
Select from:
- Waste
- Energy usage
- Land use
- Other, please specify
|
Numerical field [enter a number from 0 to 99,999,999,999 using up to 2 decimal places]
|
Text field [maximum 50 characters]
|
Text field [maximum 50 characters]
|
Numerical field [enter a number from 0 to 999 using up to 2 decimal places]
|
Select from:
- Increased
- Decreased
- No change
|
Text field [maximum 2,400 characters]
|
[Add Row]
Requested content
General
- Complete the table to report any additional climate-related metrics your business tracks beyond emissions reductions and renewable energy-related activities.
- If you track more than one additional climate-related metric, describe them each in a separate row.
Description (column 1)
- Select the type of metric applicable to your business. If none of the listed drop-downs apply, select “Other, please specify” and provide a label for the “Description”.
Metric value (column 2)
- Enter the quantity of the unit tracked and reported in column 3. E.g. if your company tracks kilograms of waste, enter the kilograms measured during the reporting year.
- When providing an intensity metric, provide the value of the intensity. E.g. if your companies tracks kilograms of waste per FTE, enter the kilograms measured during the reporting year normalized to the number of FTE in the reporting year.
Metric numerator (column 3)
- Enter the unit of the metric that your company tracks. This unit corresponds to the value entered in column 2.
Metric denominator (column 4)
- This column is only applicable for companies tracking an intensity metric (e.g., kilograms of waste per FTE). If you do not track an intensity metric, leave this column blank.
% Change from previous year (column 5)
- If you have experienced no change, please enter 0 (zero) in this column.
- The previous year compared should apply to the 12-month period directly prior to the reporting period, even if it does not completely overlap with the period previously reported to CDP. It is understood that this metric has not been reported to CDP before and thus the reporting year for this metric may not directly overlap with other metrics reported to CDP.
- Leave the column blank if this is the first year you have tracked this metric.
Direction of change (column 6)
- Use this column to outline the direction of change from the previous year.
- A declining intensity ratio reflects a positive direction of change. E.g. your waste last reporting year was 10 metric tons/FTE and this year is 5 metric tons/FTE. This indicates a 50% decrease compared to the previous year.
- If the percentage change from last year is 0 (zero) then select “no change”.
Please explain (column 7)
- Use this column to provide any additional context relevant to the metric you are reporting and to the direction of change. Additional information could include projects or initiatives implemented to achieve progress on this metric, or any timeframes included in these goals.
Note for agricultural sectors:
- You should report data associated with the business activity areas that are relevant to your organization, as indicated in C-AC0.6/C-FB0.6/C-PF0.6. Note that these metrics should be in addition to what you have reported in modules 6 (Emissions data) and 7 (Emissions breakdown). For example, if agricultural/forestry activities are relevant to your disclosure, you could report here the area of land use change associated with your own farm or production unit. Other examples of relevant metrics are: the volume of fertilizers used for production; the consumption of water per unit of product during production, processing and/or manufacturing; the waste volume associated with the production of raw materials or the manufacture of goods; and the volume of biofuels used in the fleet.
Explanation of terms
- Land use: Land use is based on the functional dimension of land for different human purposes or economic activities. Typical categories for land use are dwellings, industrial use, transport, recreational use or nature protection areas. Additional land use metrics can relate to the climate-related arrangements, activities, and inputs regarding these categories that organizations engage in, and can include land use change and land use management metrics.
C10 Verification
Module Overview
Verification and assurance is good practice in environmental reporting as it ensures the quality of data and processes disclosed.
This module requests details on the verification status that applies to organizations’ reported Scope 1, 2 and 3 emissions, as well as on the verification of other climate-related information reported in the CDP disclosure.
Key changes
- Modified guidance:
- C10.1c – clarification on how the proportion of reported emissions verified should be calculated.
Click here for a list of all changes made this year.
Pathway diagram - questions
This diagram shows the general questions contained in module C10. To access question-level guidance, use the menu on the left to navigate to the question.
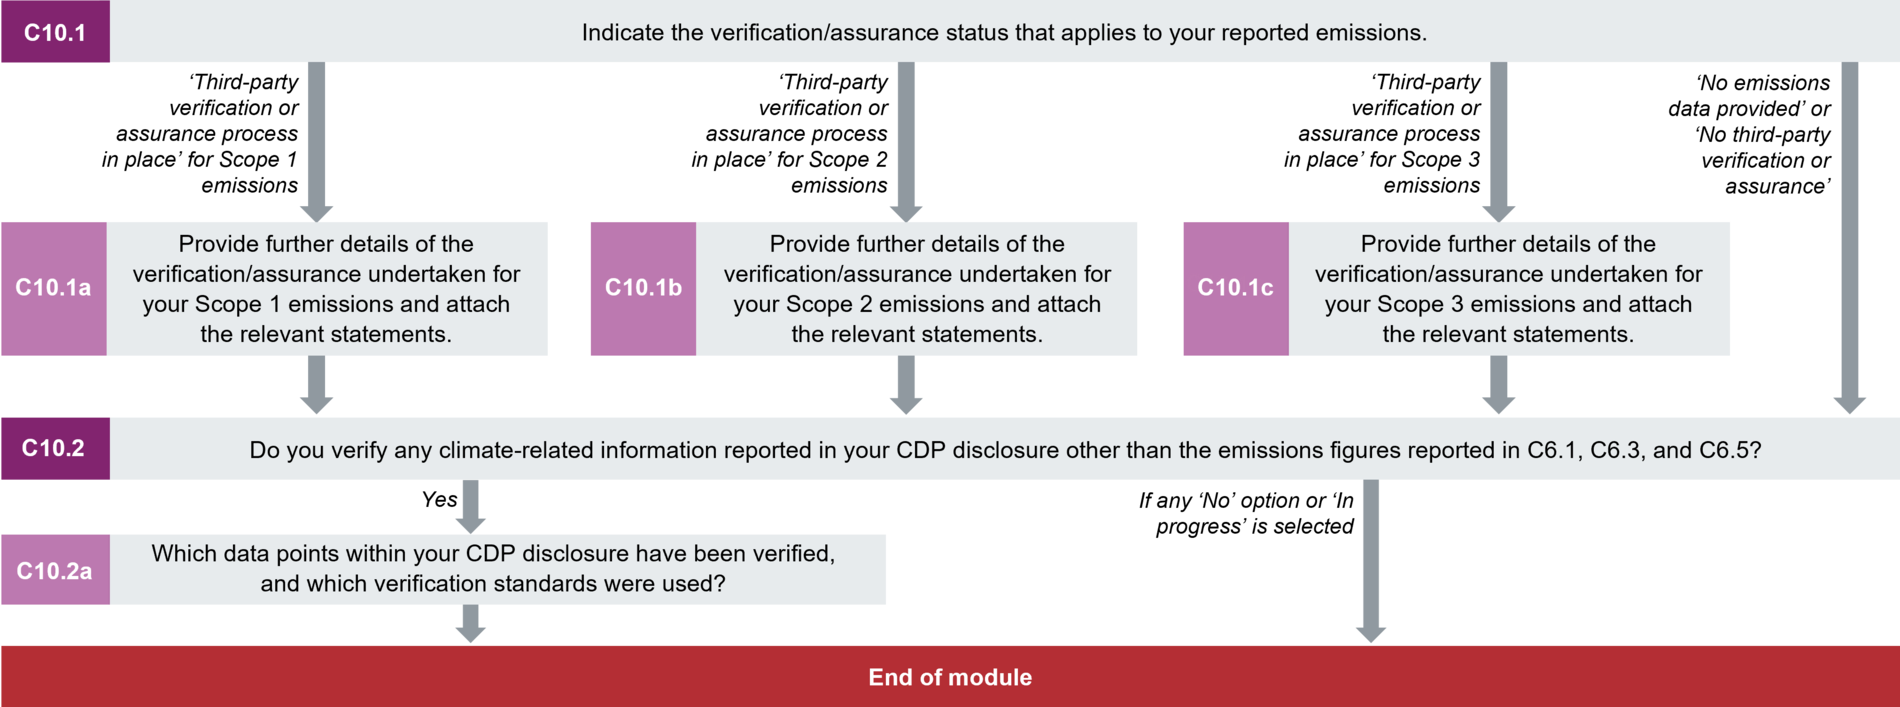
Verification
(C10.1) Indicate the verification/assurance status that applies to your reported emissions.
Change from last year
New question for minimum version only
Rationale
CDP supports verification and assurance as good practice in environmental reporting. This question gives data users further confidence in the accuracy of the data reported.
Response options
Please complete the following table:
| Scope
|
Verification/assurance status
|
|
Scope 1
|
Select from:
- No emissions data provided
- No third-party verification or assurance
- Third-party verification or assurance process in place
|
|
Scope 2 (location-based or market-based)
|
Select from:
- No emissions data provided
- No third-party verification or assurance
- Third-party verification or assurance process in place
|
|
Scope 3
|
Select from:
- No emissions data provided
- No third-party verification or assurance
- Third-party verification or assurance process in place
|
Requested content
General
- Please provide the verification/assurance
status that applies to your Scope 1, Scope 2, and Scope 3 emissions. If you
have had a proportion of your Scope 1, 2, and/or 3 emissions verified, please
select the option that applies to these emissions. If you are responding to the full version of the questionnaire, you will be given an
opportunity to provide further details in the following questions.
- If verification/assurance is underway, or
part of a biennial or triennial process: It is recognized that for some
companies, the verification/assurance schedule is out of synchronization with
the CDP disclosure process and therefore it is difficult to complete the verification/assurance
process before the CDP deadline. In addition, verification/assurance processes
may occur every two years (biennial verification) or every three years
(triennial verification). Where this is the case, you should select
“Verification or assurance process in place”. Full version respondents should then provide further information in
the following questions.
- Organizations responding to the full version of the questionnaire will be
asked to provide evidence of any third-party verification that they have reported here in subsequent questions. Companies are advised to verify that their evidence can
demonstrate all of the requirements set by CDP before answering this question (e.g.
by consulting with their verifier/assurer). Full details are provided in the
guidance for questions C10.1a, C10.1b and C10.1c. If certain information
requirements set by CDP are not met in the standard assurance statement
provided by your verifier, CDP has produced a
template
that can be used in conjunction with the original assurance statement.
Scope 2
- If you operate in a region where you need
to calculate both a location-based and a market-based figure to meet Scope 2
requirements, at this stage
CDP only requires for you to verify one of these
figures. However, in the interest of transparency, full version responders will be asked to disclose
which of the two figures you have verified.
Additional information
Annual, biennial and triennial processes: If in the year the verification is completed (for example, Year 3), the data for all sources during the full cycle is verified (for example year 1, 2, and 3) the company can report 100% verification and should attach the verification statements that cover the emissions for all three years. This would be considered a triennial process. Graph of this situation is provided for clarity below (Figure 1).
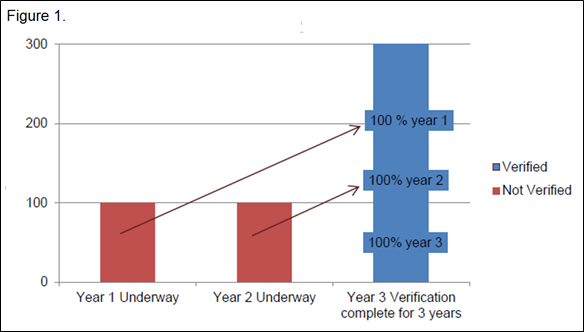
Annual processes: Not all processes taking place over three years will be considered a triennial process. The graphs below illustrate annual processes, which should not be confused with triennial.
Figure 2 shows an annual process, where in the year the verification is completed (for example, Year 3) only the data for that year is verified.
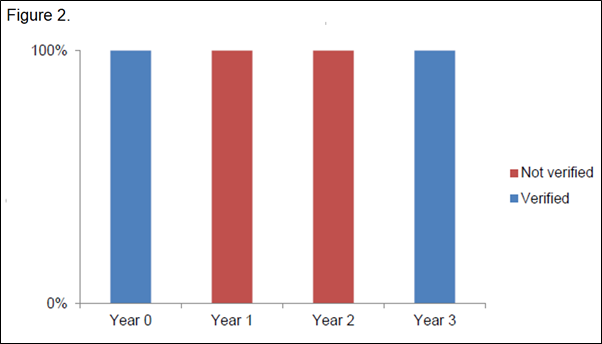
Another example of a yearly process is when one third of the sources is verified every year (Figure 3). Under this scenario, in Year 3 only 1/3 of the sources are verified, with the second third verified in Year 2, and the remaining third in Year 1. The company should report this as a yearly process where 33% of the sources are verified.
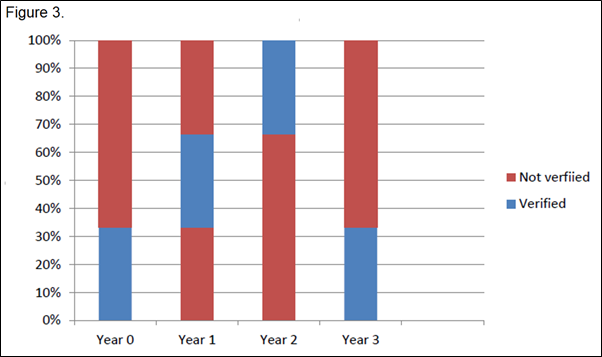
Likewise, where a company has 1/3 of their emissions verified every year this is an annual process (Figure 4):
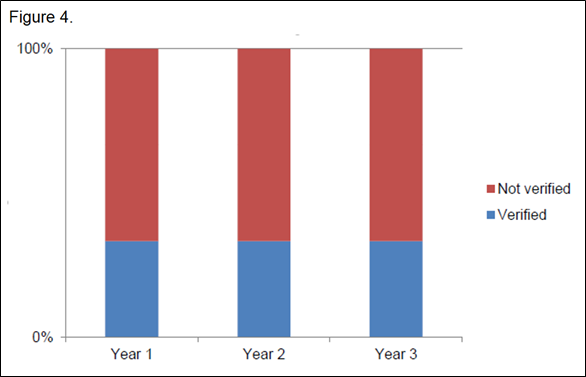
CDP regards verification/assurance as a process undertaken by an independent third party accredited to perform verification/assurance of the GHG emissions data. Please only state that you have had or are having verification/assurance carried out if it is by an independent third party accredited to perform verification/assurance of GHG data. CDP does not prescribe companies’ choice of specific verification/assurance providers. However, companies searching for a provider may want to consult our list of accredited verification partners: Learn more about CDP solution providers offering third party verification services here.
(C10.1a) Provide further details of the verification/assurance undertaken for your Scope 1 emissions and attach the relevant statements.
Question dependencies
This question only appears if you select “Third-party verification or assurance process in place” for Scope 1 emissions in response to C10.1.
Change from last year
Minor Change
Rationale
CDP supports verification and assurance as good practice in environmental reporting. This question gives data users further confidence in the accuracy of the data reported.
Connection to other frameworks
S&P Global Corporate Sustainability Assessment
EMS: Certification/ Audit/ Verification
RE100
Response options
Please complete the following table. You are able to add rows by using the “Add Row” button at the bottom of the table.
| Verification or assurance cycle in place
|
Status in the current reporting year
|
Type of verification or assurance
|
Attach the statement
|
Page/section reference
|
Relevant standard
|
Proportion of reported emissions verified (%)
|
|
Select from:
- Annual process
- Biennial process
- Triennial process
|
Select from:
- No verification or assurance of current reporting year
- Underway but not complete for current reporting year – first year it has taken place
- Underway but not complete for reporting year – previous statement of process attached
- Complete
|
Select from:
- Not applicable
- Limited assurance
- Moderate assurance
- Reasonable assurance
- High assurance
- Third party verification/assurance underway
|
Attach your document here
|
Text field [maximum 500 characters]
|
Select from drop-down options below
|
Numerical field [enter a number from 0-100 using no decimals or commas]
|
[Add Row]
Relevant standard drop-down options:
- AA1000AS
- ABNT NBR ISO 14064-3:2007 (Associação Brasileira de Normas Técnicas)
- Advanced technologies promotion Subsidy Scheme with Emission reduction Target (ASSET)
- Airport Carbon Accreditation (ACA) des Airports Council International Europe
- Alberta Technology Innovation and Emissions Reduction (TIER)
- ASAE3000
- Attestation standards established by AICPA (AT105)
- Australian National GHG emission regulation (NGER)
- California Mandatory GHG Reporting Regulations (CARB)
- Canadian Institute of Chartered Accountants (CICA) Handbook: Assurance Section 5025
- Carbon Trust Standard
- Chicago Climate Exchange (CCX) verification standard
- The Climate Registry's General Verification Protocol (also known as California Climate Action Registry (CCAR))
- Compagnie Nationale des Commissaires aux Comptes (CNCC)
- Corporate GHG verification guidelines from ERT
- DNV VeriSustain Protocol/ Verification Protocol for Sustainability Reporting
- Dutch Standard 3000A
- Earthcheck Certification
- ERM GHG Performance Data Assurance Methodology
- European Union Emissions Trading System (EU ETS)
- IDW PS 821: IDW Prüfungsstandard: Grundsätze ordnungsmäßiger Prüfung oder prüferischer Durchsicht von Berichtenim Bereich der Nachhaltigkeit
- IDW AsS 821: IDW Assurance Standard: Generally Accepted Assurance Principles for the Audit or Review of Reports on Sustainability Issues
- ISAE3000
- ISAE 3410
- ISO14064-1
- ISO14064-3
- Japan voluntary emissions trading scheme (JVETS) guideline for verification
- Korean GHG and energy target management system
- NMX-SAA-14064-3-IMNC: Instituto Mexicano de Normalización y Certificación A.C
- RevR6 procedure for assurance of sustainability report
- Saitama Prefecture Target-Setting Emissions Trading Program
- SGS Sustainability Report Assurance
- Spanish Institute of Registered Auditors (ICJCE)
- SSAE 3000
- Standard 3810N Assurance engagements relating to sustainability reports of the Royal Netherlands Institute of Registered Accountants
- State of Israel Ministry of Environmental Protection, Verification of GHG and emissions reduction in Israel Guidance Document
- Swiss Climate CO2 Label for Businesses
- Thai Greenhouse Gas Management Organisation (TGO) Greenhouse Gas (GHG) Verification Protocol
- Toitū Envirocare’s carbonreduce certification standard
- Tokyo Emissions Trading Scheme
- Other, please specify
Requested content
General
- If you are reporting third party
verification or assurance underway, your entries into the table should reflect
the emissions that are being subject to verification/assurance for the current
reporting year, with the exception of the attached statement, which will relate
to a previous year.
- CDP understands that you may seek
verification for reasons other than reporting to CDP and that confidential
information may be included within your detailed verification statement. In
this case, it is sufficient for your verifier/assurer to attest to the Scope
and level of assurance/verification through correspondence such as an
abbreviated statement as long as this covers the data points outlined below
(see guidance for column 4 ‘Attach your statement here’).
- Note that this question refers to the proportion of your total reported gross global Scope 1 emissions over which you have sought verification, not the sampling regime that the verifier employed. For example, if you have only sought verification over your US operations then you should report the percentage of your total reported gross global Scope 1 emissions that these US facilities represent. Alternatively, if you have sought organization-wide verification, then you should enter 100%. If you have reported your full GHG inventory in your corporate communications material which has been verified, please enter 100%. If you are reporting third party verification or assurance underway, your answer should reflect the proportion of emissions that are being subject to verification/assurance for the current reporting year.
- If you are reporting that all of your reported scope 1 emissions have been verified/assured, then the total of the figures entered into column “Proportion of reported emissions verified” (column 7) across all rows should equal 100%. The total of all rows entered into this table should not exceed 100%. Where a portion of your reported scope 1 emissions has been subject to multiple verification/assurance processes, you do not need to report the verification of these emissions more than once, and should only add one row for the highest level of assurance awarded for the emissions.
Verification or assurance cycle in place
(column 1)
- A biennial verification/assurance process
is where emissions are verified once every two years and a triennial
verification/assurance process is where emissions are verified once every three
years.
- You may refer to the additional information
provided on annual, biennial and triennial processes in C10.1 for further
information.
Status in the current reporting year
(column 2)
- Please select the option that is most
appropriate to your company.
Type of verification or assurance (column 3)
- This column relates to the type of
verification or assurance that has been awarded.
- The option that is relevant will depend on
the verification standard to which the verification process has been completed
and the level of assurance agreed between the verifier and the company.
- Companies can select from the following
options:
- Not applicable - In very few cases, usually in program based
compliance, the verification standard does not include a level of assurance; in
this case select this option.
- Limited assurance - This is one of the most common levels of
assurance and, for e.g., is appropriate to verification undertaken in
accordance with ISO14064-3, ISAE3000, ASAE3000 and The Climate Registry.
- Moderate assurance - For example, this level of assurance is
appropriate to verification undertaken in accordance with AA1000 and AT105.
- Reasonable assurance - For example, this is appropriate to
verification undertaken under ISO14064-3, ISAE3000, ASAE3000 and The Climate
Registry; all verification undertaken for EU ETS compliance is to a level of
“reasonable assurance” (according to the requirements of EA-6/03).
- High assurance - For example, this is
appropriate to verification undertaken in accordance with AA1000 and AT105.
- Third party verification/assurance underway
- Select this option if verification/assurance is underway and you do not yet
know the level of assurance that you are intending to achieve.
Attach the statement (column 4)
- Note the requirements for the statement
detailed below and the option to use the
CDP template.
- All companies should attach a verification
statement here unless they have selected “No verification or assurance of
current reporting year” or “Underway but not complete for current reporting
year – first year it has taken place” in column 2 ‘Status in the current
reporting year’. The statement should:
- Clearly state that GHG emissions have been
verified or assured as part of the process. If the statement refers to other
documents that have been verified (such as Sustainability Report, Financial
Report, GRI etc.) where items verified are specified, please attach those to
the question as well;
- Relate to the relevant Scope;
- Clearly state the opinion and type of
verification/assurance that has been given and the verification standard used. Assurers/verifiers
must define the finding in their opinion, simply stating “limited assurance” is
not sufficient to fulfill this criterion. These should match the selections
made in columns 1 and 3; and
- Covers the current reporting year, or
covers the 12-months prior for annual processes, 12-24 months prior for biennial
processes, or 12-36 months prior for triennial processes if “Underway but not complete for reporting
year – previous statement of process attached” is selected in “Status in the
current reporting year” column.
Page/section reference (column 5)
- Please identify the page and the section
that contains details of your verification/assurance of Scope 1 emissions.
Relevant standard (column 6)
- This column captures the verification
standard against which the verification process has been undertaken.
- It does not refer to the reporting or
calculation standard. CDP has produced criteria for what constitutes an
acceptable verification standard. All accepted verification standards, and
exceptions to their use, are
listed here. If you are using a
verification standard that is not listed in the “accepted standards” nor the “non-verification
standards,” please contact your regional CDP office in order to have your verification standard reviewed. If you do not have your standard
reviewed by contacting us and your response is submitted before the official
CDP deadline, CDP will then review the standard used and add it to the website
under “accepted” or “not accepted” depending on the outcome of the standard
review. If the response is submitted after the official deadline, CDP cannot
commit to review the standard used in time for scoring.
- Select from the accepted standards listed
or use “Other, please specify” if the standard you are using is not included.
- If you select “Other, please specify”,
provide a label for the Relevant standard.
- The verification standard should be stated
on the verification statement.
Proportion of reported emissions verified
(%) (column 7)
- It may be the case that only a sub-section
of your emissions has been verified/assured due to, for e.g., regulatory
requirements.
- Please identify what proportion of your
total reported emissions for Scope 1 has been subject to the
verification/assurance process described.
- If you are reporting that all of your reported scope 1 emissions have been verified/assured, then the total of the figures entered into this column across all rows should equal 100%. The total of all rows entered into this table should not exceed 100%.
Additional information
- Verification processes: If you have attained verification covering all your reported Scope 1 emissions (for example GHG emissions reported in your sustainability report) and also other verification covering smaller proportion of your business (for example only Californian operations or facilities under EU ETS regulation), you only should report the verification in place covering all reported Scope 1 emissions. If you have multiple verification practices covering different business divisions (for example Californian operations and facilities under EU ETS), you should report all of them by adding rows to the table, completing all columns, and attaching the appropriate documents for each verification practice.
(C10.1b) Provide further details of the verification/assurance undertaken for your Scope 2 emissions and attach the relevant statements.
Question dependencies
This question only appears if you select “Third-party verification or assurance process in place” for Scope 2 emissions in response to C10.1.
Change from last year
Minor change
Rationale
CDP supports verification and assurance as good practice in environmental reporting. This question gives data users further confidence in the accuracy of the data reported.
Connection to other frameworks
S&P Global Corporate Sustainability Assessment
EMS: Certification/ Audit/ Verification
RE100
Response options
Please complete the following table. You are able to add rows by using the “Add Row” button at the bottom of the table.
| Scope 2 approach
|
Verification or assurance cycle in place
|
Status in the current reporting year
|
Type of verification or assurance
|
Attach the statement
|
Page/ section reference
|
Relevant standard
|
Proportion of reported emissions verified (%)
|
|
Select from:
- Scope 2 location-based
- Scope 2 market-based
|
Select from:
- Annual process
- Biennial process
- Triennial process
|
Select from:
- No verification or assurance of current reporting year
- Underway but not complete for current reporting year – first year it has taken place
- Underway but not complete for reporting year – previous statement of process attached
- Complete
|
Select from:
- Not applicable
- Limited assurance
- Moderate assurance
- Reasonable assurance
- High assurance
- Third party verification/assurance underway
|
Attach your document here
|
Text field [maximum 500 characters]
|
Select from drop-down options below
|
Numerical field [enter a number from 0-100 using no decimals or commas]
|
[Add Row]
Relevant standard drop-down options:
- AA1000AS
- ABNT NBR ISO 14064-3:2007 (Associação Brasileira de Normas Técnicas)
- Advanced technologies promotion Subsidy Scheme with Emission reduction Target (ASSET)
- Airport Carbon Accreditation (ACA) des Airports Council International Europe
- Alberta Technology Innovation and Emissions Reduction (TIER)
- ASAE3000
- Attestation standards established by AICPA (AT105)
- Australian National GHG emission regulation (NGER)
- California Mandatory GHG Reporting Regulations (CARB)
- Canadian Institute of Chartered Accountants (CICA) Handbook: Assurance Section 5025
- Carbon Trust Standard
- Chicago Climate Exchange (CCX) verification standard
- The Climate Registry's General Verification Protocol (also known as California Climate Action Registry (CCAR))
- Compagnie Nationale des Commissaires aux Comptes (CNCC)
- Corporate GHG verification guidelines from ERT
- DNV VeriSustain Protocol/ Verification Protocol for Sustainability Reporting
- Dutch Standard 3000A
- Earthcheck Certification
- ERM GHG Performance Data Assurance Methodology
- European Union Emissions Trading System (EU ETS)
- IDW PS 821: IDW Prüfungsstandard: Grundsätze ordnungsmäßiger Prüfung oder prüferischer Durchsicht von Berichtenim Bereich der Nachhaltigkeit
- IDW AsS 821: IDW Assurance Standard: Generally Accepted Assurance Principles for the Audit or Review of Reports on Sustainability Issues
- ISAE3000
- ISAE 3410
- ISO14064-1
- ISO14064-3
- Japan voluntary emissions trading scheme (JVETS) guideline for verification
- Korean GHG and energy target management system
- NMX-SAA-14064-3-IMNC: Instituto Mexicano de Normalización y Certificación A.C
- RevR6 procedure for assurance of sustainability report
- Saitama Prefecture Target-Setting Emissions Trading Program
- SGS Sustainability Report Assurance
- Spanish Institute of Registered Auditors (ICJCE)
- SSAE 3000
- Standard 3810N Assurance engagements relating to sustainability reports of the Royal Netherlands Institute of Registered Accountants
- State of Israel Ministry of Environmental Protection, Verification of GHG and emissions reduction in Israel Guidance Document
- Swiss Climate CO2 Label for Businesses
- Thai Greenhouse Gas Management Organisation (TGO) Greenhouse Gas (GHG) Verification Protocol
- Toitū Envirocare’s carbonreduce certification standard
- Tokyo Emissions Trading Scheme
- Other, please specify
Requested content
General
- If you are reporting third party
verification or assurance underway, your entries into the table should reflect
the emissions that are being subject to verification/assurance for the current
reporting year, with the exception of the attached statement, which will relate
to a previous year.
- CDP understands that you may seek
verification for reasons other than reporting to CDP and that confidential
information may be included within your detailed verification statement. In
this case, it is sufficient for your verifier/assurer to attest to the Scope
and level of assurance/verification through correspondence such as an
abbreviated statement as long as this covers the data points outlined below
(see guidance for column 5 "Attach your statement here")
Scope 2 approach (column 1)
- Select
the Scope 2 calculation approach to which your verification/assurance statement
applies.
- If
you operate in a region where you need to calculate both a location-based and a
market-based figure to meet Scope 2 requirements, at this stage CDP only
requires for you to verify one of these figures.
- However,
in the interest of transparency, you are asked to disclose which of the two
figures you have verified.
Verification or assurance cycle in place (column
2)
- A biennial verification/assurance process
is where emissions are verified once every two years and a triennial
verification/assurance process is where emissions are verified once every three
years.
- You may refer to the further information in
C10.1 on annual, biennial and triennial processes for further information on annual,
biennial and triennial processes.
Status in the current reporting year
(column 3)
- Please select the option most appropriate
to your company.
Type of verification or assurance (column 4)
- This column relates to the type of
verification or assurance that has been awarded.
- The option that is relevant will depend on
the verification standard to which the verification process has been completed
and the level of assurance agreed between the verifier and the company.
- Companies can select from the following
options:
- Not applicable - In very few cases, usually in program based
compliance, the verification standard does not include a level of assurance; in
this case select this option.
- Limited assurance -This is one of the most common levels of
assurance and, for e.g., is appropriate to verification undertaken in
accordance with ISO14064-3, ISAE3000, ASAE3000 and The Climate Registry.
- Moderate assurance - For example, this level of assurance is
appropriate to verification undertaken in accordance with AA1000 and AT105.
- Reasonable assurance - For example, this is appropriate to
verification undertaken under ISO14064-3, ISAE3000, ASAE3000 and The Climate
Registry; all verification undertaken for EU ETS compliance is to a level of
“reasonable assurance” (according to the requirements of EA-6/03).
- High assurance – For example, this is
appropriate to verification undertaken in accordance with AA1000 and AT105.
- Third party verification/assurance underway
– Select this option if verification/assurance is underway and you do not yet
know the level of assurance that you are intending to achieve.
Attach the statement (column 5)
- Note the requirements for the statement
detailed below and the option to use the
CDP template.
- All companies should attach a verification statement here unless they have selected “No verification or assurance of current reporting year” or “Underway but not complete for current reporting year – first year it has taken place” in column 3 "Status in the current reporting year". The statement should:
- Clearly state that GHG emissions have been
verified or assured as part of the process. If the statement refers to other
documents that have been verified (such as Sustainability Report, Financial
Report, GRI etc.) where items verified are specified, please attach those to
the question as well;
- Relate to the relevant Scope;
- Clearly state the opinion and type of verification/assurance
that has been given and the verification standard used; and
- Cover the current reporting year, or
covers the 12-months prior if “Underway but not complete for reporting year –
previous statement of process attached” is selected in “Status in the current
reporting year” column.
Page/section reference (column 6)
- Please identify the page and the section
that contains details of your verification/assurance of Scope 2 emissions.
Relevant standard (column 7)
- This column captures the verification
standard against which the verification process has been undertaken. It does
not refer to the reporting or calculation standard.
- CDP has produced criteria for what
constitutes an acceptable verification standard. All accepted verification
standards, and exceptions to their use, are
listed here.
- The verification standard should be stated
on the verification statement. If the response is submitted before the official
CDP deadline, CDP will then review the standard used and add it to the website
under “accepted” or “not accepted” depending on the outcome of the standard
review.
- If the response is submitted after the
official deadline, CDP cannot commit to review the standard used in time for
scoring.
- Select from the accepted standards listed
or use “Other, please specify” if the standard you are using is not included.
- If you select “Other, please specify”,
provide a label for the Relevant standard.
Proportion of reported emissions verified
(%) (column 8)
- It may be the case that only a sub-section
of your emissions has been verified/assured due to, for e.g., regulatory
requirements.
- Please identify what proportion of your
total reported emissions for Scope 2 has been subject to the
verification/assurance process described.
(C10.1c) Provide further details of the verification/assurance undertaken for your Scope 3 emissions and attach the relevant statements.
Question dependencies
This question only appears if you select “Third-party verification or assurance process in place” for Scope 3 emissions in response to C10.1.
Change from last year
Minor change
Rationale
CDP supports verification and assurance as good practice in environmental reporting. This question gives data users further confidence in the accuracy of the data reported.
Connection to other frameworks
S&P Global Corporate Sustainability Assessment
EMS: Certification/ Audit/ Verification
Response options
Please complete the following table. You are able to add rows by using the “Add Row” button at the bottom of the table.
| Scope 3 category
|
Verification or assurance cycle in place
|
Status in the current reporting year
|
Type of verification or assurance
|
Attach the statement
|
Page/ section reference
|
Relevant standard
|
Proportion of reported emissions verified (%)
|
Select all that apply:
- Scope 3: Purchased
goods and services
- Scope 3:
Capital goods
- Scope 3:
Fuel and energy-related activities (not included in Scopes 1 or 2)
- Scope 3:
Upstream transportation and distribution
- Scope 3:
Waste generated in operations
- Scope 3:
Business travel
- Scope 3:
Employee commuting
- Scope 3:
Upstream leased assets
- Scope 3:
Investments
- Scope 3:
Downstream transportation and distribution
- Scope 3:
Processing of sold products
- Scope 3: Use
of sold products
- Scope 3:
End-of-life treatment of sold products
- Scope 3: Downstream
leased assets
- Scope 3:
Franchises
|
Select from:
- Annual process
- Biennial process
- Triennial process
|
Select from:
- No verification or assurance of current reporting year
- Underway but not complete for current reporting year – first year it has
taken place
- Underway but not complete for reporting year – previous statement of
process attached
- Complete
|
Select from:
- Not applicable
- Limited assurance
- Moderate assurance
- Reasonable assurance
- High assurance
- Third party verification/assurance underway
|
Attach your document here
|
Text field [maximum 500 characters]
|
Select from drop-down options below
|
Numerical field [enter a number from 0-100 using no decimals or commas]
|
[Add Row]
Relevant standard drop-down options:
- AA1000AS
- ABNT NBR ISO 14064-3:2007 (Associação Brasileira de Normas Técnicas)
- Advanced technologies promotion Subsidy Scheme with Emission reduction Target (ASSET)
- Airport Carbon Accreditation (ACA) des Airports Council International Europe
- Alberta Technology Innovation and Emissions Reduction (TIER)
- ASAE3000
- Attestation standards established by AICPA (AT105)
- Australian National GHG emission regulation (NGER)
- California Mandatory GHG Reporting Regulations (CARB)
- Canadian Institute of Chartered Accountants (CICA) Handbook: Assurance Section 5025
- Carbon Trust Standard
- Chicago Climate Exchange (CCX) verification standard
- The Climate Registry's General Verification Protocol (also known as California Climate Action Registry (CCAR))
- Compagnie Nationale des Commissaires aux Comptes (CNCC)
- Corporate GHG verification guidelines from ERT
- DNV VeriSustain Protocol/ Verification Protocol for Sustainability Reporting
- Dutch Standard 3000A
- Earthcheck Certification
- ERM GHG Performance Data Assurance Methodology
- European Union Emissions Trading System (EU ETS)
- IDW PS 821: IDW Prüfungsstandard: Grundsätze ordnungsmäßiger Prüfung oder prüferischer Durchsicht von Berichtenim Bereich der Nachhaltigkeit
- IDW AsS 821: IDW Assurance Standard: Generally Accepted Assurance Principles for the Audit or Review of Reports on Sustainability Issues
- ISAE3000
- ISAE 3410
- ISO14064-1
- ISO14064-3
- Japan voluntary emissions trading scheme (JVETS) guideline for verification
- Korean GHG and energy target management system
- NMX-SAA-14064-3-IMNC: Instituto Mexicano de Normalización y Certificación A.C
- RevR6 procedure for assurance of sustainability report
- Saitama Prefecture Target-Setting Emissions Trading Program
- SGS Sustainability Report Assurance
- Spanish Institute of Registered Auditors (ICJCE)
- SSAE 3000
- Standard 3810N Assurance engagements relating to sustainability reports of the Royal Netherlands Institute of Registered Accountants
- State of Israel Ministry of Environmental Protection, Verification of GHG and emissions reduction in Israel Guidance Document
- Swiss Climate CO2 Label for Businesses
- Thai Greenhouse Gas Management Organisation (TGO) Greenhouse Gas (GHG) Verification Protocol
- Toitū Envirocare’s carbonreduce certification standard
- Tokyo Emissions Trading Scheme
- Other, please specify
Requested content
General
- If you are reporting third party verification or assurance underway, your entries into the table should reflect the emissions that are being subject to verification/assurance for the current reporting year, with the exception of the attached statement, which will relate to a previous year.
- CDP understands that you may seek verification for reasons other than reporting to CDP and that confidential information may be included within your detailed verification statement. In this case, it is sufficient for your verifier/assurer to attest to the Scope and level of assurance/verification through correspondence such as an abbreviated statement as long as this covers the data points outlined below (see guidance for column 4 ‘Attach your statement here’).
Scope 3 category (column 1)
Verification or assurance cycle in place (column 2)
- A biennial verification/assurance process is where Scope 3 emissions are verified once every two years and triennial verification/assurance process where Scope 3 emissions are verified once every three years.
- You may refer to the further information in C10.1 on annual, biennial and triennial processes for further information on annual, biennial and triennial processes.
Status in the current reporting year (column 3)
- Please select the option most appropriate to your company
Type of verification or assurance (column 4)
- This column relates to the type of verification or assurance that has been awarded.
- The option that is relevant will depend on the verification standard to which the verification process has been completed and the level of assurance agreed between the verifier and the company.
- Companies can select from the following options:
- Not applicable -In very few cases, usually in program based compliance, the verification standard does not include a level of assurance; in this case select this option.
- Limited assurance -This is one of the most common levels of assurance and, for e.g., is appropriate to verification undertaken in accordance with ISO14064-3, ISAE3000, ASAE3000 and The Climate Registry.
- Moderate assurance -For example, this level of assurance is appropriate to verification undertaken in accordance with AA1000 and AT105.
- Reasonable assurance -For example, this is appropriate to verification undertaken under ISO14064-3, ISAE3000, ASAE3000 and The Climate Registry; all verification undertaken for EU ETS compliance is to a level of “reasonable assurance” (according to the requirements of EA-6/03).
- High assurance - For example, this is appropriate to verification undertaken in accordance with AA1000 and AT105.
- Third party verification/assurance underway - Select this option if verification/assurance is underway and you do not yet know the level of assurance that you are intending to achieve
Attach the statement (column 5)
- Note the requirements for the statement detailed below and the option to use the CDP template.
- All companies should attach a verification statement here unless they have selected “No verification or assurance of current reporting year” or “Underway but not complete for current reporting year – first year it has taken place” in column 3 ‘Status in the current reporting year’. The statement should:
- Clearly state that GHG emissions have been verified or assured as part of the process. If the statement refers to other documents that have been verified (such as Sustainability Report, Financial Report, GRI etc.) where items verified are specified, please attach those to the question as well;
- Relate to the relevant Scope 3 categories;
- Clearly state the opinion and type of verification/assurance that has been given and the verification standard used.
- Covers the current reporting year, or covers the 12-months prior if “Underway but not complete for reporting year – previous statement of process attached” is selected in “Status in the current reporting year” column.
Page/section reference (column 6)
- Please identify the page and the section that contains details of your verification/assurance of Scope 3 emissions.
Relevant standard (column 7)
- This column captures the verification standard against which the verification process has been undertaken. It does not refer to the reporting or calculation standard.
- CDP has produced criteria for what constitutes an acceptable verification standard. All accepted verification standards, and exceptions to their use, are listed here.
- The verification standard should be stated on the verification statement. If the response is submitted before the official CDP deadline, CDP will then review the standard used and add it to the website under “accepted” or “not accepted” depending on the outcome of the standard review.
- If the response is submitted after the official deadline, CDP cannot commit to review the standard used in time for scoring.
- Select from the accepted standards listed or use “Other, please specify” if the standard you are using is not included.
- If you select “Other, please specify”, provide a label for the Relevant standard.
Proportion of reported emissions verified (%) (column 8)
- It may be the case that only a sub-section of your emissions has been verified/assured due to, for e.g., regulatory requirements.
- Please identify what proportion of your total reported emissions for the selected Scope 3 categories has been subject to the verification/assurance process described.
- The percentage of reported emissions verified can be calculated using the following equation:

Note for financial services companies:
- Financial services companies are requested to verify figures reported in C-FS14.1a and/or C-FS14.1b in row “Scope 3 Investments”.
- Financial services companies disclosing data for multiple portfolios in C-FS14.1a and/or C-FS14.1b are requested to clarify which portfolios the verification relates to in column 6 “Page/section reference”.
- If the verification process is different for different portfolios, use “add row” to disclose them separately.
- The verification of data in module C14 Portfolio impact, other than data disclosed in C-FS14.1a and/or C-FS14.1b, should be disclosed in C10.2a.
Other verified data
(C10.2) Do you verify any climate-related information reported in your CDP disclosure other than the emissions figures reported in C6.1, C6.3, and C6.5?
Change from last year
Modified guidance for financial services companies
Rationale
This information gives data users further confidence in the information provided in your organization’s response. Data users often ask about the credibility/ quality of the data and other information disclosed. CDP supports verification and assurance as good practice in environmental reporting as it ensures the quality of data and processes disclosed. This question allows leading companies to report their efforts on this, and to highlight trends that CDP data users might anticipate being good practice among companies in the future.
Connection to other frameworks
S&P Global Corporate Sustainability Assessment
EMS: Certification/ Audit/ Verification
Response options
Select one of the following options:
- Yes
- In progress
- No, but we are actively considering verifying within the next two years
- No, we are waiting for more mature verification standards and/or processes
- No, we do not verify any other climate-related information reported in our CDP disclosure
Requested content
Note for financial services companies:
- For financial services companies this question relates to any climate-related information reported in their CDP disclosure other than the emissions figures reported in C6.1, C6.3, C6.5, but also C-FS14.1a and C-FS14.1b.
(C10.2a) Which data points within your CDP disclosure have been verified, and which verification standards were used?
Question dependencies
This question only appears if you select “Yes” in response to C10.2.
Change from last year
Minor change
Rationale
This information gives data users further confidence in the information provided in your organization’s response. Data users often ask about the credibility/ quality of the data and other information disclosed. CDP supports verification and assurance as good practice in environmental reporting as it ensures the quality of data and processes disclosed. This question allows leading companies to report their efforts on this, and to highlight trends that CDP data users might anticipate being good practice among companies in the future.
Connection to other frameworks
SDG
Goal 7: Affordable and clean energy
S&P Global Corporate Sustainability Assessment
EMS: Certification/ Audit/ Verification
Response options
Please complete the following table. You are able to add rows by using the “Add Row” button at the bottom of the table.
| Disclosure module verification relates to
|
Data verified
|
Verification standard
|
Please explain
|
|
Select from:
- C0. Introduction
- C1. Governance
- C2. Risks and opportunities
- C3. Business Strategy
- C4. Targets and performance
- C5. Emissions performance
- C6. Emissions data
- C7. Emissions breakdown
- C8. Energy
- C9. Additional metrics
- C11. Carbon pricing
- C12. Engagement
- C13. Other land management impacts
- C14. Portfolio impact
- C16. Signoff
- SC. Supply chain module
|
Select from:
- Year on year change in emissions (Scope
1)
- Year on year change in emissions (Scope
2)
- Year on year change in emissions (Scope
1 and 2)
- Year on year change in emissions (Scope
3)
- Year on year emissions intensity figure
- Financial or other base year data
points used to set a science-based target
- Progress against emissions reduction
target
- Change in Scope 1 emissions against a
base year (not target related)
- Change in Scope 2 emissions against a
base year (not target related)
- Change in Scope 3 emissions against a
base year (not target related)
- Product footprint verification
- Emissions reduction activities
- Renewable energy products
- Energy consumption
- Alignment with a sustainable finance taxonomy
- Waste data
- Allocation of emissions to customers
- Don’t know
- Other, please specify
|
Text field [maximum 1,500 characters]
|
Text field [maximum 1,500 characters]
|
[Add Row]
Requested content
Disclosure module verification relates to (column 1)
- Select the questionnaire module that the verification standard applies to.
Data verified (column 2)
- Select from the data points provided or use “Other, please specify” if the data you have verified is not included.
Verification standard (column 3)
- This column captures the verification standard against which the verification process has been undertaken. It does not refer to the reporting or calculation standard.
- Clearly state the type of verification/assurance that has been given and the name of the verification standard used.
- CDP has produced criteria for what constitutes an acceptable verification standard. All accepted verification standards, and exceptions to their use, are listed here.
Please explain (column 4)
- Explain here why your company has chosen to verify the selected data points with each given standard.
- Where possible, reference specific question numbers.
- You can also describe here the frequency with which you complete this verification and the scope it encompasses.
- Outline if you have sought organization wide verification or if you have only sought verification over a certain proportion of your operations.
Note for financial services companies:
- Disclose the verification of data in module C14 Portfolio impact, other than data disclosed in C-FS14.1a and/or C-FS14.1b.
- The verification of financed emissions as per C-FS14.1a and/or C-FS14.1b should be disclosed in C10.1c.
C11 Carbon pricing
Module Overview
Carbon pricing has emerged as a key policy mechanism to drive greenhouse gas emissions reductions and mitigate the dangerous impacts of climate change. As the number of jurisdictions with carbon pricing policies increases, CDP data users are interested in understanding how companies are affected by these schemes.
This module examines details on the operations or activities regulated by carbon pricing systems, carbon credits and internal prices on carbon.
For further guidance on reporting to the questions in this module see CDP’s Technical Note Carbon Pricing: CDP Disclosure Best Practice.
Key changes
- Modified questions:
- C11.2 – question text revised to ask if your organization has cancelled any project-based carbon credits.
- C11.2a – updated to request details of cancelled project-based carbon credits, including the standards used to verify the credits.
- C11.3a – updated to request further details of how your organization uses an internal price on carbon, including how the price is determined and how it is used in business decision-making processes.
Click here for a list of all changes made this year.
Pathway diagram - questions
This diagram shows the general questions contained in module C11. To access question-level guidance, use the menu on the left to navigate to the question.
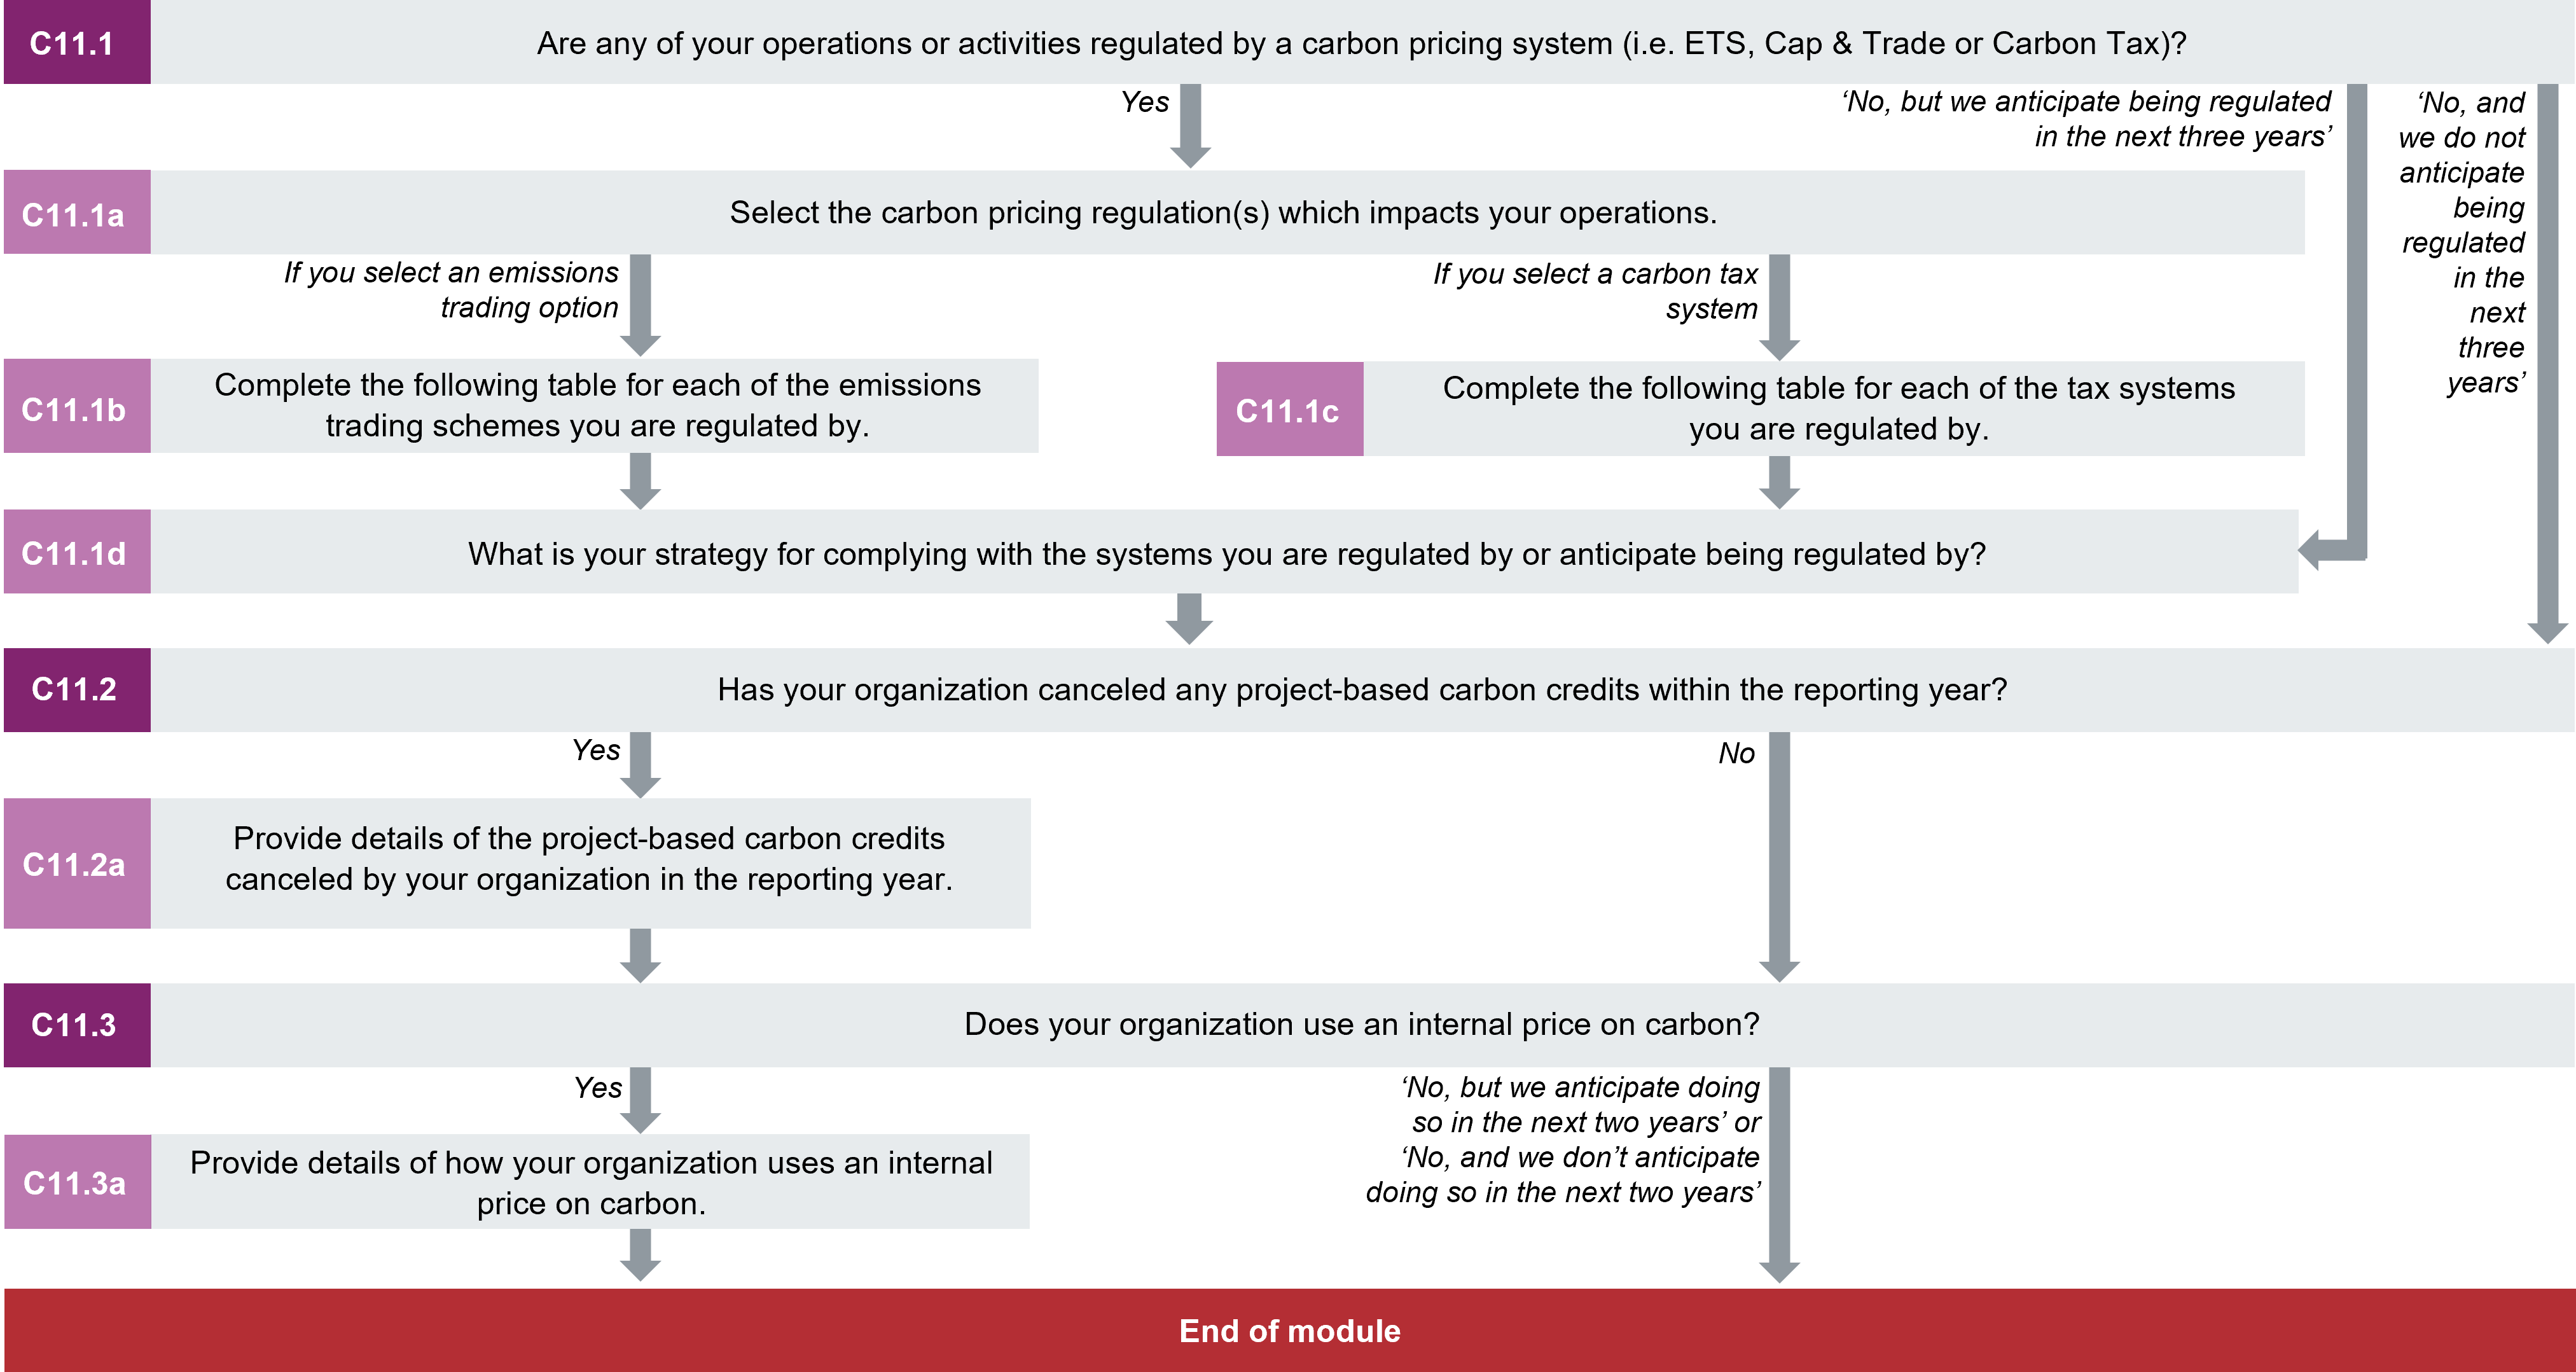
Carbon pricing systems
(C11.1) Are any of your operations or activities regulated by a carbon pricing system (i.e. ETS, Cap & Trade or Carbon Tax)?
Change from last year
No change
Rationale
Companies are requested to report whether they are subject to, or potentially subject to, mandatory carbon pricing systems. This question has evolved to include whether companies are currently regulated by a carbon pricing system – including carbon markets or taxation – or whether they expect to be regulated in the future. Companies responding ”Yes” will be further prompted to identify the systems in which they participate and to provide additional details about their exposure to these systems. This information allows investors to consistently track and analyze corporate expectations and the associated costs of carbon pricing regulations, and forces unregulated companies to consider potential future exposure.
Connection to other frameworks
SDG
Goal 13: Climate action
Response options
Select one of the following options:
- Yes
- No, but we anticipate being regulated in the next three years
- No, and we do not anticipate being regulated in the next three years
Requested content
General
- Companies responding ”Yes” will be further prompted to identify the systems in which they participate and to provide additional details about their exposure to these systems.
Additional information
- Carbon pricing policies: Carbon pricing is a key policy mechanism to drive greenhouse gas emissions reductions and mitigate the dangerous impacts of climate change. Policies primarily manifest in one of two ways; or, in some countries, areas and regions, both ways:
- An emissions trading scheme, also known as a cap and trade system, is a market-based allowance system in which participants can buy and sell a set amount of allowances based on their emissions levels. Low emitters will have allowances left over for sale, which higher emitters will buy to offset their emissions – operating in a demand and supply scenario.
- A carbon tax attaches a fee to carbon emissions.
These policies in practice vary specifically on a case-by-case basis.
For more information, please see:
(C11.1a) Select the carbon pricing regulation(s) which impacts your operations.
Question dependencies
This question only appears if you select “Yes” in response to C11.1.
Change from last year
Minor change
Rationale
As the number of jurisdictions with carbon pricing policies has doubled over the last decade, users of CDP data are interested in understanding how companies are affected by these schemes. This question provides investors and data users with a sense of the regulatory environments in which companies operate and the potential for future regulation which may impact a company's operations.
Connection to other frameworks
SDG
Goal 13: Climate action
Response options
Select all that apply from the following options:
- Alberta TIER - ETS
- Argentina carbon tax
- Australia ERF Safeguard Mechanism – ETS
- Baja California carbon tax
- BC carbon tax
- BC GGIRCA - ETS
- Beijing pilot ETS
- California CaT – ETS
- Canada federal fuel charge
- Canada federal Output Based Pricing System (OBPS) - ETS
- Chile carbon tax
- China national ETS
- Chongqing pilot ETS
- Colombia carbon tax
- Denmark carbon tax
- Estonia carbon tax
- EU ETS
- Finland carbon tax
- France carbon tax
- Fujian pilot ETS
- Germany ETS
- Guangdong pilot ETS
- Hubei pilot ETS
- Iceland carbon tax
- Ireland carbon tax
- Japan carbon tax
- Kazakhstan ETS
- Korea ETS
- Latvia carbon tax
- Liechtenstein carbon tax
- Luxembourg carbon tax
- Massachusetts state ETS
- Mexico carbon tax
- Mexico pilot ETS
- Netherlands carbon tax
- New Brunswick carbon tax
- New Brunswick ETS
- New Zealand ETS
- Newfoundland and Labrador carbon tax
- Newfoundland and Labrador PSS - ETS
- Northwest Territories carbon tax
- Norway carbon tax
- Nova Scotia CaT - ETS
- Ontario EPS - ETS
- Oregon ETS
- Poland carbon tax
- Portugal carbon tax
- Prince Edward Island carbon tax
- Québec CaT - ETS
- RGGI - ETS
- Saitama ETS
- Saskatchewan OBPS - ETS
- Shanghai pilot ETS
- Shenzhen pilot ETS
- Singapore carbon tax
- Slovenia carbon tax
- South Africa carbon tax
- Spain carbon tax
- Sweden carbon tax
- Switzerland carbon tax
- Switzerland ETS
- Tamaulipas carbon tax
- Tianjin pilot ETS
- Tokyo CaT - ETS
- UK Carbon Price Support
- UK ETS
- Ukraine carbon tax
- Uruguay CO2 tax
- Washington CAR – ETS
- Zacatecas carbon tax
- Other carbon tax, please specify
- Other ETS, please specify
Requested content
General
- Select from the carbon pricing regulation(s) which impacts your operations listed or use “Other, please specify” if the carbon pricing regulation(s) you are using is not included.
- If you select “Other carbon tax/ETS, please specify,” identify the carbon pricing regulation(s) which impacts your operations.
(C11.1b) Complete the following table for each of the emissions trading schemes you are regulated by.
Question dependencies
This question only appears if you select an emissions trading option in response to C11.1a.
Change from last year
Minor change
Rationale
As the number of jurisdictions with carbon pricing policies has doubled over the last decade, users of CDP data are interested in understanding how companies are affected by these schemes. This question provides investors and data users with a sense of the regulatory environments in which companies operate and the potential for future regulation which may impact a company's operations.
Connection to other frameworks
SDG
Goal 13: Climate action
Response options
Please complete the following table.
| 1
|
2
|
3
|
4
|
5
|
| System name
|
% of Scope 1 emissions covered by the ETS
|
% of Scope 2 emissions covered by the ETS
|
Period start date
|
Period end date
|
|
Fixed table rows are populated by selection in C11.1a
|
Numerical field [enter a number from 0-100 using a maximum of 2 decimal places and no commas]
|
Numerical field [enter a number from 0-100 using a maximum of 2 decimal places and no commas]
|
Enter the start date that applies to the data in the row. Use the calendar button or enter dates manually in the format DD/MM/YYYY. Please note that the period reported should overlap with the reporting year.
|
Enter the finish date that applies to the data in the row. Use the calendar button or enter dates manually in the format DD/MM/YYYY. Please note that the period reported should overlap with the reporting year.
|
| 6
|
7
|
8
|
9
|
10
|
11
|
| Allowances allocated
|
Allowances purchased
|
Verified Scope 1 emissions in metric tons CO2e
|
Verified Scope 2 emissions in metric tons CO2e
|
Details of ownership
|
Comment
|
|
Numerical field [enter a number from 0-99,999,999,999 using a maximum of 2 decimal places and no commas]
|
Numerical field [enter a number from 0-99,999,999,999 using a maximum of 2 decimal places and no commas]
|
Numerical field [enter a number from 0-99,999,999,999 using a maximum of 2 decimal places and no commas]
|
Numerical field [enter a number from 0-99,999,999,999 using a maximum of 2 decimal places and no commas]
|
Select from:
- Facilities we own and operate
- Facilities we own but do not operate
- Facilities we operate but do not own
- Other, please specify
|
Text field [maximum 2,400 characters]
|
Requested content
General
- Although some emission trading schemes may apply solely to the operators of facilities, the financial position of facility owners is also affected indirectly by the operation of the scheme. This question therefore applies to both owners and operators of facilities covered by trading schemes.
- Even if your company does not wholly own facilities, please give the total number of emissions and allowances.
System name (column 1)
- This column is driven by the emission trading schemes selected in C11.1a. You should enter information for all applicable schemes.
% of Scope 1 emissions covered by the ETS (column 2)
- This percentage should be calculated based on your gross global Scope 1 emissions over the monitoring period of the emissions trading scheme as specified in columns 4 and 5.
% of Scope 2 emissions covered by the ETS (column 3)
- This percentage should be calculated based on your gross global Scope 2 emissions over the monitoring period of the emissions trading scheme as specified in columns 4 and 5.
- Note that in this question you should only report Scope 2 emissions for which you are directly regulated, i.e. Scope 2 emissions for which you receive allowances directly within an emissions trading scheme. If you do not have direct compliance obligations for Scope 2 emissions, enter zero here.
Period start date and end date (columns 4 and 5)
- The period start date and end date refer to the annual compliance cycle of the emission trading schemes, and not the overall phase of the scheme. For example, the current European Union ETS third phase ran from 2013 to 2020, however the monitoring period of the annual compliance cycle ran from 1st January to 31st December.
- CDP recognizes that emissions trading systems verification deadlines don’t always align with the reporting year disclosed in C0.2. However, please note that the period start date and end dates reported should overlap with the reporting year. If you are using the Export/Import functionality, please check that the imported date is correct.
Verified Scope 1 emissions in metric tons CO2e (column 8)
- Companies participating in systems with verification deadlines at a later date than the CDP disclosure period, such as the California Cap and Trade (CaT), should submit estimates to the best of their knowledge. CDP does not wish to penalize companies for something out of their control.
- You can use the further information field at the end of the questionnaire to correct any submissions from past years that were estimated incorrectly. If doing so reference the question number C11.1b.
Verified Scope 2 emissions in metric tons CO2e (column 9)
- If you do not have direct compliance obligations for Scope 2 emissions (i.e. you have entered 0 in column 3), also enter 0 in this column.
Details of ownership (column 10)
- Select the option that best describes your ownership arrangements for the facilities subject to the scheme identified.
- If you select “Other, please specify,” provide a label for the Details of ownership.
Comment (column 11) (optional)
- If you have selected “Other ETS, please specify” in C11.1a then please provide the full name of the emission trading scheme in this column.
Additional information
Emissions Trading Schemes (ETS)
Further resources on current and proposed emissions trading systems:
(C11.1c) Complete the following table for each of the tax systems you are regulated by.
Question dependencies
This question only appears if you select a carbon tax system in response to C11.1a.
Change from last year
Minor change
Rationale
This question will allow investors to consistently track and analyze, in a detailed and consistent manner, the corporations participating in carbon tax systems as well as what costs they currently bear.
Connection to other frameworks
SDG
Goal 13: Climate action
Response options
Please complete the following table
| Tax system
|
Period start date
|
Period end date
|
% of total Scope 1 emissions covered by tax
|
Total cost of tax paid
|
Comment
|
|
Fixed table rows are populated by selection in C11.1a
|
Enter the start date that applies to the data in the row. Use the calendar button or enter dates manually in the format DD/MM/YYYY. Please note that the period reported should overlap with the reporting year.
|
Enter the finish date that applies to the data in the row. Use the calendar button or enter dates manually in the format DD/MM/YYYY. Please note that the period reported should overlap with the reporting year.
|
Numerical field [enter a number from 0-100 using a maximum of 2 decimal places and no commas]
|
Numerical field [enter a number from 0-999,999,999,999,999 using a maximum of 2 decimal places and no commas]
|
Text field [maximum 2,400 characters]
|
Requested content
General
- Carbon taxes are intended to directly charge emitters for the cost of pollution. However, the policy application of this definition changes on a system-by-system basis and may affect sectors differently. For example, some policies may tax producers directly; others may attribute the cost to consumers of the processed fossil fuels (i.e. utilities); and others yet may tax users such as in the form of big businesses. This question asks for information only on your direct, Scope 1 emissions that are subject to a carbon tax.
Period start date and end date (columns 2 and 3)
- Please note that the period reported should overlap with the reporting year.
- If you are using the Export/Import functionality, please check that the imported date is correct.
% of total Scope 1 emissions covered by tax (column 4)
- This column requests the percentage of your total Scope 1 emissions over the period specified in columns 2 and 3 that were taxed by this carbon tax.
Total cost of tax paid (column 5)
- The total cost of tax paid reported here should be total cost of this carbon tax paid over the period specified in columns 2 and 3.
Comment (column 6) (optional)
- If you select “Other carbon tax, please specify” in C11.1a then please provide the full name of the carbon tax in this column.
Additional information
Implementation of carbon tax: Below are some examples of taxes attributed to various producing/consuming entities.- British Columbia Revenue-Neutral Carbon Tax (2008): The British Columbia carbon tax is a regional carbon tax. The policy applies to all sectors in aims of nudging business towards more energy efficient, and thus more cost efficient, operations. Tax revenue is recycled back to payers in the form of other reductions or returns. Fossil fuel producers and importers are liable for a monthly payment of the tax.
- Japan’s Tax for Climate Change Mitigation (2012): Japan’s carbon tax applies to all sectors and even with some exemptions, captures almost 70% of the country’s GHG emissions. The tax aims to fairly distribute the cost of fossil fuel usage and incentivize the transition to a low-carbon economy. Costs are incurred by the fossil fuel producers, who are expected to pay the tax on a bimonthly basis.
- United Kingdom Carbon Price Floor (2013): The UK’s CPF covers the power sector at a higher tax rate than the EU ETS market price. This policy considers power producers as the users of fossil fuels and thus attributes the quarterly tax for fossil fuels to them.
(C11.1d) What is your strategy for complying with the systems you are regulated by or anticipate being regulated by?
Question dependencies
This question only appears if you select “Yes” or “No, but we anticipate being regulated in the next three years” in response to C11.1
Change from last year
No change
Rationale
This question provides data users with insight into an organizations long-term compliance and regulatory risk management strategy for the carbon pricing systems they are regulated by or anticipate being regulated by.
Connection to other frameworks
SDG
Goal 13: Climate action
Response options
This is an open text question with a limit of 5,000 characters.
Please note that when copying from another document into the ORS, formatting is not retained.
Requested content
General
- Some of the options for compliance include emissions reductions strategies, efficiency upgrades, purchase of allowances and the purchase of carbon credits.
- Depending on how long your company has been regulated by a carbon pricing system, efficiency upgrades may not provide the amount of reductions necessary to comply with regulations. If that is the case for your company, then you are also encouraged to detail your company’s long-term compliance and regulatory risk management strategy; including the specific metric(s) or mechanism(s) used – for example, a dedicated carbon risk management team or the use of an internal carbon price. If you use an internal carbon price, please make note of this here and provide specific details the subsequent question (C11.3a).
Project-based carbon credits
(C11.2) Has your organization canceled any project-based carbon credits within the reporting year?
Change from last year
Modified question
Rationale
Carbon credits are used by organizations for the purposes of compliance or as voluntary carbon offsets and can support the transition to a low carbon future. Information about carbon credits helps data users understand the extent to which companies are meeting their climate commitments through emission reductions or offsets.
Ambition: Companies prioritize emissions reductions in their value chain, and only use high-quality carbon credits to neutralize the impact of sources of residual emissions that cannot be eliminated through value-chain emissions reductions.
Connection to other frameworks
SDG
Goal 13: Climate action
NZAM (FS Only)
Commitment 4
Response options
Select one of the following options:
Requested content
General
- “Canceling” a credit means that the credit cannot be used again, and the exact term used may vary, e.g. retired, surrendered, claimed or used. For further information, please check the Technical Note “Retirement vs. cancellation of instruments."
- Select “Yes” if you have canceled credits during the reporting period, regardless of when you have acquired them.
- Select “No” if you have not canceled credits during the reporting period, regardless of whether you have acquired credits during the reporting period.
- Examples of project-based carbon credits include:
- Verified Carbon Units (VCUs) generated by projects under the VCS program.
-
Gold Standard Verified Emission Reductions (GSVERs) generated by projects under the Gold Standard.
-
Certified Emission Reductions (CERs) generated by activities under the Clean Development Mechanism (CDM).
(C11.2a) Provide details of the project-based carbon credits canceled by your organization in the reporting year.
Question dependencies
This question only appears if you select “Yes” in response to C11.2.
Change from last year
Modified question
Rationale
Carbon credits can be originated from a variety of projects and are verified to a number of standards. Data users are interested in learning about the quality of projects, scope of project types, and the objectives of organizations who have canceled carbon credits and the extent to which the credits are used to achieve these objectives.
Ambition: Carbon credits are issued by a program which adheres to best practice and addresses issues such as additionality, leakage, and reversal.
Connection to other frameworks
SDG
Goal 13: Climate action
NZAM (FS only)
Commitment 4
Response options
Please complete the following table. The table is displayed over several rows for readability. You are able to add rows by using the “Add Row” button at the bottom of the table. *Column/row appearance is dependent on selections in this or other questions.”
| 1
|
2
|
3
|
4
|
5
|
6
|
7
|
| Project type
|
Type of mitigation activity
|
Project description
|
Credits canceled by your organization from this project in the reporting year (metric tons CO2e)
|
Purpose of cancellation
|
Are you able to report the vintage of the credits at cancellation?
|
Vintage of credits at cancellation*
|
Select from:
- Afforestation
- Agriculture
- Agroforestry
- Biochar
- Bioenergy with carbon capture and storage (BECCS)
- Biomass energy
- Cement
- Coal mine/bed methane
- Clean cookstove distribution
- Community projects
- Direct air capture (DAC)
- Energy distribution
- Energy efficiency: households
- Energy efficiency: industry
- Energy efficiency: own generation
- Energy efficiency: service
- Energy efficiency: supply side
- Enhanced weathering and ocean alkalization
- Forest ecosystem restoration
- Fossil fuel switch
- Fugitive
- Geothermal
- HFCs
- Hydro
- Landfill gas
- Landscape projects
- Natural regeneration
- Mangrove protection and restoration
- Methane avoidance
- Mixed renewables
- N2O
- Ocean fertilization
- Peatland protection and restoration
- PFCs and SF6
- Reforestation
- Soil carbon sequestration
- Solar
- Tidal
- Transport
- Waste management
- Wind
- Other, please specify
|
Select from:
- Emissions reduction
- Carbon removal
|
Text field [maximum 2,500 characters]
|
Numerical field [enter a number from 0-999,999,999,999 using a maximum of 2 decimal places and no commas]
|
Select from:
- Compliance with a carbon pricing system
- Voluntary offsetting
- Other, please specify
|
Select from:
|
Numerical field [enter a number between 1900-2023]
|
| 8
|
9
|
10
|
11
|
12
|
13
|
14
|
| Were these credits issued to or purchased by your organization?
|
Credits issued by which carbon-crediting program
|
Method(s) the program uses to assess additionality for this project* |
Approach(es) by which the selected program requires this project to address reversal risk* |
Potential sources of leakage the selected program requires this project to have assessed* |
Provide details of other issues the selected program requires projects to address* |
Comment
|
| Select from:
|
Select from:
- Alberta TIER Emission Offset system
- ACR (American Carbon Registry)
- California Air Resources Board Compliance Offset Program
- CAR (The Climate Action Reserve)
- CCBS (developed by the Climate, Community and Biodiversity Alliance, CCBA)
- CDM (Clean Development Mechanism)
- Emissions Reduction Fund of the Australian Government
- Gold Standard
- Integrity Council for Voluntary Carbon Markets – Approved carbon crediting program
- JCM (Joint Crediting Mechanism)
- JI (Joint Implementation)
- Plan Vivo
- REDD+
- TREES (The REDD+ Environmental Excellence Standard)
- T-COP (Thailand Carbon Offsetting Program)
- VCS (Verified Carbon Standard)
- VER+ (TÜV SÜD standard)
- Not issued by a program
- Other private carbon crediting program, please specify
- Other regulatory carbon crediting program, please specify
|
Select all that apply:
- Consideration of legal requirements
- Investment analysis
- Barrier analysis
- Market penetration assessment
- Positive lists
- Other, please specify
- Not assessed
|
Select all that apply:
- Monitoring and compensation
- Temporary crediting
- Other, please specify
- No requirements
- No risk of reversal
|
Select all that apply:
- Upstream/downstream emissions
- Activity-shifting
- Market leakage
- Ecological leakage
- Other, please specify
- Not assessed
|
Text field [maximum 2,500 characters]
|
Text field [maximum 2,500 characters]
|
[Add Row]
Requested content
Project types (column 1)
-
Select the best match for the project from which the credits canceled in the reporting year originated, or select “Other, please specify”.
-
You will have the opportunity to provide more details of the project in column 3 “Project description”.
Type of mitigation activity (column 2)
- Select whether the project leads to an:
- Emissions reduction i.e., an activity that reduces anthropogenic emissions of a greenhouse gas relative to its emissions in the activity’s baseline scenario (adapted from ICVCM); or
- Carbon removal i.e., an anthropogenic activity that removes carbon dioxide (CO2) from the atmosphere and ensures its long-term storage in terrestrial, geological, or ocean reservoirs, or in long-lasting products (adapted from UNFCCC).
Project description (column 3)
- Briefly describe the project from which the credits canceled in the reporting year originated, including:
- the geographic location of the project; and
- an explanation of how the project leads to GHG emissions reductions or removals (as relevant to your response in column 2).
Credits canceled by your organization from this project in the reporting year (metric tons CO2e) (column 4)
- Enter, in metric tons CO2e, the number of credits from this project that were canceled by your organization in the reporting year.
- The figure reported should be the credits canceled by your organization during the reporting year from the project described in column 3, irrespective of whether the credits were issued to or purchased by your organization.
- “Canceled” means that the certificate cannot be used again. For further information, please check the Technical Note “Retirement vs. cancellation of instruments.”
Purpose of cancellation (column 5)
- Indicate whether the credits were canceled in the reporting year to comply with a carbon pricing system (e.g. an Emissions Trading Scheme as reported in C11.1a-b), or whether the credits were canceled as part of your organization’s strategy for voluntary offsetting.
- [Financial services only] “Other, please specify” can be used by banks and asset managers to solicit information on the approach to offsets to meet commitments under the Net-Zero Banking Alliance and the Net Zero Asset Managers initiative respectively, e.g. if the offsets are used to balance residuals, long-term, additional and certified, and only used where no alternatives to eliminate emissions exist.
Are you able to report the vintage of the credits at cancellation? (column 6)
- Indicate whether you can provide a vintage for the canceled credits. Refer to the Explanation of Terms for more information.
- Select “Yes” even if you can only provide a vintage for a proportion of the credits.
Vintage of credits at cancellation (column 7)
- This column is only presented if you select “Yes” in column 6 “Are you able to report the vintage of the credits at cancellation?”.
- If there is more than one vintage for the credits you have canceled from this project, enter the oldest year.
Were these credits issued to or purchased by your organization (column 8)
- Issued - Select this option if you are the company to which the credits were originally issued as a project participant.
- Purchased - Select this option if you bought the credits from another company.
Credits issued by which carbon crediting program (column 9)
- Select “Integrity Council for Voluntary Carbon Markets – Approved carbon crediting program” if your credits have been issued by a carbon crediting program that is not listed but that has been evaluated and approved by the Integrity Council for Voluntary Carbon Markets.
- When selecting one of the “Other…” options, please refer to the following definitions:
- Private carbon crediting program: A carbon crediting program which has been created by any private entity, such as an NGO, private company, or university.
- Regulatory carbon crediting program: A carbon crediting program which has been created by a government, regulatory agency, or international governmental organization.
- If you select “Not issued by a program”, explain in column 14 “Comment” who has issued the credits.
Method(s) the program uses to assess additionality for this project (column 10)
- This column is only presented if you select any option other than “Not issued by a program” in column 9 “Credits issued by which carbon crediting program”.
- Additionality is demonstrated if the mitigation activity would not have occurred in the absence of a market for offset credits and associated revenues.
- The Integrity Council for the Voluntary Carbon Market (ICVCM) outlines several methods by which a carbon credit verification standard can assess the additionality of a project:
- Consideration of legal requirements – can be used to demonstrate that the project would not have been implemented due to existing legal requirements.
- Investment analysis – can be used to demonstrate that the project would not have been economically attractive without carbon credit revenues.
- Barrier analysis – can be used to demonstrate that the project faced barriers (e.g., financial barriers, institutional barriers, information barriers, or other barriers specific to the project) not faced by alternatives to the project, and that the expectation of carbon credit revenues was decisive for overcoming these barriers.
- Market penetration assessment (also referred to as common practice analysis) – can be used to demonstrate that the project activity was not already common practice in the relevant geographical area.
- Positive lists – can deem the project automatically additional if it meets certain conditions. Companies selecting this option should state in column 13 the eligibility criteria and/or performance benchmarks the standard requires the project to meet to be considered additional.
- If you select “Other, please specify”, provide further details in column 13.
- Select “Not assessed” if the standard does not assess whether the project demonstrates additionality.
Approach(es) by which the selected program requires this project to address reversal risk (column 11)
- This column is only presented if you select any option other than “Not issued by a program” in column 9 “Credits issued by which carbon crediting program”.
- Reversal risk refers to the risk of non-permanence of the mitigation activity.
- The ICVCM outlines two approaches by which a carbon credit verification standard can address, or require the project to address, reversal risk:
- Monitoring and compensation – where the project aims to guarantee carbon storage for a finite period through long-term monitoring and compensation conditions on potential reversals. For example, unavoidable reversals could be compensated for if the project contributes to a pooled buffer reserve of credits which are retired in the case of an unavoidable reversal event.
- Temporary crediting – where the standard issues temporarily valid credits to the project in relation to verified ex-post emission reductions or removals. When a credit expires at the end of its validity period and has been retired by a purchaser, the credit purchaser is obligated to replace it with a permanent credit. Temporary crediting aims to guarantee compensation for reversals indefinitely, because credit purchasers need to cover their obligations once a carbon credit expires.
- No risk of reversal – this option should only be selected for projects where there is no carbon storage and thus no risk of reversal (e.g., renewable energy projects), or where there is no conceivable way for the stored GHGs to be released into the atmosphere. Companies selecting this option should provide a justification of why the project is considered to have no risk of reversal in column 13.
- If you select “Other, please specify”, provide further details in column 13.
Potential sources of leakage the selected program requires this project to have assessed (column 12)
- This column is only presented if you select any option other than “Not issued by a program” in column 9 “Credits issued by which carbon crediting program”.
- Leakage refers to any impact of the project on emissions outside of the project activity – see Explanation of Terms for more information.
- Select the potential sources of leakage emissions the standard selected in column 9 requires the project to assess (sources and examples adapted from the ICVCM):
- Upstream/downstream emissions – direct impacts of the project on upstream or downstream emissions or removals. E.g., emissions associated with the upstream production of fuel used by the project.
- Activity-shifting – emissions shifting to locations not targeted or to emissions not monitored by the project. E.g., the displacement of agricultural activity from land that is afforested.
- Market leakage – emissions occurring elsewhere through an impact on the supply or demand for an emissions-intensive product or service. E.g., rebound effects from energy efficiency measures, where the expected benefit of improved efficiency is reduced due to behavioral or other responses.
- Ecological leakage – emissions occurring indirectly in areas which are hydrologically connected to the project area. E.g., emissions from wetland soils if water levels are lowered due to the project.
- If you select “Other, please specify” provide further details in column 13.
- Select “Not assessed” if the standard does not require the project to assess leakage emissions.
Provide details of other issues the selected program requires projects to address (column 13)
- This column is only presented if you select any option other than “Not issued by a program” in column 9 “Credits issued by which carbon crediting program”.
- Provide details of how the standard requires the project to minimize and, where possible, avoid negative environmental, economic, and social impacts.
- Provide any other relevant details of the standard selected in column 9.
- If you selected “Other, please specify” in columns 10-12, provide further details here.
Comment (column 14) (optional)
- You can use this text field to enter any additional relevant information.
Explanation of terms
- Vintage: The year in which the mitigation activity took place. For emissions reductions or removals, this should be the year in which the emissions reduction/removal took place. Because the verification process can take two to three years from project inception, projects/programs may generate credits for already-reduced emissions (adapted from the ICVCM).
- Additionality (carbon credits): a project is additional if it would not have occurred in the absence of the incentives from the carbon credit mechanism, taking into account all relevant national policies, including legislation, and representing mitigation that exceeds any mitigation that is required by law or regulation, and taking a conservative approach that avoids locking in levels of emissions, technologies or carbon-intensive practices incompatible with the Paris Agreement goals (adapted from the UNFCCC).
- Reversal risk: refers to the risk of non-permanence of the mitigation activity.
- Emissions leakage: also known as “carbon leakage”, refers to the phenomenon through which efforts to reduce emissions in one jurisdiction or sector simply shift emissions to another jurisdiction or sector where they remain uncontrolled or uncounted (Jenkins et al, 2009).
Additional information
The Integrity Council for the Voluntary Carbon Market (ICVCM)
The Integrity Council for the Voluntary Carbon Market (ICVCM) is an independent governance body aiming to ensure the voluntary carbon market accelerates a just transition to 1.5ºC. Their Core Carbon Principles (CCPs) and Assessment Framework (AF) will set new threshold standards for high-quality carbon credits and define which carbon-crediting programs and methodology types are CCP-eligible. Draft versions of both the CCPs and AF have been published and have undergone a period of public consultation in advance of final versions being released.
Paris Agreement Article 6.4 Mechanism
Article 4 of Paragraph 6 of the Paris Agreement establishes “a mechanism to contribute to the mitigation of greenhouse gas emissions and support sustainable development”. This mechanism will take the form a new international carbon market, which will replace the Clean Development Mechanism (CDM). Once the mechanism is operational, it is expected to be the best-practice standard for carbon markets.
Internal price on carbon
(C11.3) Does your organization use an internal price on carbon?
Change from last year
No change
Rationale
Internal carbon pricing has emerged as a multifaceted tool that supports companies in assessing climate-related risks and opportunities. Investors want to know more about organizations who attribute a monetary value to these risks and translate them into a uniform metric.
Response options
Select one of the following options:
- Yes
- No, but we anticipate doing so in the next two years
- No, and we don’t anticipate doing so in the next two years
Additional information
- Internal carbon price: The number of companies embedding an internal carbon price into their business strategies continues to grow. This growth is steady across all sectors and regions; largely driven by the parallel development of regulations that directly or indirectly price carbon and the increasing pressure from shareholders and customers for companies to adequately manage their climate-related risks.
Some common reasons for implementing an internal carbon price are outlined below:
- Managing climate-related risks: Companies internalize the existing, expected or potential price of carbon – from an ETS, carbon tax, or implicit carbon pricing policy – to assess its risk exposure to regulations that affect the cost of emitting CO2e.
- Identifying climate-related opportunities: Companies also use an internal carbon price as a tool to reveal potential opportunities that may emerge in the transition to the low-carbon economy. As policy and legal, market, technological and reputational factors shift, they also present opportunities for companies to seize. When used as a generic proxy in this way, an internal carbon price can help guide strategic decisions, such as low-carbon R&D to create the products and services of the future.
- Transitioning to low-carbon activities: Companies also deliberately use an internal carbon price to drive emissions reductions and incentivize low-carbon activities – such as energy efficiency investments, clean energy, development of green products/services – in order to facilitate a company-wide low-carbon transition.
- Changing internal behavior: Companies may also use an internal carbon price to improve employee awareness of climate-related issues and the financial cost of carbon, energy, or fuel. An internal carbon price can motivate staff to support sustainability initiatives and achieve climate-related commitments and targets.
For more information, please read the following documents:
(C11.3a) Provide details of how your organization uses an internal price on carbon.
Question dependencies
This question only appears if you select “Yes” in response to C11.3.
Change from last year
Modified question
Rationale
Investors have requested data on why and how internal carbon pricing is used as a tool to assess and manage carbon-related risks and opportunities within a business’ operations, supply chain, and investments. This information can help an investor gauge the efficacy of a company’s application of the carbon price in terms of meeting its objectives.
Ambition: Internal carbon prices are applied strategically, enforced across all business decision making processes, and are aligned with the carbon price levels needed to meet the Paris Agreement goals.
Connection to other frameworks
S&P Global Corporate Sustainability Assessment
Internal Carbon Pricing
Response options
Please complete the following table. You are able to add rows by using the “Add Row” button at the bottom of the table.
| 1
|
2
|
3
|
4
|
5
|
6
|
7
|
| Type of internal carbon price
|
How the price is determined
|
Objective(s) for implementing this internal carbon price
|
Scope(s) covered
|
Pricing approach used – spatial variance
|
Pricing approach used – temporal variance
|
Indicate how you expect the price to change over time*
|
Select from:
- Shadow price
- Internal fee
- Internal trading
- Implicit price
- Other, please specify
|
Select all that apply:
- Alignment with the price of allowances under an Emissions Trading Scheme
- Alignment with the price of a carbon tax
- Social cost of carbon
- Price/cost of voluntary carbon offset credits
- Cost of required measures to achieve emissions reduction targets
- Benchmarking against peers
- Price with material impact on business decisions
- Other, please specify
|
Select all that apply:
- Change internal behavior
- Drive energy efficiency
- Drive low-carbon investment
- Identify and seize low-carbon opportunities
- Navigate GHG regulations
- Stakeholder expectations
- Stress test investments
- Reduce supply chain emissions
- Set a carbon offset budget
- Other, please specify
|
Select all that apply:
- Scope 1
- Scope 2
- Scope 3 (upstream)
- Scope 3 (downstream
|
Select from:
- Uniform
- Differentiated
- Other, please specify
|
Select from:
- Static
- Evolutionary
- Other, please specify
|
Text field [maximum 1,000 characters]
|
| 8
|
9
|
10
|
11
|
12
|
| Actual price(s) used – minimum (currency as specified in C0.4 per metric ton CO2e)
|
Actual price(s) used – maximum (currency as specified in C0.4 per metric ton CO2e)
|
Business decision-making processes this internal carbon price is applied to
|
Mandatory enforcement of this internal carbon price within these business decision-making processes
|
Explain how this internal carbon price has contributed to the implementation of your organization’s climate commitments and/or climate transition plan
|
| Numerical field [enter a number from 0-999,999,999,999,999 using a maximum of 2 decimal places and no commas]
|
Numerical field [enter a number from 0-999,999,999,999,999 using a maximum of 2 decimal places and no commas]
|
Select all that apply:
- Capital expenditure
- Operations
- Procurement
- Product and R&D
- Remuneration
- Risk management
- Opportunity management
- Value chain engagement
- Public policy engagement
- Other, please specify
|
Select from:
- Yes, for all decision-making processes
- Yes, for some decision-making processes, please specify
- No
|
Text field [maximum 2,500 characters]
|
[Add Row]
Requested content
Type of internal carbon price (column 1)
- Select the type of internal carbon pricing mechanism your company utilizes, or use “Other, please specify”. Common types of internal carbon prices are outlined below:
- Shadow price – where a hypothetical cost of carbon is attached to each ton of CO2e – as a tool to reveal hidden risks and opportunities throughout its operations and supply chain and to support strategic decision-making related to future capital investments. A shadow price can be used in investment decisions or to set budgets, but no actual financial flows are generated.
- Implicit price: where the cost of emissions abatement is divided by the tons of CO2e abated. An implicit price is calculated retroactively, after a company achieves its desired emissions reductions. This calculation helps quantify the capital investments required to meet climate-related targets and is frequently used as a benchmark for implementing a more strategic internal carbon price. Some companies may also internalize the cost of purchasing carbon credits to set an implicit carbon price.
- Internal fee – mechanisms which charge responsible internal business units for their GHG emissions. An internal fee mechanism approach results in actual financial flows as the collected revenue is reinvested back into clean technologies and other activities that help transition the entire company towards lower-carbon operations and investments.
- Internal trading – mechanisms which allow internal business units to trade allocated carbon credits.
- If your organization utilizes more than one type of internal carbon price, add a row to provide details of each type
How the price is determined (column 2)
- Select the approach(es) you have used to determine the actual price (i.e., the level or height) of the internal carbon price.
- For example, you may use the current or future projected price of allowances under an Emissions Trading Scheme (ETS) to determine the level of your shadow price or internal fee.
Objective(s) for implementing this internal carbon price (column 3)
- Select your company’s objective(s) for implementing the internal carbon price. In many cases, companies report multiple objectives – particularly as developments occur that require a readjustment of their pricing approach to maximize its effectiveness.
- The available options reflect the most common objectives that companies disclose to CDP; this list is not exhaustive, and you can specify other objectives by selecting “Other, please specify.”
Scope(s) covered (column 4)
- Identify the Scope(s) of emissions covered by the internal carbon pricing mechanism. An effective internal carbon price is one that incentivizes a company to reduce greenhouse gas emissions throughout their value chain and to integrate low-carbon activities into their operations.
- It is best practice for companies to consider their impact beyond just Scope 1 and 2 emissions to address risks and opportunities associated with their Scope 3 emissions as well, such as in-sourcing and procurement decisions (upstream) and R&D decisions regarding innovation in the market (downstream).
Pricing approach used – spatial variance (column 5)
- Select the pricing approach which reflects how the actual price varies across the organization
- Uniform pricing: a single price that is applied throughout the company independent of geography, business unit, or type of decision
- Differentiated pricing: a price that varies by region, business unit or type of decision
Pricing approach used – temporal variance (column 6)
- Select the pricing approach which reflects how the actual price will develop over time:
- Static pricing: a price that is constant over time
- Evolutionary pricing: a price that develops over time
Indicate how you expect the price to change over time (column 7)
- This column only appears if you select “Evolutionary” in column 6.
- Indicate how you expect the actual price of your evolutionary carbon price to change over time. Aim to be specific and quantitative in your response by disclosing the expected percent increase over a specified timeframe.
- State whether you are aligning the price with a specific climate-related regulation, commitment, or global goal.
Actual price(s) used – minimum/maximum (currency as specified in C0.4 per metric ton CO2e) (columns 8 and 9)
- If you are reporting a uniform carbon price, you should enter the same figure in columns 8 and 9.
- If you are reporting a differentiated carbon price, you should enter the minimum actual price applied within your organization in column 8, and the maximum price applied within your organization in column 9.
- These figures should be in the same currency that you selected in question C0.4 for all financial information disclosed throughout your response.
Business decision-making processes this internal carbon price is applied to (column 10)
- Disclose all of the business decision-making processes that the internal carbon pricing mechanism applies to. For example, if your organization has set an internal carbon price to drive low-carbon investments, the internal carbon price may be used to inform decision-making processes around research and development of new products/services, procurement, and/or capital expenditure.
Mandatory enforcement of this internal carbon price within these business decision-making processes (column 11)
- The degree to which an internal carbon price is enforced in the business decision-making process will vary by company.
- Indicate whether your organization enforces the use of the price within the business decision making processes as a mandatory measure.
- If you select “Yes, for some decision-making processes, please specify”, specify the business decision making processes selected in column 10 to which the internal carbon price is enforced as mandatory.
Explain how this internal carbon price has contributed to the implementation of your organization’s climate commitments and/or climate transition plan (column 12)
- Explain how the internal carbon price has contributed to the implementation of your organization’s climate commitments and/or, if relevant, climate transition plan, through its application in key business decision-making processes (as selected in column 10) and/or the achievement of the original objectives (as selected in column 3).
- Provide regional, sectoral, and/or operational context to your response.
- If the internal carbon price has not impacted your business in any way, explain why – are there specific challenges associated with your current mechanism?
C12 Engagement
Module Overview
In order to truly reduce global emissions, companies must engage with their value chain on climate-related issues. Questions in this module examine how organizations are working with their suppliers, customers and other partners.
This module provides data users with insight into the different types of activities in which organizations engage to influence public policy on climate-related issues.
The module also investigates whether organizations integrate non-financial metrics and data into mainstream financial reports, which is aligned with the TCFD’s primary aim to have climate-related information disclosed in financial filings.
Key changes
- New question:
- C12.5 asks about collaborative industry initiatives related to environmental issues.
- Modified questions:
- C12.3 – has revised wording and dropdown options to focus on whether a company assesses if its activities could directly or indirectly influence policy, law, or regulation that may impact the climate.
- C12.3a – has two new columns on the category of the policy, law or regulation that may impact the climate a company is engaging on, and how it relates to their climate transition plan.
- C12.3b – has revised drop-down options and minor changes to wording for clarity.
Click here for a list of all changes made this year.
Sector-specific content
Additional questions on supplier engagement for the following high-impact sectors:
- Agricultural commodities
- Financial services
- Food, beverage & tobacco
- Paper & forestry
Pathway diagram - questions
This diagram shows the general questions contained in module C12. To access question-level guidance, use the menu on the left to navigate to the question.
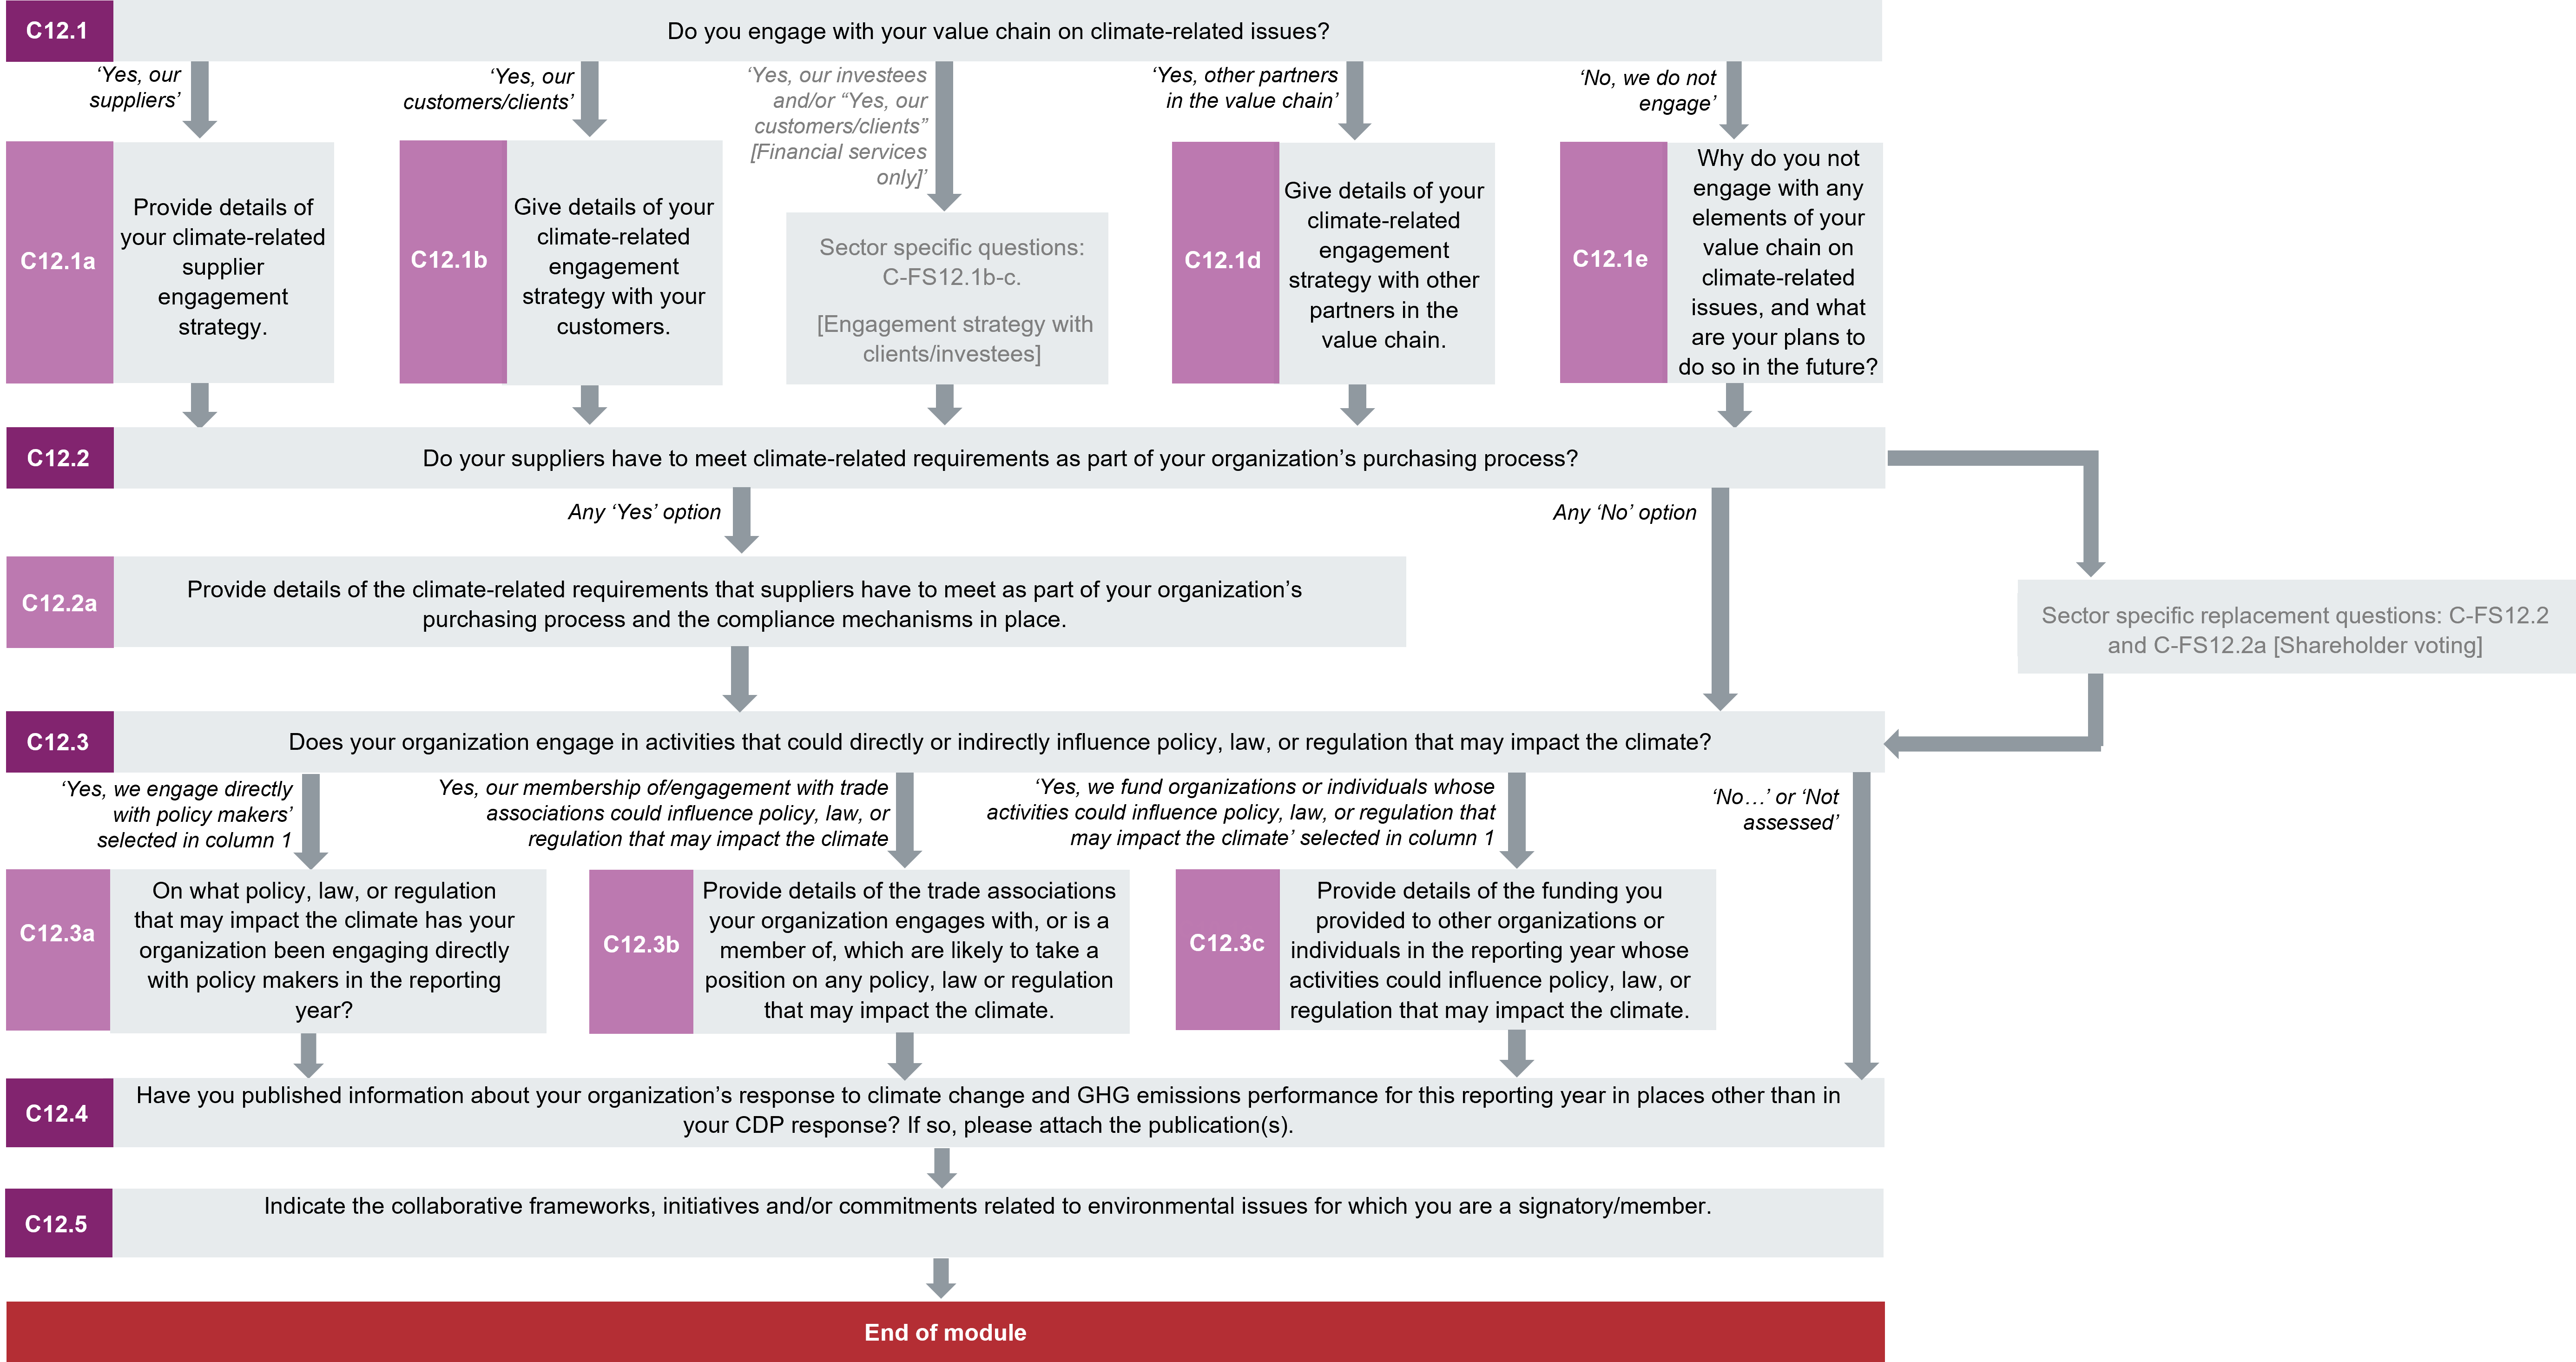
Value chain engagement
(C12.1) Do you engage with your value chain on climate-related issues?
Change from last year
Modified guidance
Rationale
The majority of most companies' emissions occur outside their direct operations. In order to truly reduce global emissions, companies must engage with their value chain on climate-related issues. This question seeks to ascertain which companies are engaging in the best practice of working with upstream and downstream partners to reduce negative environmental impacts.
Connection to other frameworks
SDG
Goal 12: Responsible consumption and production
Response options
Select all that apply from the following options:
- Yes, our suppliers
- Yes, our customers/clients
- Yes, our investees [Financial services only]
- Yes, other partners in the value chain
- No, we do not engage
Requested content
General
- Select all that apply for the reporting year, however if you select “No, we do not engage” do not select any of the other options.
- Select yes, only if you have engagements that cover GHG emissions and/or climate-related strategies (i.e. target setting, renewable energy procurement, etc.).
- Other partners in the value chain are any companies that you work with in your up- or downstream activities that are not your suppliers or customers. For example, you could select this option if you engage with your franchisees on GHG emissions and climate change strategies.
- Note that employees can be treated as value chain partners if they are making their own decisions on, for example, how they commute to work. However, if employees are under direction of their manager for business travel then they should not be treated as external to the organization; in this instance, the value chain partner is the provider of the business travel, not the employee.
Note for financial services sector companies:
- Consider your engagement activity with customers/clients and investees to encourage better disclosure and practices around climate-related risks.
- Select “Yes, other partners in the value chain” if your organization engages with other financial system actors e.g. credit rating agencies, auditors, or stock exchanges.
- Further details can be provided in subsequent questions C-FS12.1b and C-FS12.1c.
(C12.1a) Provide details of your climate-related supplier engagement strategy.
Question dependencies
This question only appears if you select “Yes, our suppliers” in response to C12.1.
Change from last year
Minor change
Rationale
Answers to this question provide investors and data users with more transparency regarding companies' supplier engagement processes. As the majority of most companies’ emissions occur outside their direct operations, data users are interested in understanding how organizations are working with their suppliers to drive best practice and ameliorate climate-related issues.
Ambition: Companies facilitate and incentivize their suppliers to develop and progress climate transition plans.
Connection to other frameworks
SDG
Goal 12: Responsible consumption and production
RE100
Response options
Please complete the following table. You are able to add rows by using the “Add Row” button at the bottom of the table.
| Type of engagement
|
Details of engagement
|
% of suppliers by number
|
% total procurement spend (direct and indirect)
|
% of supplier-related Scope 3 emissions as reported in C6.5
|
Rationale for the coverage of your engagement
|
Impact of engagement, including measures of success
|
Comment
|
|
Select from:
- Information collection (understanding supplier behavior)
- Engagement & incentivization (changing supplier behavior)
- Innovation & collaboration (changing markets)
- Other, please specify
|
Select all that apply:
Information collection (understanding supplier behavior)
-
Collect GHG emissions data at least annually from suppliers
- Collect targets information at least annually from suppliers
- Collect climate-related risk and opportunity information at least annually from suppliers
- Collect climate transition plan information at least annually from suppliers
- Collect other climate related information at least annually from suppliers
- Other, please specify
Engagement & incentivization (changing supplier behavior)
- Run an engagement campaign to educate suppliers about climate change
- Provide training, support, and best practices on how to make credible renewable energy usage claims
- Provide training, support, and best practices on how to set science-based targets
- Directly work with suppliers on exploring corporate renewable energy sourcing mechanisms
- Climate change performance is featured in supplier awards scheme
- Offer financial incentives for suppliers who reduce your operational emissions (Scopes 1 & 2)
- Offer financial incentives for suppliers who reduce your downstream emissions (Scopes 3)
- Offer financial incentives for suppliers who reduce your upstream emissions (Scopes 3)
- Offer financial incentives for suppliers who increase the share of renewable energy in their total energy mix
-
Offer financial incentives for suppliers who develop/adopt a climate transition plan
-
Facilitate adoption of a unified climate transition approach with suppliers
- Other, please specify
Innovation & collaboration (changing markets)
- Run a campaign to encourage innovation to reduce climate impacts on products and services
- Collaborate with suppliers on innovative business models to source renewable energy
- Invest jointly with suppliers in R&D of relevant low-carbon technologies
- Other, please specify
|
Percentage field [enter a percentage from 0-100 using a maximum of 2 decimal places]
|
Percentage field [enter a percentage from 0-100 using a maximum of 2 decimal places]
|
Percentage field [enter a percentage from 0-100 using a maximum of 2 decimal places]
|
Text field [maximum 2,400 characters]
|
Text field [maximum 2,400 characters]
|
Text field [maximum 2,400 characters]
|
[Add Row]
Requested content
General
- If you select “Other, please specify,” provide a label for the “Type of engagement” or “Details of engagement.”
Type of engagement (column 1)
- Select the type of engagement activity your organization participates in from the drop-down.
- Information collection (understanding supplier behavior) - Select this option if the purpose of your engagement with suppliers is to gather data outside of specific initiatives.
- Engagement & incentivization (changing supplier behavior) - Choose this option if you offer specific incentives for your suppliers or engage with them to meet climate-related goals or strategies. Incentives can be recognition (i.e. award schemes or special acknowledgements) or financial. Engagement can be training, support, or collaboration with suppliers.
- Innovation & collaboration (changing markets) - Select this option if you specifically encourage your suppliers to develop new ways to reduce climate change impacts of the products/services that they offer. This can include formal campaigns and calls for partnerships as well as informal collaboration opportunities.
Details of engagement (column 2)
- Expand on the engagement activity (selected in column 1) your organization participates in by selecting all the relevant engagement methods from the drop-down options.
- Your selection in column 1 determines which options you will see here. E.g. If you select “Innovation & collaboration (changing markets)”, you will only see the associated drop-down options here.
- Note that “Climate transition plan information” refers to any information collected from suppliers to help your organization develop or implement its climate transition plan, and also to disclosures (e.g. to CDP) of whether your suppliers have a climate transition plan in place.
- You should select “Facilitate adoption of a unified climate transition approach with suppliers” if your organization is ensuring that your transition approach, as set out through your climate commitments or climate transition plan, is adopted by your suppliers, where possible.
% of suppliers by number (column 3)
- Include the percentage of the total number of suppliers within your value chain that the suppliers participating in the engagement activity detailed in this row represents. For example, if there are 2000 suppliers within your value chain, and for a specific engagement activity you engaged with 500 suppliers, enter a value of 25%.
% total procurement spend (column 4)
- Include the percentage of total procurement spend (for the reporting year) that the group of suppliers participating in the engagement activity detailed in this row represent. Note that total (direct and indirect) procurement spend includes all operational expenses on raw materials, goods, and services procured.
- Do not include new or potential suppliers for whom you do not have spend data.
% of supplier-related Scope 3 emissions as reported in C6.5 (column 5)
- Provide the percentage of supplier-related scope 3 emissions reported in C6.5 that are attributable to suppliers participating in the engagement activity selected in this row.
- Include any upstream Scope 3 categories that you have reported in C6.5 in your calculation (i.e. Categories 1-8 and “Other (Upstream)”). You may exclude Category 7 “Employee Commuting” if you do not engage with the suppliers of your employees’ commuting activities (e.g. transport providers).
- If, for example, the company reports supplier-related emissions in C6.5 in two Scope 3 categories, “Purchased goods and services” (category 1) and “Upstream transportation and distribution” (category 4), they may calculate the % in this column using the formula:

Rationale for coverage of your engagement (column 6)
- Explain how and why this group of suppliers was chosen for the engagement selected in column 1 (e.g. proportion of spend, geographic location, etc.). The description should be company-specific and include details on what the engagement activity entails.
- Use this column to specify which tier(s) of suppliers are included in the calculation of the figure reported in column 3.
Impact of engagement, including measures of success (column 7)
- Use this column to discuss the impact of this engagement and how you measure its success.
- Include a threshold at which you consider your impact to be successful with regard to the measure of success. For example, if you selected “Offer financial incentives for suppliers who increase the share of renewable energy in their total energy mix” in column 2, the measure of success could be an increase in the share of renewable energy in the engaged suppliers’ total energy mix of 5% per year.
- Provide a company-specific description of the impact of your climate-related supplier engagement strategy, including examples of positive outcomes achieved. For example, this could include supplier GHG emissions reductions and/or improved climate change strategies including target setting.
Comment (column 8) (optional)
- Use this column to provide any additional explanation that is relevant to capture the full complexity of the emissions changes, using no more than 2400 characters.
Example response
See table below:
| Type of engagment | Details of engagement | % of suppliers by number | % total procurement spend (direct and indirect) | % of supplier-related Scope 3 emissions as reported in C6.5 | Rationale for the coverage of your engagement | Impact of engagement, including measures of success | Comment |
|---|
| Engagement & incentivization (changing supplier behavior) | Run an engagement campaign to educate suppliers about climate change | 0.6 | 27.4 | 42 | Our supplier engagement strategy is based around the Scope 3 component of our SBTi-approved science-based target, which committed to working with our suppliers (representing 70% of its supply chain emissions) so that they set their own science-based reduction targets and report annual emissions by 2025. The coverage of this target prioritizes Company A’s engagement not on a vaguely defined list of “key suppliers” but rather on the absolute emissions of all suppliers, which will maximize the science-based target’s impact. The target’s requirement of suppliers to report emission reduction progress will not only encourage progress on GHG emissions management but also allow measurement of absolute emissions reductions. At this point this coverage is only of legacy Company A suppliers as we continue to integrate Subsidiary X’s supply chain into all of our goals and targets. | Company A’s science-based target was recently approved by SBTi. As we move toward our target, the impact of engagement will include supplier GHG emissions reductions and/or improved climate change strategies including target setting. Based on an estimated average absolute emissions reduction of 15% per supplier involved in achieving the goal, we anticipate the absolute emissions impact will be 100,000 tCO2e per year (a 10.5% reduction in Company A’s total scope 3 emissions).
Success will be measured by percent of suppliers engaged, with a target to have 70% of supply chain emissions set their own science-based reduction targets and report annual emissions by 2025. In 2019, we measured the success of this strategy versus our targets for the first time as we have engaged suppliers representing 33% of Company A’s legacy supply chain emissions through the CDP Supply Chain platform. Of this, suppliers representing 26% of Company A’s legacy supply chain emissions have an approved, committed to or plan to set an SBT.
| Our engagement of suppliers for our approved science-based target will primarily be through CDP Supply Chain and in the future, we will strive to report on legacy Subsidiary X’s supply chain emissions progress. |
Explanation of terms
Climate transition plan: a time-bound action plan that clearly outlines how an organization will achieve its strategy to pivot its existing assets, operations, and entire business model towards a trajectory that aligns with the latest and most ambitious climate science recommendations, i.e., halving greenhouse gas (GHG) emissions by 2030 and reaching net-zero by 2050 at the latest, thereby limiting global warming to 1.5 degrees Celsius. Please refer to the CDP Climate Transition Plan technical note for more details.
(C12.1b) Give details of your climate-related engagement strategy with your customers.
Question dependencies
This question only appears if you select “Yes, our customers/clients” in response to C12.1.
Change from last year
Minor change
Rationale
This question provides investors and data users with more transparency regarding companies' customer engagement processes. As the majority of most companies’ emissions occur outside their direct operations, data users are interested in understanding how organizations are working with their customers to drive best practice and ameliorate climate-related issues.
Ambition: Companies engage with customers in the development of their climate transition plan.
Connection to other frameworks
SDG
Goal 12: Responsible consumption and production
Response options
Please complete the following table. You are able to add rows by using the “Add Row” button at the bottom of the table.
| Type of engagement
|
Details of engagement
|
% of customers by number
|
% customer-related Scope 3 emissions as reported in C6.5
|
Please explain the rationale for selecting this group of customers and scope of engagement
|
Impact of engagement, including measures of success
|
|
Select from:
- Education/information sharing
- Collaboration & innovation
- Other, please specify
|
Select from drop-down options below
|
Percentage field [enter a percentage from 0-100 using a maximum of 2 decimal places]
|
Percentage field [enter a percentage from 0-100 using a maximum of 2 decimal places]
|
Text field [maximum 2,400 characters]
|
Text field [maximum 2,400 characters]
|
[Add Row]
Details of engagement drop-down options:
Education/ information sharing
Select one of the following options:
- Run an engagement campaign to educate customers about your climate change performance and strategy
- Run an engagement campaign to educate customers about the climate change impacts of (using) your products, goods, and/or services
- Share information about your products and relevant certification schemes (i.e. Energy STAR)
Collaboration & Innovation
Select one of the following options:
- Collaborate with customers in creation and review of your climate transition plan
- Run a campaign to encourage innovation to reduce climate change impacts
- Other, please specify
Requested content
General
Use this question to disclose details of your climate-related engagement strategy with your customers/clients. You should include information related to the climate-related engagement you have conducted with any organizations or individuals who purchase or use your products and/or services.
Type of engagement (column 1)
- Select the type of engagement activity your organization participates in from the drop-down.
- If you select “Other, please specify,” provide a label for the “Type of engagement”.
Details of engagement (column 2)
- Expand on the “Type of engagement” (selected in column 1) your organization participates in by selecting the relevant details of engagement from the drop-down.
- Education/information sharing - Select this option if the aim of engagement is to educate and inform customers about climate change and GHG emissions but not necessarily instigate any specific action.
- Collaboration & innovation - Select this option if you specifically encourage your customers to develop new ways to reduce the climate change impacts of the products/services that they procure from you. This can include formal campaigns and calls for partnerships as well as informal opportunities to reduce negative impacts.
% of customers by number (column 3)
- Present as a percentage the number of customers participating in this engagement activity.
- [Financial services only] “Customers” refers to all customers, consumers, clients and policyholders that the organization provides financing and/or underwriting services to. For the purposes of this question the focus is on your corporate, commercial and industrial (C&I) customers as opposed to your retail customers. However, where appropriate, retail customers may also be considered.
% of customer-related Scope 3 emissions as reported in C6.5 (column 4)
- Only include the percentage of customer-related Scope 3 emissions reported in C6.5 that are attributable to customers participating in the activity selected in this row.
- [Financial services only] Additionally, as most of your customer-related Scope 3 emissions are attributable to Category 15 “Investments”, also consider the emissions that you report in C-FS14.1a/C-FS14.1b that are attributable to customers participating in the activity selected in this row.
Explain the rationale for selecting this group of customers and scope of engagement (column 5)
- Explain how and why this group of customers was chosen for the engagement selected in column 1 (e.g. proportion of revenue generated, geographic location, etc.). Description should be company-specific and include details on what the engagement activity entails.
- [Financial services only] Additionally, explain the type of portfolio the customers fall under and the basis of your answer to column “Portfolio coverage” column. This can be either total or outstanding commitments based.
Impact of engagement, including measures of success (column 6)
- Use this column to discuss the impact of this engagement and how you measure its success.
- Include a threshold at which you consider your impact to be successful with regard to the measure of success. For example, if you selected “Run an engagement campaign to educate customers about the climate change impacts of (using) your products, goods, and/or services” to educate customers on the energy saving settings of your products, the measure of success could be a 20% increase in customers enabling the energy saving settings of your products.
- Please provide examples of positive outcomes achieved. For example, this could include customers reducing use-phase GHG emissions or increasing renewable energy procurement.
- The description should be company-specific and include details on the impact of climate-related customer engagement strategy.
Explanation of terms
Climate transition plan: a time-bound action plan that clearly outlines how an organization will achieve its strategy to pivot its existing assets, operations, and entire business model towards a trajectory that aligns with the latest and most ambitious climate science recommendations, i.e., halving greenhouse gas (GHG) emissions by 2030 and reaching net-zero by 2050 at the latest, thereby limiting global warming to 1.5 degrees Celsius. Please refer to the CDP Climate Transition Plan technical note for more details.
Note for financial services companies:
- “Customers” refers to all customers, consumers, clients and policyholders that the organization provides financing and/or underwriting services to. For the purposes of this question the focus is on your corporate, commercial and industrial (C&I) customers as opposed to your retail customers, however, where appropriate, retail customers may also be considered.
Example response
See table below:
Type of engagement
|
Details of engagement
|
% of customers by number
|
% of customer -related Scope 3 emissions as reported in C6.5
|
Please explain the rationale for selecting this group of customers and scope of engagement.
|
Impact of engagement, including measures of success
|
| Education/information sharing
|
Run an engagement campaign to educate customers about the climate change impacts of (using) our products, goods, and/or services
|
60
|
90
|
As a manufacturer of consumer electronic goods, a number of our products have energy saving features that can enable our customers to reduce their energy consumption when using our devices. For example, since 2018 all of our mobile phones have an “Eco plus mode” that can reduce energy consumption and increase battery life by 60%.
During the reporting year we ran an engagement campaign to educate our customers in Europe about the benefits of using Eco plus mode to reducing energy consumption and prevent climate change. All customers received a notification informing them of the benefits of Eco Plus mode, along with a shortcut button to enable it.
The European market was chosen because it represents 60% of our customers by number, but these customers are responsible for 90% of our customer-related Scope 3 emissions as reported in C6.5, and use of the Eco Plus mode was low compared to other markets. We therefore prioritized this group of customers to maximize the impact of the campaign. Following our success, we plan to roll out the campaign to our remaining markets in our next reporting year.
|
We measure the success of our engagement campaign by the % of customers who subsequently enabled Eco plus mode on their devices, with a threshold of 30% or above considered a success.
Following the campaign, 52% of our 8 million European customers subsequently enabled Eco Plus mode on their mobile device. We estimate that the corresponding reduction in energy consumption resulted in a reduction of scope 3 use-phase GHG emissions by 32% in the reporting year.
|
(C12.1d) Give details of your climate-related engagement strategy with other partners in the value chain.
Question dependencies
This question only appears if you select “Yes, other partners in the value chain” in response to C12.1.
Change from last year
Modified guidance
Rationale
While engaging with suppliers is considered best practice, some companies may find it appropriate to work with other aspects of their value chain beyond customers and suppliers. This question provides investors and data users with more transparency into companies' engagement strategies beyond the standard or expected parties.
Connection to other frameworks
SDG
Goal 12: Responsible consumption and production
NZAM (FS only)
Commitment 8
Response options
This is an open text question with a limit of 5,000 characters.
Please note that when copying from another document into the ORS, formatting is not retained.
Requested content
General
- Note that your answer to this question should only include information not captured in C12.1a or C12.1b, and therefore only be pertinent to elements of your value chain that are not suppliers or customers, such as any franchisees. Please ensure that you explicitly identify which value chain partners you are referring to in your response.
- [Financial services only] These partners could include other financial system actors such as credit rating agencies, auditors, or stock exchanges.
- Provide a company-specific description of your climate-related engagement strategy, including methods of engagement, how you prioritize engagements with other elements of your value chain, and how you measure the success of these engagements.
- Methods of engagement could include, but are not limited to:
- one to one meetings or written correspondence
- collaborative projects
- holding training events
- advertising, etc.
- Your strategy for prioritizing engagements should detail how you have chosen the parts of the value chain as well as the individual partners to focus your engagement on.
- Detail how you have, or propose to, measure success and any positive outcomes achieved in the reporting year.
- Provide an example or case study of your engagement with other partners in the value chain.
(C12.1e) Why do you not engage with any elements of your value chain on climate-related issues, and what are your plans to do so in the future?
Question dependencies
This question only appears if you select “No, we do not engage” in response to C12.1.
Change from last year
No change
Rationale
As engaging with at least some part of the value chain is considered best practice, investors and data users need to know why companies are not yet working to affect positive environmental change beyond their direct operations.
Connection to other frameworks
SDG
Goal 12: Responsible consumption and production
Response options
This is an open text question with a limit of 5,000 characters.
Please note that when copying from another document into the ORS, formatting is not retained.
Requested content
General
- Provide a company-specific explanation of why you do not engage with any elements of your value chain on climate-related issues, and outline your plans to do so in the future. Please clearly separate the two elements of the question in your response.
Climate-related requirements
(C12.2) Do your suppliers have to meet climate-related requirements as part of your organization’s purchasing process?
Change from last year
No change
Rationale
Setting climate-related requirements for suppliers increases their awareness of climate-related issues and drives climate action across the supply chain. This question indicates to data users the extent to which a company is committed to driving action through its supply chain.
Connection to other frameworks
SDG
Goal 12: Responsible consumption and production
Response options
Select one of the following options:
- Yes, climate-related requirements are included in our supplier contracts
- Yes, suppliers have to meet climate-related requirements, but they are not included in our supplier contracts
- No, but we plan to introduce climate-related requirements within the next two years
- No, and we do not plan to introduce climate-related requirements within the next two years
Requested content
General
- Select “Yes, climate-related requirements are included in our supplier contracts” if your suppliers are obliged, as outlined in their contract with your organization, to adhere to specific climate-related requirements set by your organization.
- Select “Yes, suppliers have to meet climate-related requirements, but they are not included in our supplier contracts” if your suppliers have to meet climate-related requirements as part of your organization’s purchasing process, but the requirements are not formally written as a contractual obligation. For example, your organization may have a non-contractual supplier code of conduct featuring climate-related requirements, or climate-related requirements may be included in your organization’s supplier selection process.
- Climate-related requirements can be either pre-requisites to establishing a purchasing relationship or be specified as metrics to achieve once onboarding is completed.
- Companies responding to either of the “Yes” options will be further prompted to identify the climate-related requirements and provide details of the compliance measures in place in the following question.
Explanation of terms
- Purchasing process: The formal process of buying goods and services. The term is broader than “procurement process” as it also includes supply chain management.
(C12.2a) Provide details of the climate-related requirements that suppliers have to meet as part of your organization’s purchasing process and the compliance mechanisms in place.
Question dependencies
This question only appears if any “Yes…” option is selected in response to C12.2.
Change from last year
No change
Rationale
Setting climate-related requirements for suppliers increases their awareness of climate-related issues and drives climate action across the supply chain. This question indicates to data users the extent to which a company is committed to driving action through its supply chain.
Connection to other frameworks
SDG
Goal 12: Responsible consumption and production
RE100
Response options
Please complete the following table. You are able to add rows by using the “Add Row” button at the bottom of the table.
Climate-related requirement
|
Description of this climate related requirement
|
% suppliers by procurement spend that have to comply with this climate-related requirement
|
% suppliers by procurement spend in compliance with this climate-related requirement
|
Mechanisms for monitoring compliance with this climate-related requirement
|
Response to supplier non-compliance with this climate-related requirement
|
Select from
drop-down options below
|
Text field [maximum 1,500 characters]
|
Percentage field [enter a percentage from 0-100 using a maximum of 2 decimal places]
|
Percentage field [enter a percentage from 0-100 using a maximum of 2 decimal places]
|
Select all that apply:
- Certification
- Supplier self-assessment
- First-party verification
- Second-party verification
- Off-site third-party verification
- On-site third-party verification
- Grievance mechanism/Whistleblowing hotline
- Supplier scorecard or rating
- No mechanism for monitoring compliance
- Other, please specify
|
Select from:
- Exclude
- No response
- Retain and engage
- Suspend and engage
- Other, please specify
|
[Add row]
Climate-related requirement drop-down options:
- Complying with regulatory requirements
- Climate-related disclosure through a public platform
- Climate-related disclosure through a non-public platform
- Fugitive emissions reductions
- Implementation of emissions reduction initiatives
- Measuring product-level emissions
- Purchasing renewable energy
- Setting a low-carbon energy target
- Meeting minimum emissions intensity standards for the supplied product or service
- Product Carbon Footprint (PCF) reductions
- Setting a science-based emissions reduction target
- Setting a renewable energy target
- Waste reduction and material circularity
- Other, please specify
Requested content
Climate-related requirement (column 1)
- Select the option that best describes the climate-related requirement that suppliers have to meet. If the climate-related requirement is part of a supplier code of conduct or supplier selection process, select the option that best describes what is required by the code of conduct or supplier selection process.
Description of this climate-related requirement (column 2)
- Describe the climate-related requirement selected in column 1. For example, if you selected “Meeting minimum emissions intensity standards the supplied product or service”, state the minimum emissions intensity figure you expect your suppliers to meet for a specific product or service, and the product life cycle stages the emissions intensity figure applies to (see “Additional information” for further guidance on life cycle stages).
- Specify whether your suppliers must meet this climate-related requirement as part of their contract with your organization. If not, specify how this climate-related requirement is integrated into your organization’s purchasing process.
% suppliers by procurement spend that need to comply with this climate-related requirement (column 3)
- State the percentage of your organization’s total procurement spend in the reporting year that the group of suppliers that have to meet this climate-related requirement represent. Note that total (direct and indirect) procurement spend includes all operational expenses on raw materials, goods, and services procured.
- Do not include new or potential suppliers for whom you do not have spend data.
% suppliers by procurement spend in compliance with this climate-related requirement in reporting year (column 4)
- State the percentage of your organization’s total procurement spend in the reporting year that the group of suppliers that are in compliance with this climate-related requirement represent. Note that total (direct and indirect) procurement spend includes all operational expenses on raw materials, goods, and services procured.
- Do not include new or potential suppliers for whom you do not have spend data.
Mechanisms for monitoring compliance with this climate-related requirement (column 5)
- Select the type(s) of monitoring mechanisms your organization has in place to assess compliance with the climate-related requirement selected in column 1. If your organization does not monitor compliance of this climate-related requirement, select “No mechanism for monitoring compliance”.
- Certification - Select this option if suppliers are required to obtain certification to demonstrate compliance.
- Supplier self-assessment - Select this option if suppliers assess compliance themselves.
- First-party verification - Select this option if compliance is verified by your organization, but verification is carried out by personnel not involved in the design or implementation of the operations being verified.
- Second-party verification - Select this option if compliance is verified by a related entity with an interest in the company or operation being assessed, such as the business customer of a production/processing operation or a contractor that also provides services other than verification.
- Off-site third-party verification - Select this option if compliance is verified off-site by a third party e.g. through a desktop audit.
- On-site third-party verification - Select this option if compliance is verified on-site by a third party e.g. through an inspection or on-site audit.
- Grievance mechanism/Whistleblowing hotline - Select this option if compliance is monitored through a grievance mechanism or whistleblowing hotline that supplier non-compliance can be reported to.
- Supplier scorecard or rating - Select this option if supplier compliance is monitored through a supplier scorecard or rating system
Response to supplier non-compliance with this climate-related requirement (column 6)
- Select the most appropriate or most commonly applied procedure for responding to non-compliant suppliers. Further details on each of the options are provided below:
- Exclude: Select this option if you end a purchasing relationship with a non-compliant supplier (in the case of a prior or ongoing relationship) or avoid purchasing from a given non-compliant supplier (in the case of spot markets or lack of an ongoing purchasing relationship). This option is also applicable if you do not establish a purchasing relationship because of supplier unwillingness to comply with the climate-related requirement.
- No response: Select this option if you do not have a procedure for responding to non-compliant suppliers.
- Retain and engage: Select this option if you continue to purchase the product or service while engaging with the supplier to resolve the non-compliance(s), potentially leading to suspension or exclusion for continued non-compliance.
- Suspend and engage: Select this option if you temporarily pause purchasing from a supplier or put the onboarding of a new supplier on hold but continue to engage with the supplier to resolve the non-compliance(s).
- If you select "Retain and engage" or "Suspend and engage" and the engagement is applicable to the reporting year, you should disclose details of this engagement in C12.1a.
- If you have a publicly available procedure for your response to supplier non-compliance you may attach it here (this is optional).
Explanation of terms
- Third-party verification: Verification conducted by an independent entity that does not provide other services to the company.
Additional information
Life cycle stages (in line with the GHG Protocol Product Life Cycle Accounting and Reporting Standard):
- Material acquisition & pre-processing stage: A life cycle stage that begins when resources are extracted from nature and ends when the product components enter the gate of the studied product’s production facility.
- Production stage: A life cycle stage that begins when the product components enter the production site for the studied product and ends when the finished studied product leaves the production gate.
- Use stage: A life cycle stage that begins when the consumer takes possession of the product and ends when the used product is discarded.
- End-of-life stage: A life cycle stage that begins when the used product is discarded by the consumer and ends when the product is returned to nature (e.g. incinerated) or allocated to another product’s life cycle.
Agricultural supplier engagement
(C-AC12.2/C-FB12.2/C-PF12.2) Do you encourage your suppliers to undertake any agricultural
or forest management practices with climate change mitigation and/or adaptation
benefits?
Question dependencies
This question only appears if you select “Yes, our suppliers” in response to C12.1 AND if you select “Elsewhere in value chain” or “Both own land and elsewhere in value chain” in response to the “Agriculture/Forestry" row in C-AC0.6/C-FB0.6/C-PF0.6
Change from last year
No change
Rationale
This question gathers information on whether you encourage your suppliers to undertake any management practice with climate change benefits. This demonstrates to data users that your organization is acting on either preventing, reducing, controlling, and/or adapting to the effects of climate change in its supply chain. By encouraging your suppliers to adopt such management practices on their land, you promote awareness of sustainable production practices and ultimately contribute to reducing climate-related risks in your supply chain.
Response options
Select one of the following options:
Requested content
General
- Select ‘Yes’ if you have encouraged /are in the process of encouraging your suppliers to adopt actions or management practices with direct or indirect climate change benefits. These may refer to preventing, reducing, controlling and/or adapting to effects of climate change.
- There is a wide variety of agricultural/forestry management practices that have either direct or indirect climate change mitigation and/or adaptation benefits. A list of common examples can be found in Appendix A of this document.
(C-AC12.2a/C-FB12.2a/C-PF12.2a) Specify which
agricultural or forest management practices with
climate change mitigation and/or adaptation benefits you encourage your
suppliers to undertake and describe your role in the implementation of each
practice.
Question dependencies
This question only appears if you select "Yes" in response to C-AC12.2/C-FB12.2/C-PF12.2.
Change from last year
No change
Rationale
This question gathers information on which management practice with climate change benefits you encourage your suppliers to undertake and your role on the implementation. This demonstrates to data users that your organization is acting on either preventing, reducing, controlling, and/or adapting to the effects of climate change in its supply chain. By encouraging your suppliers to adopt such management practices on their land, you promote awareness of sustainable production practices and ultimately contribute to reducing climate-related risks in your supply chain.
Response options
Please complete the following table. You are able to add rows by using the “Add Row” button at the bottom of the table.
| Management practice reference number
|
Management practice
|
Description of management practice
|
Your role in the implementation
|
Explanation of how you encourage implementation
|
Climate change related benefit
|
Comment
|
|
Select from:
- MP1
- MP2
- MP3
- MP4
- MP5
- MP6
- MP7
- MP8
- MP9
- MP10
- MP11
- MP12
- MP13
- MP14
- MP15
- MP16
- MP17
- MP18
- MP19
- MP20
|
Select from:
- Afforestation
- Agroforestry
- Biodiversity considerations
- Change in the topography or landscapes
- Composting
- Crop diversity
- Contour farming
- Crop rotation
- Diversifying farmer income
- Efficient equipment use
- Equipment maintenance and calibration
- Enhanced forest regeneration practices
- Fertilizer management
- Fire control
- Governmental or institutional policies and programs
- Green harvesting
- Integrated pest management
- Knowledge sharing
- Land use change
- Low carbon energy use
- Low tillage and residue management
- Livestock management
- Manure management
- Nitrogen-fixing plants as cover crop
- Organic farming
- Practices to increase wood production and forest productivity
- Permanent soil cover (including cover crops)
- Pest, disease and weed management practices
- Reducing energy use;
- Reforestation
- Restoration
- Replacing fossil fuels by renewable energy sources
- Restoration of degraded lands and cultivated organic soils
- Rice management
- Seed variety selection
- Selective logging
- Selecting species to maximize carbon capture
- Species introduction
- Timing of farm operations
- Waste management
- Other, please specify
|
Text field [maximum 2,400 characters]
|
Select all that apply:
- Financial
- Knowledge sharing
- Operational
- Procurement
- None
- Other, please specify
|
Text field [maximum 2,400 characters]
|
Select all that apply:
- Emissions reductions (mitigation)
- Increasing resilience to climate change (adaptation)
- Increase carbon sink (mitigation)
- Reduced demand for fossil fuel (adaptation)
- Reduced demand for fertilizers (adaptation)
- Reduced demand for pesticides (adaptation)
- Other, please specify
|
Text field [maximum 1,000 characters]
|
[Add Row]
Requested content
General
- If your organization encourages your suppliers to undertake many actions, prioritize the disclosure of those that have had/are expected to have the greatest benefit to your suppliers (e.g. reducing CO2e emissions, saving costs, increasing productivity).
Management practice reference number (column 1)
- Select an identifier for each of management practice. This reference number shall be used to track progress on your specific project in the following years.
- You may report up to 20 management practices.
Management practice (column 2)
- Select the option that best describes the action or management practice your organization encourages its suppliers to adopt. See Appendix A for details on each management practice listed.
- If none of the options are applicable to your organization, select ‘Other, please specify’ and indicate the management practice you encourage suppliers to adopt.
Description of management practice (column 3)
- Provide a brief company-specific description of the action or management practice, including the methods and tools used to implement it.
- Provide an explanation as to why you have chosen this practice and how you expect this to mitigate climate change effects and/or improve your business resilience.
- Specify the percentage of total suppliers that you encourage to adopt this action or management practice and explain any exclusions if you do not cover your entire supply chain.
Your role in the implementation (column 4)
- Select the option that best describes your role in the implementation of the action or management practice. Select all options that apply.
- Consider the following definitions:
- Financial –you provide financial support to your suppliers
- Knowledge sharing – you support knowledge sharing of agricultural/forestry management practices amongst your suppliers
- Operational –you have operational control over the production activities that fall outside of your organizational boundary
- Procurement –you encourage specific agricultural/forestry management practices through requirements in your procurement relationships
- If none of the options are applicable to your organization, select ‘Other, please specify’ and indicate your organization’s role in implementing these practices.
Explanation of how you encourage implementation (column 5)
- Explain how you have encouraged your suppliers to adopt the action or management practice selected in column 2, by including details of your role in the implementation indicated in column 4 and providing company-specific examples.
Climate change related benefit (column 6)
- Select the climate change mitigation/adaptation benefits that your suppliers have/expect to receive from the implementation of this action or management practice. Select all options that apply.
- If none of the options are applicable to your organization, select ‘Other, please specify’ and indicate the appropriate climate change related benefit.
Comment (column 7) (optional)
- You may use this field to specify and provide a description of the methods and tools used to evaluate the climate change benefits associated with the management practices and any further details.
(C-AC12.2b/C-FB12.2b/C-PF12.2b) Do you collect information from your suppliers about the
outcomes of any implemented agricultural/forest management practices you have
encouraged?
Question dependencies
This question only appears if you select "Yes" in response to C-AC12.2/C-FB12.2/C-PF12.2.
Change from last year
No change
Rationale
This demonstrates to data users that your organization is committed to working towards reducing the impacts of climate change by not only encouraging its suppliers to adopt practices with climate change benefits but also by assessing these benefits after the practices are implemented. Data users are interested to know whether your organization assesses the impact of its actions to address climate-related risks.
Response options
Select one of the following options:
Requested content
General
- You should select ‘Yes’ if you collect information on the outcomes of any agricultural/forestry management practices that your suppliers implemented on their land encouraged by you.
- You can use the comment box to provide details on your response, by clicking on the “speech bubble” icon.
(C-AC12.2c/C-FB12.2c/C-PF12.2c) Why do you not encourage your suppliers to undertake any agricultural/forest management practices with climate change mitigation and/or adaptation benefits?
Question dependencies
This question only appears if you select "No" in response to C-AC12.2/C-FB12.2/C-PF12.2.
Change from last year
No change
Rationale
Data users wish to know the main reason why you do not encourage your suppliers to undertake any management practices with climate change benefits and any plans you might have to engage with your suppliers regarding managing practices in the next two years.
Response options
Please complete the following table:
| Primary reason
|
Please explain
|
|
Select from:
- Lack of internal resources
- We plan to introduce a process in the next two years
- Not an immediate business priority
- Judged to be unimportant
- No instruction from management
- Other, please specify
|
Text field [maximum 4,000 characters]
|
Requested content
Primary reason (column 1)
- Select the option that best describes the primary reason why you indicated that you do not encourage your suppliers to undertake any agricultural/forestry management practices or actions with climate change benefits.
- If none of the reasons are applicable to your organization, select ‘Other, please specify’ and indicate the primary reason you do not encourage suppliers in this context.
Please explain (column 2)
- If you selected ‘Lack of internal resources,’ specify the main challenges you experience to performing such engagement.
- If you selected ‘We plan to introduce a process in the next two years,’ describe your plans for engagement, by including:
- The percentage of suppliers you are planning to cover.
- Which practices you will encourage your suppliers to adopt and why.
- Brief explanation of how the implementation of these practices may benefit your suppliers and consequently your business.
- How you plan to approach and support your suppliers on the implementation of these management practices.
Public policy engagement
(C12.3) Does your organization engage in activities that could either directly or indirectly influence policy, law, or regulation that may impact the climate?
Change from last year
Modified question
Rationale
Data users wish to understand how companies’ policy engagement on climate change relate to other stances taken. It is important that companies maintain a consistent approach to issues -engaging in some activities whose purpose is to discredit climate science, for instance, while also working with other groups to advance solutions and adaptations to climate change sends conflicting messages to data users about that company’s priorities and stance. This question provides data users with insight into the different types of activities that organizations engage in, and enables companies to disclose the processes they use to make sure that their position on climate change is compatible with both the activities in which they partake, and the global temperature goals of the Paris Agreement.
Ambition: Companies assess whether their external engagement activities could directly or indirectly influence policy, law, or regulation that could support, or undermine, a 1.5°C world.
Connection other frameworks
S&P
Global Corporate Sustainability Assessment
Environmental Policy & Commitments
NZAM (FS only)
Commitment 9
Response options
Please complete the following table.
| External engagement activities that could directly or indirectly influence policy, law, or regulation that may impact the climate
|
Does your organization have a public commitment or position statement to conduct your engagement activities in line with the goals of the Paris Agreement?
|
Attach commitment or position statement(s)
|
Describe the process(es) your organization has in place to ensure that your external engagement activities are consistent with your climate commitments and/or climate transition plan
|
Primary reason for not engaging in activities that could directly or indirectly influence policy, law, or regulation that may impact the climate
|
Explain why your organization does not engage in activities that could directly or indirectly influence policy, law, or regulation that may impact the climate
|
Select all that apply:
- Yes, we engage directly with policy makers
- Yes, our membership of/engagement with trade associations could influence policy, law, or regulation that may impact the climate
- Yes, we fund organizations or individuals whose activities could influence policy, law, or regulation that may impact the climate
- No, we have assessed our activities, and none could either directly or indirectly influence policy, law, or regulation that may impact the climate
- Not assessed
|
Select from:
- Yes
- No, but we plan to have one in the next two years
- No, and we do not plan to have one in the next two years
|
[Attachment(s)]
|
Text field [maximum 2,500 characters]
|
Select from:
- Important but not an immediate priority
- Judged to be unimportant
- Lack of internal resources
- No instruction from management
- Other, please specify
|
Text field [maximum 2,500 characters]
|
Requested content
General
- This question is focused on external engagement with policy makers, government departments, or regulatory bodies on a regional, local, national, or international level.
- Responses should be relevant to the reporting year only (as defined by your answer to C0.2).
- There will be a wide range of activities that could be considered as each of these options. In response to this question, please select all that apply regardless of your role and how significant those activities are for your company or a third party.
- For trade associations and funding other organizations or individuals, you should identify any relationships where the other party takes an active role in climate change, even if your own relationship with them is not climate change-focused. You will be given an opportunity to describe the engagement in subsequent questions.
- If you fund political candidates or parties you should select “Yes, we fund organizations or individuals whose activities could influence policy, law, or regulation that may impact the climate” even if you do not engage with them directly on specific legislation.
- Do not select "No, we have assessed our activities, and none could either directly or indirectly influence policy, law, or regulation that may impact the climate” or “Not assessed” as well as one of the other options, as this would be a non-logical response.
- Your selections for this question will determine which other questions will appear in this section.
Does your organization have a public commitment or position statement to conduct your engagement activities in line with the goals of the Paris Agreement? (column 2)
- This should take the form of a clear, public statement that your organization will ensure its direct and indirect engagement activities are aligned with the goals of the Paris Agreement.
- Alignment with the goals of the Paris Agreement: refers to the Paris Agreement long-term temperature goal, as expressed in relevant IPCC reports, in particular the IPCC Sixth Assessment Report (AR6) and the IPCC Special Report on Global Warming of 1.5°C (SR1.5).
- The statement should specifically refer to the Paris Agreement, rather than e.g. your organizations climate change policy or targets.
Attach commitment or position statement(s) (column 3)
- This column only appears if “Yes” is selected in “Does your organization have a public commitment or position statement to conduct your engagement activities in line with the goals of the Paris agreement?” (column 2).
- Even where the relevant information is web-based (e.g. an item on your website), you must produce a static document to attach, due to the need to maintain a fixed response over time that can be accessed in full at any time in the future; a URL is inherently dynamic and therefore cannot fulfill this requirement.
Describe the process(es) your organization has in place to ensure that your external engagement activities are consistent with your climate commitments and/or climate transition plan (column 4)
- The intention of this column is to understand how your organization manages the multiple engagement activities around climate change across business divisions and geographies to ensure that you have a common approach that is also consistent with your strategy on climate change.
- Explain the processes that you have in place, or if you do not have any in place, how you plan to address this potential for conflict in the future.
Primary reason for not engaging in activities that could directly or indirectly influence policy, law, or regulation that may impact the climate (column 5)
- This column only appears if “No, we have assessed and none of our activities could directly or indirectly influence policy, law, or regulation that may impact the climate” is selected in “Engagement in activities that could directly or indirectly influence policy, law, or regulation that may impact the climate” (column 1).
- If more than one reason applies to your organization, select the reason which is most relevant and elaborate on the other reason(s) in column 6.
Explain why your organization does not engage in activities that could directly or indirectly influence policy, law, or regulation that may impact the climate (column 6)
- This column only appears if “No, we have assessed and none of our activities could directly or indirectly influence policy, law, or regulation that may impact the climate" is selected in “Engagement in activities that could directly or indirectly Direct or indirect engagement that could influence policy, law, or regulation that may impact the climate” (column 1).
- Provide a company-specific explanation as to why your organization does not engage in activities which could directly or indirectly influence policy, law, or regulation that may impact the climate, and outline any plans to engage in such activities in the future.
Additional information
Examples of engagement activity
- Direct engagement - This includes all activity where companies (or their representatives such as law firms or public affairs agencies engaged directly by the company) engage with policy makers or regulators on the development of law or regulation. Examples of such activities include responding to a consultation, sitting on a working group or lobbying activities directed at individuals or groups that are part of the process of developing, reviewing or amending a law or regulation. Direct engagement can include any stage in the policy or regulation development process, from the selection of options to final consultation comments, but does not include compliance with a new or updated requirement once it has come into force.
- Trade associations - Trade associations (sometimes also referred to as industry associations, trade groups, trade bodies, or industry trade groups) are an association of people or companies in a particular business or trade, organized to promote their common interests. Trade associations are relevant here as they present an “industry voice” to governments to influence their policy development. The majority of organizations are members of multiple trade associations, many of which take a position on climate change and actively engage with policy makers on the development of policy and legislation on behalf of their members. If you are a member of a trade association that engages on climate change, regardless of your own involvement, you should select “trade associations” in question C12.3.
- Funding other organizations - In this context, other organizations can include research institutions, Non-Governmental Organizations (NGOs), trusts, universities, and other organizations whose activities could influence policy, law, or regulation that may impact the climate. Funding may take the form of membership fees, sponsorship, donations etc. offered to organizations. The financial support that you give them may or may not be climate change-related, however if they do engage in work that may impact climate change then you should select this option.
- For more information please see the 'Guide for Responsible Corporate Engagement in Climate Policy' produced in 2013 by CDP alongside UN Global Compact, Ceres, The Climate Group, WWF and the World Resources Institute.
(C12.3a) On what policy, law, or regulation that may impact the climate has your organization been engaging directly with policy makers in the reporting year?
Question dependencies
This question only appears if you select “Direct engagement with policy makers” in response to C12.3.
Change from last year
Modified question
Rationale
Data users wish to understand how companies’ policy engagement on climate change relate to other stances taken. This question provides increased transparency regarding organizations’ direct engagement with policy makers, and whether the engagement is aligned with the global temperature goals of the Paris Agreement.
Ambition: Companies align their engagement with policy makers with the goals of the Paris Agreement, and engage on policies which are central to the achievement of their climate transition plan.
Connection to other frameworks
NZAM (FS only)
Commitment 9
Response options
Please complete the following table. You are able to add rows by using the “Add Row” button at the bottom of the table.
| 1
|
2
|
3
|
4
|
5
|
6
|
7
|
|
Specify the policy, law, or regulation on which your organization is engaging with policy makers
|
Category of policy, law, or regulation that may impact the climate
|
Focus area of policy, law, or regulation that may impact the climate
|
Policy, law, or regulation geographic coverage
|
Country/area/region the policy, law, or regulation applies to
|
Your organization’s position on the policy, law, or regulation
|
Description of engagement with policy makers
|
|
Text field [maximum 1,500 characters]
|
- Climate change mitigation
- Climate change adaptation
- Low-carbon products and services
- Carbon pricing, taxes, and subsidies
|
Select all that apply from the drop-down below
|
Select from:
- Global
- Regional
- National
- Sub-national
- Unknown
|
Select all that apply:[Country/area/region drop-down list]
|
Select from:
- Oppose
- Neutral
- Support with no exceptions
- Support with minor exceptions
- Support with major exceptions
- Undecided
|
Text field [maximum 2,500 characters]
|
| 8
|
9
|
10
|
| Details of exceptions (if applicable) and your organization’s proposed alternative approach to the policy, law or regulation
|
Have you evaluated whether your organization’s engagement on this policy, law, or regulation is aligned with the goals of the Paris Agreement?
|
Please explain whether this policy, law or regulation is central to the achievement of your climate transition plan and, if so, how?
|
| Text field [maximum 2,500 characters]
|
Select from:
- Yes, we have evaluated, and it is aligned
- Yes, we have evaluated, and it is not aligned
- No, we have not evaluated
|
Text field [maximum 2,500 characters]
|
[Add Row]
Focus of policy, law or regulation that may impact the climate drop-down options (column 3)
Climate change mitigation
- Climate-related reporting
- Climate-related targets
- Climate transition plans
- Emissions – CO2
- Emissions – methane
- Emissions – other GHGs
- International agreement related to climate change mitigation
- Low-carbon, non-renewable energy generation
- New fossil fuel energy generation capacity
- Renewable energy generation
- Traceability requirements
- Transparency requirements
- Verification and audits
- Other, please specify
Climate change adaptation
- International agreement related to climate change adaptation
- Construction and housing
- Food security
- Planning
- Public health
- Transport infrastructure
- Other, please specify
Low-carbon products and services
- Alternative fuels
- Circular economy
- Electricity grid access for renewables
- Energy attribute certificate systems
- Energy efficiency requirements
- Extended Producer Responsibility (EPR)
- Green electricity tariffs/renewable energy PPAs
- Low-carbon innovation and R&D
- Technology requirements
- Sustainable finance
- Other, please specify
Carbon pricing, taxes, and subsidies
- Carbon taxes
- Emissions trading schemes
- Carbon offsets
- Subsidies for renewable energy projects
- Subsidies for low-carbon, non-renewable energy projects
- Subsidies for fossil fuel exploration and/or extraction
- Subsidies on products or services
- Subsidies on infrastructure
- Taxes on products or services
- Other, please specify
Requested content
Specify the policy, law, or regulation on which your organization is engaging with policy makers (column 1)
- Provide the name of the legislation and the key actions it proposes.
- If you are engaging with multiple policies as part of a policy package, you may group this into a single row. If you are only engaging on part of a policy package, specify which parts you are engaging with and respond to the question based only on the parts you engage with rather than the whole policy package (e.g. If you are engaging with policymakers on the EU Fit for 55 package, you may report this in a single row).
- If you are engaging with multiple policies related to a single topic as part of a focus area or engagement strategy (e.g. if you have a plastics policy strategy engaging with multiple policies related to plastic), you may group these into a single row.
- If you are engaging on the same policies in multiple jurisdictions (e.g. if you are engaging with emissions trading schemes in multiple countries), you may group these into a single row.
- There is no need to provide details on all legislation that your organization has engaged with policy makers on – only those on which you have been actively engaging in the reporting year.
Category of policy, law, or regulation that may impact the climate (column 2)
- This column relates to the general type of legislation that your organization is engaging with.
- Climate change mitigation – policies related to reducing greenhouse gas emissions.
- Climate change adaptation – policies related to adjusting natural or human systems to a changing climate.
- Low-carbon products and services – policies related to products, services and business models with lower GHG emissions.
- Carbon pricing, taxes, and subsidies – policies related to using market signals to put a cost on emitting greenhouse gases.
Focus area of policy, law or regulation that may impact the climate (column 3)
- This column relates to the specific area in which the legislation that your organization is engaging on falls.
- The data from this column allows data users to assess comparable legislative developments across multiple geographies.
- Select “Emissions – other GHGs” if the legislation aims to reduce GHGs other than CO2 or methane, such as the gases regulated under the Kyoto and Montreal protocols.
Country/area/region the policy, law or regulation applies to (column 5)
- This column only appears if “Regional”, “National”, “Sub-national” is selected in “Policy, law or regulation geographic coverage” (column 3)
- If the policy, law, or regulation is at the sub-national level, select “Other, please specify” and specify the region(s) within a nation to which it applies.
Your organization’s position on the policy, law or regulation (column 6)
- This should reflect your organization’s overall position on this particular legislation. For example:
- “Support” – select this option if you are engaging in full support of this legislation across all the geographies in which you are engaging on it.
- “Support with minor exceptions” – select this option if you are engaging in support of this legislation with either minor exceptions to the approach or with minor exceptions to geographies for whom it is proposed and where you are actively engaging. For example, if you support the principle of a carbon tax but oppose certain ways in which it is being applied, select this option. You will be given the chance to explain any exceptions in column 7.
- “Support with major exceptions” – select this option if you are engaging in support of this legislation with either major exceptions to the approach or with major exceptions to geographies for whom it is proposed and where you are actively engaging.
- “Neutral” – select this option if you have taken part in engagement activities for this legislation but have not put forward a view.
- "Oppose” – select this option if you have been engaging against this legislation across all relevant geographies.
- “Undecided” – select this option if you have been engaging on this legislation at an early stage in the development process and have yet to give an opinion or attempt to influence the policy development process in any direction.
Description of engagement with policy makers (column 7)
- Use the text field to provide details of how your organization is engaging (e.g., responding to a consultation, meeting directly with policy makers, etc.) on the legislation.
Details of exceptions (if applicable) and your organization’s proposed alternative approach to the policy, law or regulation (column 8)
- This column only appears if “Support with minor exceptions”, “Support with major exceptions”, or “Oppose” is selected in “Your organization’s position on the policy, law or regulation” (column 5)
- If your organization supports the legislation with exceptions, provide details of the exceptions and what you would propose in their place.
- If your organization opposes the legislation, provide details of an alternative legislative approach that you feel would more effectively reduce carbon emissions in the corporate sector. For example, if you support mandatory climate-related reporting but oppose its schedule for implementation, you should propose an alternative legislative timeframe for the implementation of mandatory climate-related reporting.
Have you evaluated whether your organization’s engagement is aligned with the goals of the Paris Agreement? (column 9)
- Alignment with the goals of the Paris Agreement: refers to the Paris Agreement long-term temperature goal, as expressed in relevant IPCC reports, in particular the IPCC Sixth Assessment Report (AR6) and the IPCC Special Report on Global Warming of 1.5°C (SR1.5).
- Engagement that is aligned with the Paris Agreement could include, for example:
- Support of legislation that aims to reduce emissions in line with the Paris Agreement e.g. government subsidies on electric vehicles and associated implementation technology.
- Opposition of legislation that risk to detail Paris Agreement e.g. legislative approval of new fossil fuel extraction or generation facilities in a particular jurisdiction.
Please explain whether this policy, law or regulation is central to the achievement of your climate transition plan and, if so, how (column 10)
- Engagement on policies which are central to the achievement of your transition plan could include e.g., support for policies which enable the development of markets and/or provide incentives to manufacture the low-carbon products and services needed for your sector to meet its 1.5°C goal, or opposition to policies that would present a barrier to your organization’s transition.
- Explain how this policy, law, or regulation contributes to the achievement of your climate transition plan and describe if and how your organization is relying on this change to achieve your climate transition plan.
Example response
| Specify the policy, law, or regulation on which your organization is engaging with policy makers | Category of policy, law, or regulation that may impact the climate | Focus area of policy, law, or regulation that may impact the climate | Policy, law, or regulation geographic coverage | Country/area/region the policy, law, or regulation applies to |
|---|
| The UK Department for Business, Energy & Industrial Strategy (BEIS) consultation on Business Energy Efficiency | Climate change mitigation | Climate-related reporting | National | United Kingdom |
| EU ETS | Carbon pricing, taxes, and subsidies | Emissions trading schemes | Regional | EU27
Iceland
Norway
Liechtenstein
United Kingdom
|
| Your organization’s position on the policy, law, or regulation
|
Description of engagement with policy makers
|
Details of exceptions (if applicable) and your organization’s proposed alternative approach to the policy, law or regulation
|
Have you evaluated whether your organization’s engagement is aligned with the goals of the Paris Agreement?
|
Please explain whether this policy, law or regulation is central to the achievement of your climate transition plan and, if so, how
|
| Support with no exceptions
|
Attended the BEIS public webinar and responded to the consultation on Mandatory climate-related financial disclosures by publicly quoted companies, large private companies and LLPs
|
N/A
|
Yes, we have evaluated, and it is aligned
|
N/A
|
| Support with minor exceptions
|
Met directly with policymakers from the European Commission’s Directorate-General for Climate Action, to communicate the commercial benefits and risks of phase IV proposals for the EU ETS.
|
We broadly support the phase IV proposals, however we advocate for a more ambitious 3% annual reduction in the overall number of emission allowances, as opposed to the current rate of 2.2%.
|
Yes, we have evaluated, and it is aligned
|
N/A
|
(C12.3b) Provide details of the trade associations your organization is a member of, or engages with, which are likely to take a position on any policy, law or regulation that may impact the climate
Question dependencies
This question only appears if you select “Yes, our membership of/engagement with trade associations could influence policy, law, or regulation that may impact the climate” in response to column 1 in C12.3.
Change from last year
Modified question
Rationale
Trade associations are a crucial tool through which companies can shape policy and interact with legislators and industry peers. These trade associations can potentially play a significant role in the development and adoption of climate policy. As such, investors and data users expect companies to be transparent about their relationships and responsibilities with the groups which are likely to take a position on legislation related to climate change.
Ambition: Companies align their engagement with, or membership of, trade associations with the goals of the Paris Agreement, and seek to influence the position of the associations with regards to these goals.
Response options
Please complete the following table. You are able to add rows by using the “Add Row” button at the bottom of the table.
| Trade association
|
Is your organization's position on climate change policy consistent with theirs?
|
Has your organization attempted to influence their position in the reporting year?
|
Describe how your organization’s position is consistent with or differs from the trade association’s position, and any actions taken to influence their position
|
Funding figure your organization provided to this trade association in the reporting year, (currency as selected in C0.4) |
Describe the aim of your organization’s funding
|
Have you evaluated whether your organization’s engagement with this trade association is aligned with the goals of the Paris Agreement?
|
|
Select from drop-down options in table below
|
Select from:
- Consistent
- Inconsistent
- Mixed
- Unknown
|
Select from:
- Yes, and they have changed their position
- Yes we attempted to influence them but they did not change their position
- Yes, we publicly promoted their current position
- Yes, we publicly opposed their current position
- Yes, we decided to terminate our membership within the next two years
- Yes, we terminated our membership in the reporting year
- No, we did not attempt to influence their position
- No, we do not know their position
|
Text field [maximum 2,500 characters]
|
Numerical field [enter a number from 0 to 999,999,999,999,999, using up to 2 decimal places]
|
Text field [maximum 2,500 characters]
|
Select from:
- Yes, we have evaluated, and it is aligned
- Yes, we have evaluated, and it is not aligned
- No, we have not evaluated
|
[Add Row]
Trade association drop-down options (column 1)
- Advanced Energy Economy (AEE)
- Alliance for Automotive Innovation
- Alliance of Automobile Manufacturers
- American Chemistry Council
- American Fuel & Petrochemical Manufacturers
- American Gas Association
- American Legislative Exchange Council
- American Petroleum Institute
- American Wind Energy Association (AWEA)
- Business Council of Australia
- Business Roundtable
- BusinessEurope
- California Chamber of Commerce
- Canadian Association of Petroleum Producers
- CEMBUREAU: The European Cement Association
- Confederation of British Industry (CBI)
- Confederation of Indian Industries (CII)
- Consumer Goods Forum (CGF)
- Cross Sector Biodiversity Initiative (CSBI)
- Edison Electric Institute (EII)
- Eurelectric
- Eurometaux
- European Automobile Manufacturers Association
- European Chemical Industry Council (CEFIC)
- European Roundtable of Industrialists (ERT)
- European Steel Association (Eurofer)
- Federation of French Industry (MEDEF)
- Federation of German Industries (BDI)
- Federation of Indian Chambers of Commerce & Industry (FICCI)
- FuelsEurope
- German Automotive Association (VDA)
- German Chemical Industry Association (VCI)
- Global Off-Grid Lighting Association (GOGLA)
- Global Wind Energy Council (GWEC)
- International Air Transport Association
- International Association of Oil and Gas Producers (IOGP)
- International Chamber of Commerce (ICC)
- International Chamber of Shipping
- International Council on Mining & Metals (ICMM)
- Japan Business Federation (Keidanren)
- Japan Chemical Industry Association/日本化学工業協会
- Japan Iron and Steel Federation
- Minerals Council of Australia
- National Association of Manufacturers
- National Mining Association
- Portland Cement Association
- Solar Energy Industries Association (SEIA)
- SolarPower Europe
- Sustainable Agriculture Initiative Platform (SAIP)
- The Japan Electrical Manufacturers’ Association (JEMA)
- Tropical Forest Alliance
- US Chamber of Commerce
- WindEurope
- World Coal Association
- World Steel Association
- Other, please specify
Requested content
Trade association (column 1)
- If none of the listed options apply, select “Other, please specify” and enter the name of the trade association.
- Note that this question asks you to provide details of all trade associations you are a member of that take a position on climate change, not only (but including) those for which you have a formal representation on or provide funding beyond membership.
Is your organization's position on climate change policy consistent with theirs? (column 2)
- Select the option which best describes the consistency of your organization’s position on climate change policy with the trade association’s. Refer to the “Additional information” for resources on the climate change policy positions of trade associations.
- You will have the opportunity to provide more details in column 4.
Has your organization attempted to influence their position in the reporting year? (column 3)
- Select the option which best describes the actions your organization has taken, or is in the process of taking, to influence the trade association’s position on climate change.
-
If you selected in column 2 that your position is “Consistent” with the trade association’s and you therefore did not attempt to influence their position, you should select “No, we did not attempt to influence their position” in this column.
-
If you select any option other than ‘Unknown’, you will have the opportunity to provide more details on how your position is consistent with or differs from the trade association’s in column 4.
Describe how your organization’s position is consistent with or differs from the trade association’s position, and any actions taken to influence their position (column 4)
- This column only appears if you select any option other than ‘Unknown’ in column “Is your organization’s position on...” (column 2)
- Provide details of the trade association’s position on climate change and give examples of any activities the trade association has undertaken in the reporting year to influence climate change policy.
- Elaborate on your selections in columns 2 and 3. For example:
- If your organization’s position is “Inconsistent” or “Mixed”, explain how your organization’s position on climate change differs from the trade association’s position and any actions the trade association has taken in support of their position.
- If you have attempted to change the trade association’s position on climate change in the reporting year, describe the actions you took to achieve this and the associated timeframe. If you did not attempt to change the trade association’s position on climate change in the reporting year, explain why not.
Funding figure your organization provided to this trade association in the reporting year, (currency as selected in C0.4) (column 5)
- Enter the total amount of funding you have provided to this trade association in the reporting year, including any membership or other fees.
- You should include in this figure the estimated value of other, non-financial support you have provided to this trade association in the reporting year (e.g. benefits, etc.).
Describe the aim of your organization’s funding (column 6)
- This column only appears if the value for column 5 is greater than 0.
- Give an overview of what you aim to achieve through your funding, including any specific outcomes in relation to the trade association’s position on climate change and its activities to influence climate change policy.
Have you evaluated whether your organization’s engagement with this trade association is aligned with the goals of the Paris Agreement? (column 7)
- Indicate whether your organization has evaluated the position of the trade association and its activities to influence climate change policy for alignment with the goals of the Paris Agreement.
- Any actions you took as a result of this evaluation should be detailed in columns 3 and 4.
- Alignment with the goals of the Paris Agreement: refers to the Paris Agreement long-term temperature goal, as expressed in relevant IPCC reports, in particular the IPCC Sixth Assessment Report (AR6) and the IPCC Special Report on Global Warming of 1.5°C (SR1.5).
- Engagement that is aligned with the Paris Agreement could include, for example:
- Influencing a trade association that supports climate denial to change its position or terminating your membership with this trade association.
- Publicly supporting a trade association which aims to influence ambitious climate policy.
Explanation of terms
- Trade associations: Trade associations (sometimes also referred to as industry associations, trade groups, trade bodies, or industry trade groups) are an association of people or companies in a particular business or trade, organized to promote their common interests. Trade associations are relevant here as they present an “industry voice” to governments to influence their policy development. The majority of organizations are members of multiple trade associations, many of which take a position on climate change and actively engage with policy makers on the development of policy and legislation on behalf of their members.
Additional information
Climate change position of trade associations
- To aid companies in sorting through the climate-related action of trade associations and determining where the groups in which they belong actually stand on climate change, InfluenceMap has launched a corporate climate lobbying platform which uses data-driven analysis to provide detailed measurement of how trade associations influence policy needed to address climate change.
(C12.3c) Provide details of the funding you provided to other organizations or individuals in the reporting year whose activities could influence policy, law, or regulation that may impact the climate.
Question dependencies
This question only appears if you select “Yes, we fund organizations or individuals whose activities could influence policy, law, or regulation that may impact the climate” in response to C12.3.
Change from last year
Minor change
Rationale
Companies have many potential avenues for engagement activities. Funding organizations other than trade associations can play an important role in the development and adoption of climate policy. As such, data users expect companies to be transparent about the full range of their funding activities which could influence policy, law, or regulation that may impact the climate.
Ambition: Companies’ funding of organizations or individuals, whose activities could influence policy, law, or regulation that may impact the climate, is aligned with the goals of the Paris Agreement.
Response options
Please complete the following table. You are able to add rows by using the “Add Row” button at the bottom of the table.
| Type of organization or individual
|
State the organization or individual to which you provided funding
|
Funding figure your organization provided to this organization or individual in the reporting year (currency as selected in C0.4)
|
Describe the aim of this funding and how it could influence policy, law or regulation that may impact the climate
|
Have you evaluated whether this funding is aligned with the goals of the Paris Agreement?
|
Select from:
- Governmental institution
- Independent consultant
- International Governmental Organization (IGO)
- Non-Governmental Organization (NGO) or charitable organization
- Political party or political candidate
- Political committee
- Private company
- Publicly-listed company
- Research organization
- Start-up company
- State-Owned Enterprise (SOE)/Government-Owned Corporation (GOC)
- Trust or foundation
- University or other educational institution
- Other, please specify
|
Text field [maximum 500 characters]
|
Numerical field [enter a number from 0 to 999,999,999,999,999 using up to 2 decimal places]
|
Text field [maximum 2,500 characters]
|
Select from:
- Yes, we have evaluated, and it is aligned
- Yes, we have evaluated, and it is not aligned
- No, we have not evaluated
|
[Add row]
Requested content
General
- You should also disclose in this question other, non-financial support you have provided to other organizations or individuals in the reporting year (e.g. benefits, etc.). In this case, you should estimate the monetary value of your non-financial support and provide this in column 3.
Type of organization or individual (column 1)
- If you fund multiple organizations or individuals whose activities may influence climate policy, you should add a row for each.
- See the “Explanation of Terms” for a definition of each organization/individual type.
State the organization or individual to which you provided funding (column 2)
- Provide the full name and a short description of the organization or individual to whom you are providing funding. If you have selected an organization, provide also the full name of the organization.
Funding figure your organization or individual provided to this organization in the reporting year (currency as selected in C0.4) (column 3)
- Enter the total amount of funding you have provided to this organization, including any membership or other fees.
Describe the aim of this funding and how it could influence policy, law or regulation that may impact the climate (column 4)
- Describe the type of funding or non-financial support (e.g. membership fees, sponsorship, grant, benefits, etc), and provide an overview of the objectives of your support, including any expected concrete outcomes (e.g. research papers or reports).
- Explain how the outcomes of your funding could influence policy, law or regulation that may impact the climate.
- If you have estimated the monetary value of any non-financial support, you should also explain how you estimated the figure reported in column 3.
Have you evaluated whether this funding is aligned with the goals of the Paris Agreement? (column 5)
- Indicate whether your organization has evaluated the aims and expected outcomes of your funding for alignment with the goals of the Paris Agreement.
- Alignment with the goals of the Paris Agreement: refers to the Paris Agreement long-term temperature goal, as expressed in relevant IPCC reports, in particular the IPCC Sixth Assessment Report (AR6) and the IPCC Special Report on Global Warming of 1.5°C (SR1.5).
- Funding that is aligned with the Paris Agreement could include, for example, funding a research project into new alternative fuels, the report from which may be used to inform future transport policy.
Explanation of terms
- Governmental institution: An organization that is connected to or led by a national government (e.g., the UK Committee on Climate Change).
- Independent consultant – An organization or individual contracted to perform work for one party with whom the party does not have direct affiliation.
- International Governmental Organization (IGO): An organization that is comprised of national governments. For the purposes of this question, IGOs can refer both to organizations created through treaties (e.g., the UN), and to more informal coalitions of national governments (e.g., the G20).
- Non-Governmental Organization (NGO) or charitable organization: Any non-profit, voluntary citizens’ group which is organized on a local, national or international level. A charitable organization is typically an NGO with a special legal status, varying by jurisdiction.
- Political party or political candidate: An organization or individual who participates in the electoral systems of countries/areas.
- Political committee – A group or organization engaging in political financing activity (e.g. 527 Groups, SuperPACs)
- Private company: A company which does not offer or trade company stock to the general public.
- Publicly-listed company: A company which offers and trades shares of stock freely.
- Research organization: An organization which performs research as their primary activity.
- Start-up company: A company in the very initial stages of business, often without a fully developed business model.
- State-Owned Enterprise (SOE)/Government-Owned Corporation (GOC): A company formed by governments in order to take part in commercial activities.
- Trust or foundation: An organization which has been given the right by one party to manage their property or assets for the benefit of some third party.
- University or other educational institution: An entity that provides instructional services to individuals or education-related services to individuals and other educational institutions.
Communications
(C12.4) Have you published information about your organization’s response to climate change and GHG emissions performance for this reporting year in places other than in your CDP response? If so, please attach the publication(s).
Change from last year
No change
Rationale
Best practice in corporate environmental reporting is to integrate non-financial metrics and data into mainstream financial reports. Investors want to understand where and how companies communicate their climate change strategies and emissions figures, and whether these communications are in line with best practice.
Connection to other frameworks
Goal 12: Responsible consumption and production
NZAM (FS Only)
Commitment 10
Response options
Please complete the following table. You are able to add rows by using the “Add Row” button at the bottom of the table.
| Publication
|
Status
|
Attach the document
|
Page/Section reference
|
Content elements
|
Comment
|
|
Select from:
- In mainstream reports
- In mainstream reports, in line with the CDSB framework (as amended to incorporate the TCFD recommendations)
- In mainstream reports, incorporating the TCFD recommendations
- In other regulatory filings
- In voluntary communications
- In voluntary sustainability report
- No publications with information about our response to climate-related issues and GHG emissions performance
- Other, please specify
|
Select from:
- Complete
- Underway – previous year attached
- Underway – this is our first year
|
Attach your document here.
|
Text field [maximum 500 characters]
|
Select all that apply:
- Governance
- Strategy
- Risks & Opportunities
- Emissions figures
- Emission targets
- Other metrics
- Other, please specify
|
Text field [maximum 2,400 characters]
|
[Add Row]
Requested content
General
- This question asks about communication of your position on climate change and carbon emissions outside of your CDP response.
- Privately held companies that do not have a legal obligation to produce annual reporting should still select “In mainstream reports” if they publish any annual sustainability reporting.
- Even where the relevant information is web-based, you must produce a static document to attach, due to the need to maintain a fixed response over time that can be accessed in full at any time in the future; a URL is inherently dynamic and therefore cannot fulfill this requirement.
Publication (column 1)
- Select from the drop-down options the type of publication your organization has published in response to climate change and its GHG emissions performance for the reporting year in places other than its CDP response.
- CDP uses the CDSB Framework definition of mainstream reports, i.e. annual reporting packages in which organizations are required to deliver their audited financial results under the corporate, compliance or securities laws of the country/area in which they operate and are normally publicly available. It is acknowledged that, in some jurisdictions, multiple documents may meet this definition. Please attach only those which reference your organization’s response to climate change and GHG emissions performance.
- Other regulatory filings are reports which are required through regional or national legislation, but which do not fall under the definition of mainstream reports stated above.
- Voluntary communications include optional sustainability/CSR reports or any other voluntary consumer facing publications, advertising, company websites, executive speeches and/or presentations.
- If you do not publish any content regarding your organization's response to climate change and GHG emissions performance, please select "No publications with information about our response to climate-related issues and GHG emissions performance".
- If you select “Other, please specify,” provide a label for the publication.
Status (column 2)
- Select from the drop-down options the status of the publication type selected in column 1.
- The report should relate to the reporting year although it is acknowledged that it may not be published in the reporting year.
- Where reports are not ready for publication at the time of submission of your CDP response, select one of the options that indicate the report is underway.
- Where you can attach the previous year’s report to demonstrate that the information is routinely published in this way, select “Underway – previous year attached” and complete columns “Page/Section reference” and “Content elements" with regard to this report.
- Where this is the first year that you will have published information in this way, select “Underway – this is our first year” and leave columns “Page/Section reference” and “Content elements" blank.
- Where the publication is already available, select “Complete.”
Page/Section reference (column 4)
- Identify the page(s) and section(s) of the report attached that refers to climate change and GHG emissions performance. If the whole document relates to climate change and GHG, please state this. If your document is only 1 page long, please still state this.
Content elements (column 5)
- Select all content elements that apply from the drop-down that relate to the publication type selected in column 1.
Explanation of terms
- Mainstream reports: in line with CDSB, this refers to the annual reporting packages in which organizations are required to deliver their audited financial results under the corporate, compliance or securities laws of the country/area in which they are incorporated or, if relevant, operate. Mainstream reports are traditionally publicly available. They provide information to existing and prospective investors about the financial position and financial performance of the organisation. The exact provisions under which companies are required to deliver mainstream financial reports differ internationally, but will generally contain financial statements and other financial reporting, including governance statements and management commentary.
Additional information
The Climate Disclosure Standards Board
About
- The Climate Disclosure Standards Board (CDSB) is a consortium of business and environmental organizations. CDSB is committed to advancing and aligning the global mainstream corporate reporting model to equate natural capital with financial capital.
- CDSB does this by offering companies a framework for reporting climate change and natural capital information with the same rigor as financial information. In turn this helps them to provide investors with decision-useful environmental information via the mainstream corporate report, enhancing the efficient allocation of capital. Regulators also benefit from compliance-ready materials.
- Recognising that information about natural capital and financial capital is equally essential for an understanding of corporate performance, CDSB’s work builds trust and transparency needed to foster resilient capital markets. Collectively, CDSB aims to contribute to more sustainable economic, social and environmental systems.
- CDSB’s Mission is to create the enabling conditions for material climate change and natural capital information to be integrated into mainstream reporting. In effect, this helps create the landscape for companies to translate their sustainability information into business impacts and long-term value.
- To fulfil its mission and vision, CDSB seeks to standardize environmental information reporting through collaborating, identifying and coalescing around the most widely shared and tested reporting approaches that are emerging around the world.
- CDSB advances its mission by:
- Helping companies interpret and better understand their data: CDSB will drive the corporate uptake in current – and future – initiatives such as the TCFD recommendations by providing technical and educational support to corporates and regulators;
- Creating a technical architecture: CDSB will develop and provide a common language and reporting frameworks and develop technical material supporting contentious issues or market needs, spearheaded by the CDSB Framework;
- Making connections: CDSB will engage with corporate, regulators, investors, standard-setters and non-profits to develop industry-driven reporting tools, practices and regulations, and shape regulatory developments.
- In April 2018 CDSB released an updated version of its Framework, the CDSB Framework for reporting environmental information, natural capital and associated business impacts, which is now aligned with the TCFD recommendations and other major reporting requirements. Further information on the CDSB Framework can be found on its website.
Why does CDP support the CDSB Framework?
- CDP works to transform the way the world does business to prevent dangerous climate change and protect our natural resources, particularly by providing relevant environmental information to investors. Given that an essential way that investors utilize data is through mainstream financial reports, it is integral to CDP’s mission that companies use the CDSB Framework to provide natural capital information to investors through their mainstream financial report.
- Therefore, the CDSB Framework provides an important tool for formalizing and advancing the significant progress CDP has made in developing climate change-related and natural capital reporting by bringing it into mainstream financial reporting.
- CDP acts as secretariat to CDSB, managing its work program on behalf of the Board members.
Integrated reporting
- The primary purpose of an integrated report is to explain to providers of financial capital how an organization creates value over the short, medium and long term. An integrated report aims to communicate a clear, concise, integrated story that explains how all of an organization’s resources are creating value.
- The International <IR> Framework takes a principles-based approach. The intent is to strike an appropriate balance between flexibility and prescription that recognizes the wide variation in individual circumstances of different organizations while enabling a sufficient degree of comparability across organizations to meet relevant information needs. It does not prescribe specific key performance indicators, measurement methods, or the disclosure of individual matters, but it does include a small number of requirements that are to be applied before an integrated report can be said to be in accordance with the Framework.
The Task Force on Climate-related Financial Disclosures (TCFD)
About
- Launched in December 2015, the Financial Stability Board’s (FSB) industry-led Task Force on Climate-related Financial Disclosure (TCFD) aims to develop voluntary and consistent climate-related financial risk disclosures for use by companies in providing information to investors, lenders, insurers, and other stakeholders.
The TCFD strives to:
- Promote more informed investment, credit (or lending), and insurance underwriting decisions;
- Enable stakeholders to better understand the concentrations of carbon-related assets in the financial sector and the financial system’s exposures to climate-related risks;
- Foster an early assessment of these risks, and facilitate market discipline;
- Thus providing a source of data that can be analyzed at a systemic level to facilitate authorities’ assessments of the materiality of any risks posed by climate change.
TCFD’s mission
- The TCFD was tasked with developing a set of voluntary, financially relevant, climate disclosure recommendations that could promote informed investment, credit, and insurance underwriting decisions that could in turn enable stakeholders to better understand assets exposed to climate-related risks.
- Its aim is to enable stakeholders to allocate capital efficiently through the transition to a low-carbon economy without a potential dislocation of capital in the financial markets.
- The TCFD’s final report presents a principle-based set of recommendations for voluntary disclosure that aims to balance the needs of data users with the challenges faced by preparers. The report provides the overarching core recommendations with supporting information on climate-related risks, opportunities, financial impacts, and scenario analysis.
- Further information on TCFD can be found in CDP's technical note on the TCFD's recommendations.
Industry collaboration
(C12.5) Indicate the collaborative frameworks, initiatives and/or commitments related to environmental issues for which you are a signatory/member.
Change from last year
New question for all sectors except FS
Rationale
By becoming a signatory of environmental collaborative industry initiatives, companies contribute to the development of environmental disclosure frameworks, metrics and commitments that will help meet the goals of the Paris agreement. Supporting environmental industry initiatives sends a signal to investors about the company’s commitment to taking steps to align its business to a 1.5°C world.
Ambition: Companies sign up to transition-related collaborative initiatives to signal to investors their commitment to aligning with a 1.5°C world.
Connection to other frameworks
NZAM (FS only)
General commitment
Response options
Please complete the following table.
(*column/row appearance is dependent on selections in this or other questions)
| Environmental collaborative framework, initiative and/or commitment
|
Describe your organization’s role within each framework, initiative and/or commitment*
|
Select all that apply:
[dropdown list below]
|
Text field [maximum 5,000 characters]
|
Environmental collaborative framework, initiative and/or commitment options (column 1)
- We are not a signatory/member of any collaborative framework, initiative and/or commitment related to environmental issues
- Alliance for Climate Action (ACA)
- Alliance for Water Stewardship (AWS) [FS Only]
- Asia Investor Group on Climate Change (AIGCC)
- Asia Sustainable Finance Initiative (ASFI) [FS Only]
- Banking Environment Initiative [FS Only]
- Business Ambition for 1.5C
- Business Declares
- CDP Signatory [FS only]
- CBN Expert SME Community
- Ceres Valuing Water Initiative [FS only]
- Cerrado Manifesto [FS only]
- CEO Water Mandate [FS only]
- Certified B Corporation
- Chambers Climate Coalition
- Climate Action 100+
- Climate Bonds Initiative Partner Programme [FS only]
- Climate Disclosure Standards Board (CDSB)
- ClimateWise Principles
- Collective Commitment of Climate Action
- European Climate Pact
- Equator Principles [FS only]
- Exponential Roadmap Initiative
- Fashion Charter for Climate Action
- Forest Stewardship Council (FSC) [FS only]
- Future Net Zero with CBN
- G7 Investors Global Initiative [FS only]
- Glasgow Financial Alliance for Net Zero (GFANZ) [FS only]
- Global Alliance for Banking on Values (GABV) [FS only]
- Global e-Sustainability Initiative
- Global Reporting Initiative (GRI) Community Member
- Global Roundtable for Sustainable Beef (GRSB) [FS only]
- Health Care Without Harm
- IIF Forum on Implementation of TCFD Recommendations
- Institutional Investors Group on Climate Change (IIGCC) [FS only]
|
- International Corporate Governance Network (ICGN)
- International Sustainability & Carbon Certification (ISCC)
- International Wineries for Climate Action
- Investor Group on Climate Change (IGCC) [FS only]
- Investor Network on Climate Risk (INCR) [FS only]
- Japan Climate Leaders’ Partnership (JCLP)
- Mission Possible Partnership
- Montreal Pledge [FS only]
- Natural Capital Finance Alliance [FS only]
- Net Zero Banking Alliance [FS only]
- Net Zero Insurance Alliance [FS only]
- Net Zero Asset Managers initiative [FS only]
- Net Zero Asset Owner Alliance [FS only]
- Net Zero Financial Service Providers Alliance [FS only]
- Net Zero Investment Consultants Initiative [FS only]
- New York Declaration on Forests [FS only]
- Paris Agreement Capital Transition Assessment (PACTA) [FS only]
- Paris Aligned Investment Initiative [FS only]
- Partnership for Biodiversity Accounting Financials (PBAF) [FS only]
- Partnership for Carbon Accounting Financials (PCAF) [FS only]
- Planet Mark
- Pledge to Net Zero
- PRI Investor Working Group on Sustainable Palm Oil [FS only]
- Principle for Responsible Investment (PRI) [FS only]
- Programme for the Endorsement of Forest Certification (PEFC) [FS only]
- Positive Impact Initiative
- RE100
- Race to Zero Campaign
- Roundtable on Responsible Soy (RTRS) [FS only]
- Roundtable on Sustainable Palm Oil (RSPO) [FS only]
|
- Science Based Targets Network (SBTN)
- Science-Based Targets Initiative for Financial Institutions (SBTi-FI) [FS only]
- SME Climate Hub
- Soft Commodities Compact [FS only]
- Sports for Climate Action
- Sustainable Agriculture Initiative (SAI)
- Task Force on Climate-related Financial Disclosures (TCFD)
- Task Force on Nature-related Financial Disclosures (TNFD)
- The B Team
- The Climate Pledge
- The Investor Agenda [FS only]
- Transition Pathway Initiative
- The Water Council [FS only]
- Tropical Forest Alliance 2020 [FS only]
- UN Global Compact
- UNEP FI [FS only]
- UNEP FI Portfolio Decarbonization Coalition
- UNEP FI Principles for Responsible Banking [FS only]
- UNEP FI Principles for Sustainable Insurance [FS only]
- UNEP FI TCFD Pilot [FS only]
- We Are Still In
- We Mean Business
- World Business Council for Sustainable Development (WBCSD)
- Other, please specify
|
Requested content
General
- This question asks about your involvement and role in wider environmental collaborative industry initiatives.
- The option “We are not a signatory/member of any collaborative framework, initiative and/or commitment related to environmental issues” should only be selected on its own.
Environmental collaborative framework, initiative and/or commitment (column 1)
- If you select ‘Race to Zero Campaign’, you must also select the individual partner initiatives under the Race to Zero umbrella you are affiliated with.
Describe your organization’s role within each framework, initiative and/or commitment (column 2)
- This column appears if any option other than “We are not a signatory/member of any collaborative framework, initiative and/or commitment related to environmental issues” is selected in column 1.
C13 Other land management impacts
Module Overview
This module provides the opportunity for disclosing on impacts - other than climate-related - of land management practices implemented in owned land and/or by suppliers
Key changes
Click here for a list of all changes made this year.
Pathway diagram - questions
This diagram shows the questions contained in module C13. To access question-level guidance, use the menu on the left to navigate to the question.
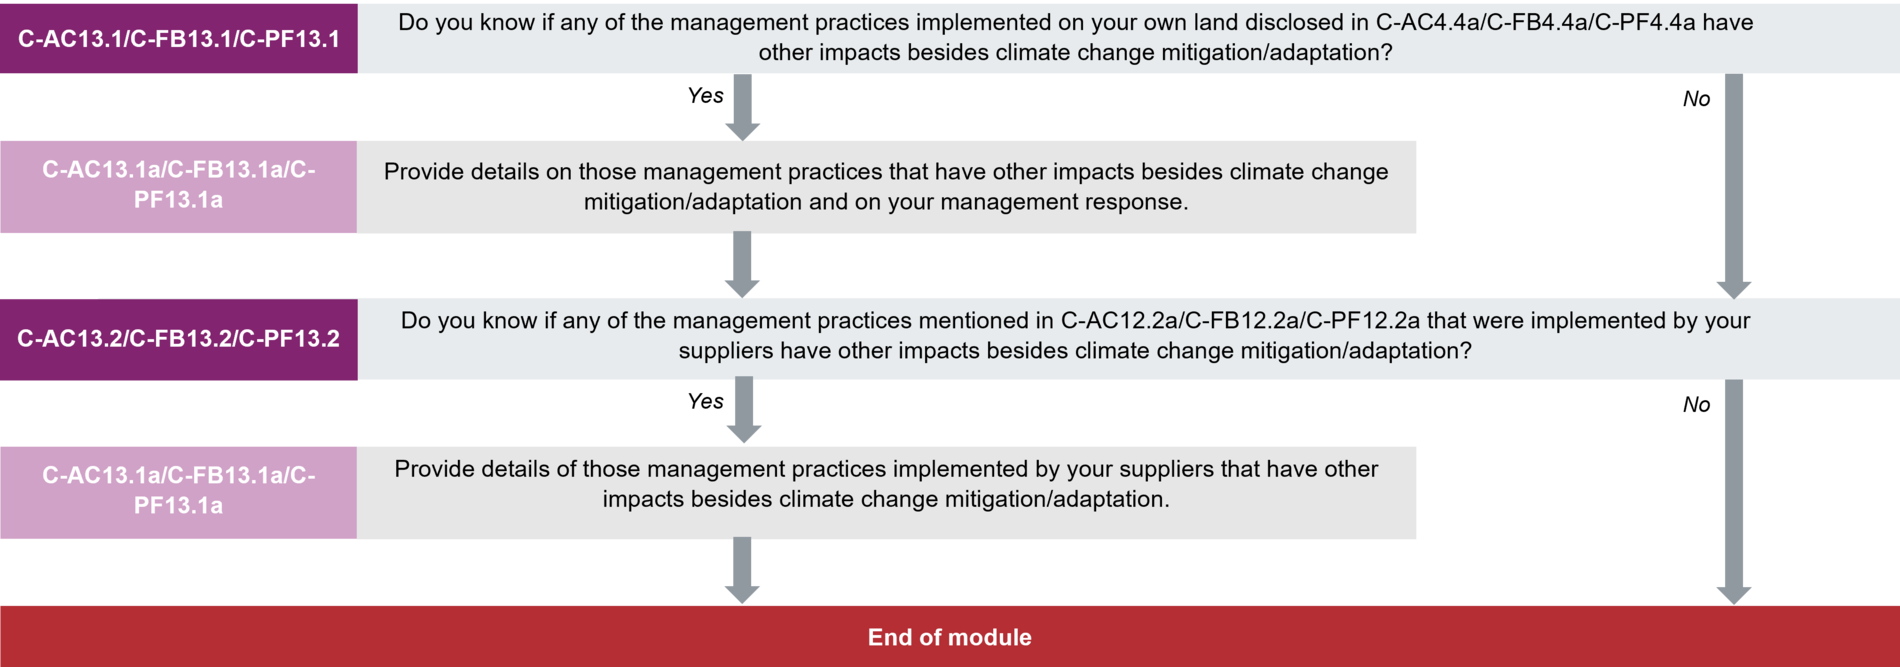
(C-AC13.1/
C-FB13.1/C-PF13.1) Do you know if any of the
management practices implemented on your own land disclosed in C-AC4.4a/C-FB4.4a/C-PF4.4a have other impacts besides climate change
mitigation/adaptation?
Question dependencies
This question only appears if you select "Yes" in response to C-AC4.4/C-FB4.4/C-PF4.4.
Change from last year
No change
Rationale
Organizations are encouraged to move towards a more holistic approach regarding their land management actions. This is important due to the complex interrelationships between climate change, deforestation, and water security issues. An understanding of the implications of your management practices on other environmental aspects demonstrates a mature environmental stewardship approach to investors and other data users.
Response options
Select one of the following options:
Requested content
General
- This question refers to any impacts, other than climate benefits, that may be occurring due to your implementation of any of the agricultural/forestry management practices detailed in C-AC4.4a/C-FB4.4a/C-PF4.4a. For example, these impacts might refer to negative or positive effects on biodiversity, soil and water quality, or crop yield.
- You should select "Yes" if you have measured the effects of at least one management practice indicated in C-AC4.4a/C-FB4.4a/C-PF4.4a on environmental aspects beyond climate. You will be able to provide details on these effects in the following question.
- Note that the effects you report should be a result of an evaluation carried out by your organization after the implementation of the practice. Select "No" if you have not carried out an evaluation of the effects of any specific management practice.
(C-AC13.1a/
C-FB13.1a / C-PF13.1a) Provide details on those management practices that have other
impacts besides climate change mitigation/adaptation and on your management
response.
Question dependencies
This question only appears if you select "Yes" in response to C-AC13.1/ C-FB13.1/C-PF13.1.
Change from last year
No change
Rationale
This question gathers data on impacts - other climate-related - of management practices implemented in your land. Organizations are encouraged to move towards a more holistic approach regarding their land management actions. This is important due to the complex interrelationships between climate change, deforestation, and water security issues. An understanding of the implications of your management practices on other environmental aspects demonstrates a mature environmental stewardship approach to investors and other data users.
Response options
Please complete the following table. You are able to add rows by using the “Add Row” button at the bottom of the table.
| Management practice reference number
|
Overall effect
|
Which of the following has been impacted?
|
Description of impact
|
Have you implemented any response(s) to these impacts?
|
Description of the response(s)
|
|
Select from:
- MP1
- MP2
- MP3
- MP4
- MP5
- MP6
- MP7
- MP8
- MP9
- MP10
- MP11
- MP12
- MP13
- MP14
- MP15
- MP16
- MP17
- MP18
- MP19
- MP20
|
Select all that apply:
- Positive
- Negative
- Neutral
- Mixed
|
Select all that apply:
- Biodiversity
- Soil
- Water
- Yield
- Other, please specify
|
Text field [maximum
2,400 characters]
|
Select from:
|
Text field [maximum
2,400 characters]
|
[Add Row]
Requested content
General
- Identify and explain any impacts that occurred because of any agricultural/forestry management practice implemented in your own land, as reported in C-AC4.4a/C-FB4.4a/C-PF4.4a. You should not report effects that are climate-related, as these are already captured earlier in your disclosure. Provide effects associated with other environmental issues, e.g. on biodiversity, soils, water.
Management practice reference number (column 1)
- When referring to a specific management practice or action, please make sure you select the same identifier for this management practice as in C-AC4.4a/C-FB4.4a/C-PF4.4a. For example, if you would like to disclose other effects of "agroforestry" which you already disclosed in terms of climate-related effects, you should select in this column the same identifier that refers to this practice in C-AC4.4a/C-FB4.4a/C-PF4.4a
Overall effect (column 2)
- This refers to the overall effect of your management practice on other environmental issues. Select all that apply.
Which of the following has been impacted? (column 3)
- Indicate which environmental issues have been affected by your management practice. Select all options that apply
- If none of the reasons are applicable to your organization, select "Other, please specify" and indicate the additional area(s) that have been impacted by your management practices.
Description of impact (column 4)
- Provide a brief description of the methods/tools used to assess the consequences of the implementation of your management practice on other environmental issues
- Provide details on each of these impacts/effects, including:
- their nature
- the parts of your business that have been affected.
Description of the response(s) (column 6)
- If applicable, describe your response to manage, mitigate, control, or adapt to these impacts/effects.
- If you selected "No" in column 5 "Have you implemented…?", explain why you have not implemented a response to these impacts.
Example response
| Management practice reference
number | Overall effect | Which of the following has been impacted? | Description of impact | Have you implemented any response(s) to these impacts? | Description of the response(s) |
|---|
| MP1 | Positive | Soil; Yield | We adopted cover-cropping practices in 85% of our farms a year ago. It
has already had positive impacts in the soil quality, such as reduced soil
erosion, increased levels of soil organic matter, improved moisture retention. Also, the crop yield has increased by 15% compared to last year. | No | We have not implemented any response as we did
not identify any negative impacts caused by this management practice. |
(C-AC13.2/
C-FB13.2 / C-PF13.2) Do you know if any of the
management practices mentioned in C-AC12.2a/C-FB12.2a/C-PF12.2a that were implemented by your suppliers have other impacts
besides climate change mitigation/adaptation?
Question dependencies
This question only appears if you select "Yes" in response to C-AC12.2/C-FB12.2/C-PF12.2.
Change from last year
No change
Rationale
Organizations are encouraged to adopt, as well as to promote among their suppliers, a holistic approach regarding land management actions. This is important due to the complex interrelationships between climate change, deforestation, and water security issues. Knowledge of the implications of management practices adopted across the whole value chain that impacts other environmental aspects demonstrates a mature environmental stewardship approach to investors and other data users.
Response options
Select one of the following options:
Requested content
General
- This question refers to any impacts, other than climate-related benefits, that may be occurring due to your implementation of agricultural/forestry management practices detailed in C-AC12.2a/C-FB12.2a/C-PF12.2a. For example, these impacts might refer to negative or positive effects on biodiversity, soil and water quality, or crop yield.
- You should select "Yes" if you have collected data on your supplier’s assessment of at least one management practice indicated in C-AC12.2a/C-FB12.2a/C-PF12.2a that have impacted environmental aspects beyond climate. You will be able to provide details on these effects in the following question.
- Note that the effects you report should be a result of an evaluation carried out by your supplier(s) after the implementation of the practice. Select "No" if your supplier(s) have not carried out an evaluation of the effects of any specific management practice.
(C-AC13.2a/ C-FB13.2a / C-PF13.2a) Provide
details of those management practices implemented by your suppliers that have
other impacts besides
climate change mitigation/adaptation.
Question dependencies
This question only appears if you select "Yes" in response to C-AC13.2/ C-FB13.2 / C-PF13.2.
Change from last year
No change
Rationale
This question gathers data on impacts - other climate-related - of management practices implemented by your suppliers. Organizations are encouraged to move towards a more holistic approach regarding their land management actions. This is important due to the complex interrelationships between climate change, deforestation, and water security issues. An understanding of the implications of management practices on other environmental aspects demonstrates a mature environmental stewardship approach to investors and other data users.
Response options
Please complete the following table. You are able to add rows by using the “Add Row” button at the bottom of the table.
| Management practice reference number
|
Overall effect
|
Which of the following has been impacted?
|
Description of impacts
|
Have any response to these impacts been implemented?
|
Description of the response (s)
|
|
Select from:
- MP1
- MP2
- MP3
- MP4
- MP5
- MP6
- MP7
- MP8
- MP9
- MP10
- MP11
- MP12
- MP13
- MP14
- MP15
- MP16
- MP17
- MP18
- MP19
- MP20
|
Select all that apply:
- Positive
- Negative
- Neutral
- Mixed
|
Select all that apply:
- Biodiversity
- Soil
- Water
- Yield
- Other, please specify
|
Text field [maximum
2,400 characters]
|
Select from:
|
Text field [maximum
2,400 characters]
|
[Add Row]
Requested content
General
- Identify and explain any impacts that occurred because of any agricultural/forestry management practice implemented by your suppliers and encouraged by you, as reported in C-AC12.2a/C-FB12.2a/C-PF12.2a. You should not report effects that are climate-related as these are already captured earlier in your disclosure. Provide effects associated with other environmental issues, e.g. biodiversity, soils, water in this question.
Management practice reference number (column 1)
- When referring to a specific management practice or action, please make sure you select the same identifier for this management practice as in C-AC12.2a/C-FB12.2a/C-PF12.2a. For example, if you would like to disclose other effects of "agroforestry" which you already disclosed in terms of climate-related effects, you should select in this column the same identifier that refers to this practice in C-AC12.2a/C-FB12.2a/C-PF12.2a.
Overall effect (column 2)
- This refers to the overall effect of the management practice on other environmental issues. Select all options that apply.
Which of the following has been impacted? (column 3)
- Indicate which environmental issues have been affected by the management practice. Select all options that apply.
- If none of the reasons are applicable to your organization, select "Other, please specify" and indicate the additional issue that has been impacted by the implementation of your encouraged management practices.
Description of impacts (column 4)
- Specify the percentage of your total suppliers from which you collected data on the other effects of management practices encouraged by you.
- If known, provide a brief description of the methods/tools your suppliers used to assess the consequences of the implementation of the management practice on other environmental issues.
- Provide details on each of these impacts/effects, including:
- their nature
- the parts of your supply chain been affected.
Description of the response(s) (column 6)
- If applicable, describe your supplier’s response to manage, mitigate, control or adapt to these other impacts/effects.
- If you selected "No" in column 5 "‘Have any response…?", explain why your suppliers have not implement a response to these impacts.
C14 Module Dependencies
Module C14 only applies to organizations with activities in the Financial Services sector.
C15 Biodiversity
Module Overview
Disclosure on actions to preserve or improve biodiversity will help organizations to evaluate the relevancy and efficacy of their commitments and consider the biodiversity-related risks and impacts of their business practices.
The data will help with the understanding of the interdependence between biodiversity and business resilience. Demand is increasing for biodiversity-related data that will enable financial institutions to develop investment strategies, and to engage effectively with companies to address the loss of forests and biodiversity that is exposing them to risk throughout their value chains.
This module takes a staged, circular approach, aligned with the International Union for the Conservation of Nature (IUCN’s) guidelines for the planning and monitoring biodiversity performance by companies:
- Develop a set of linked corporate level biodiversity performance indicators
- Implement systems to use the indicators and the data they produce
- Evaluate progress with a periodic review of priorities, ambitions and indicators.
In addition, companies will report on their approach to the governance of biodiversity–related issues.
The questions in this module were influenced by the 4 stage structure as outlined in the IUCN: Guidelines for planning and monitoring corporate biodiversity performance.
Key changes
- New questions:
- C15.4 asks whether your organization has activities in or near biodiversity sensitive areas.
- C15.4a requests details of activities in or near biodiversity sensitive areas.
- Modified question:
- C15.3 – question updated to also address dependencies on biodiversity, the value chain stages covered by assessments, and the tools and methods used.
Click here for a list of all changes made this year.
Pathway diagram - questions
This diagram shows the general questions contained in module C15. To access question-level guidance, use the menu on the left to navigate to the question.
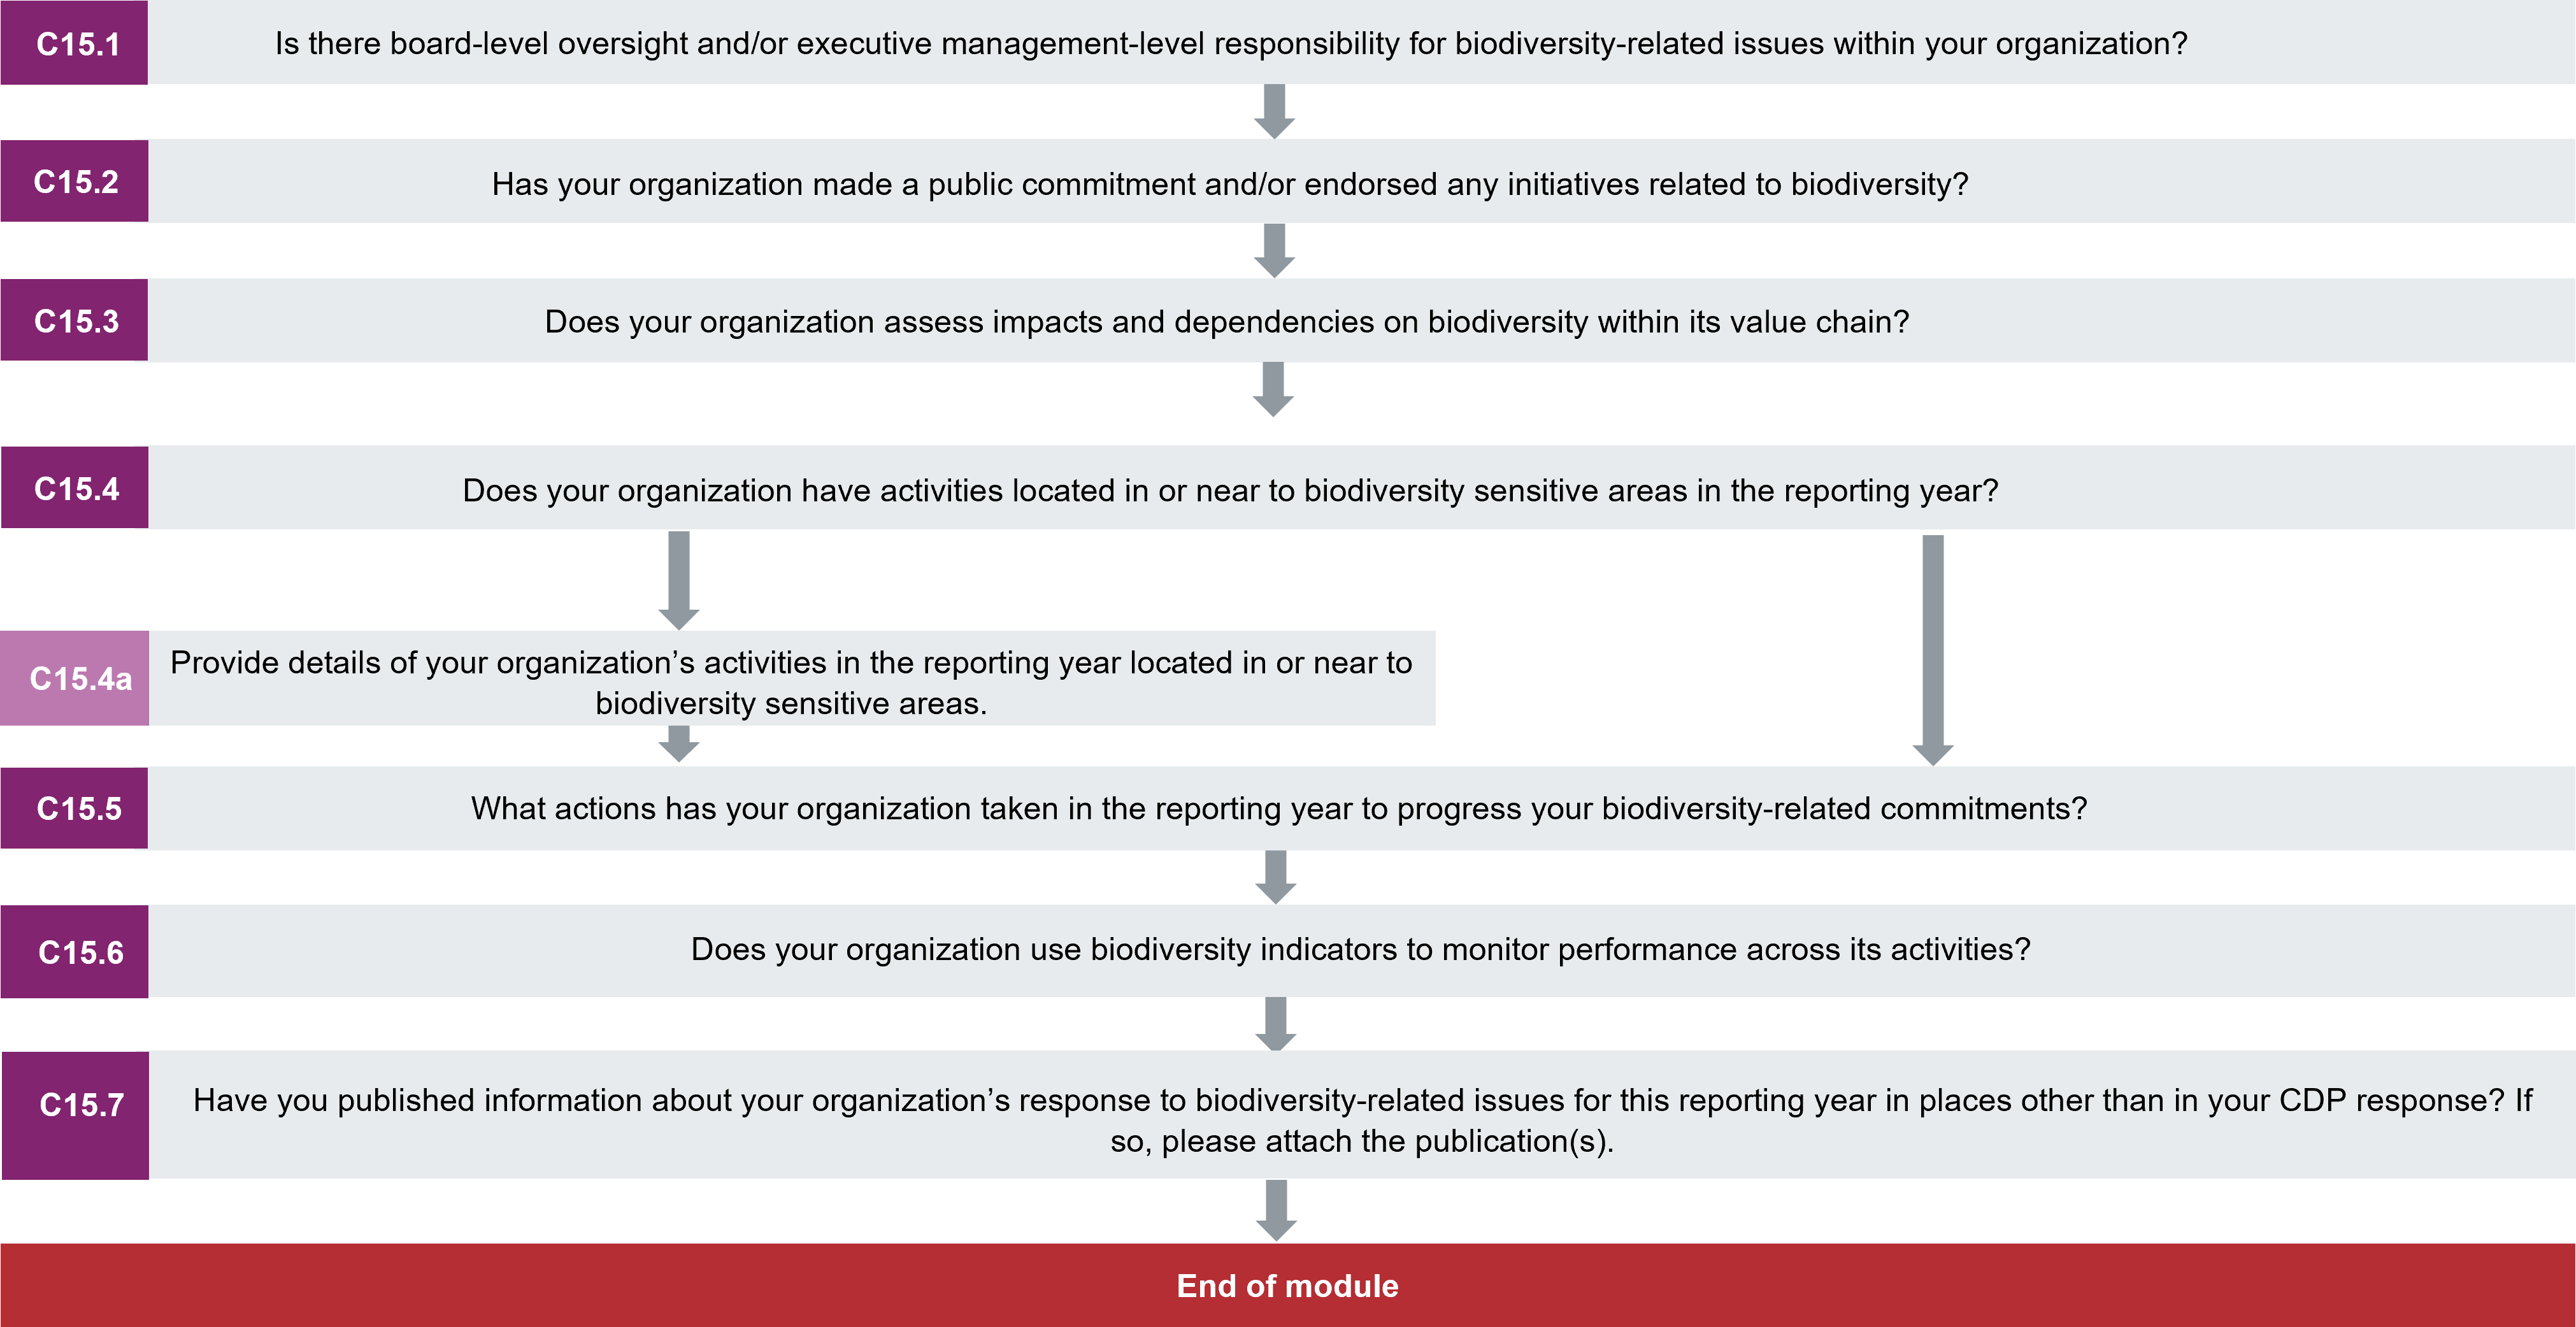
Biodiversity
(C15.1) Is there board-level oversight and/or executive management-level responsibility for biodiversity-related matters within your organization?
Change from last year
No change
Rationale
This question indicates to investors and other data users the level of commitment and strategic importance organizations give to addressing biodiversity-related issues.
Connection to other frameworks
SDG
Goal 15: Life on land
Response options
Please complete the following table:
(*column/row appearance is dependent on selections in this or other questions)
| Board-level oversight and/or executive management-level responsibility for biodiversity-related issues
|
Description of oversight and objectives relating to biodiversity*
|
Scope of board-level oversight [FS Only]*
|
Select from:
- Yes, both board-level oversight and executive management-level responsibility
- Yes, board-level oversight
- Yes, executive management-level responsibility
- No, but we plan to have both within the next two years
- No, and we do not plan to have both within the next two years
|
Text field [maximum 2,500 characters]
|
Select all that apply:
- Risks and opportunities to our own operations
- Risks and opportunities to our bank lending activities
- Risks and opportunities to our investment activities
- Risks and opportunities to our insurance underwriting activities
- The impact of our own operations on biodiversity
- The impact of our bank lending activities on biodiversity
- The impact of our investing activities on biodiversity
- The impact of our insurance underwriting activities on biodiversity
|
Requested content
General
- Consider whether the board, board committees and/or executive management consider biodiversity-related issues when reviewing and guiding the business strategy, major plans of action, risk management policies, annual budgets, and future financial planning, or when setting the organization’s performance objectives, monitoring implementation and performance, and overseeing major capital expenditures, acquisitions, and divestitures.
Description of board level oversight and objectives (column 2)
- This column is presented only if “Yes” is selected in column 1 (Board-level oversight…)
- Describe how your organization addresses biodiversity at the board/ executive management level. This can include targets and responsibilities related to biodiversity. This is an opportunity to demonstrate thinking beyond climate change at the board level.
- Provide a description of the position(s)/committee(s) in the corporate structure and the level of responsibility they have towards biodiversity-related issues; and
- Explain how the responsibilities of the position(s)/committee(s) are related to biodiversity.
- Note that this column asks about the position and not about the names of the staff holding these positions. Do not include the name of any individual or any other personal data in your response.
- You can use this field to enter any relevant information.
Scope of board-level oversight [FS only]
- This column is presented only if “Yes” is selected in column 1 (Board-level oversight…)
- Select the aspects of your activity for which the board oversees biodiversity-related issues.
Explanation of terms
- Board: Or “Board of Directors” refers to a body of elected or appointed members who jointly oversee the activities of a company or organization. Some countries/areas use a two-tiered system where “board” refers to the “supervisory board” while “key executives” refers to the “management board" (TCFD, 2017).
(C15.2) Has your organization made a public commitment and/or endorsed any initiatives related to biodiversity?
Change from last year
No change
Rationale
An organization that commits publicly to implementing a biodiversity policy sends investors and other data users a strong signal that it wishes to be held to account for its biodiversity stewardship. Organizations disclosing this information can benchmark their commitments against their peers and so drive change within their industries.
Connection to other frameworks
SDG
Goal 12: Responsible consumption and production
Goal 13: Climate Action
Goal 15: Life on land
Response options
Please complete the following table:
(*column/row appearance is dependent on selections in this or other questions)
| Indicate whether your organization made a public commitment or endorsed any initiatives related to biodiversity | Biodiversity-related public commitments* | Initiatives endorsed* |
|---|
Select from:- Yes, we have made public commitments and publicly endorsed initiatives related to biodiversity
- Yes, we have made public commitments only
- Yes, we have endorsed initiatives only
- No, but we plan to do so within the next 2 years
- No, and we do not plan to do so within the next 2 years
| Select all that apply:- Commitment to Net Positive Gain
- Commitment to No Net Loss
- Adoption of the mitigation hierarchy approach
- Commitment to not explore or develop in legally designated protected areas
- Commitment to respect legally designated protected areas
- Commitment to avoidance of negative impacts on threatened and protected species
- Commitment to no conversion of High Conservation Value areas
- Commitment to secure Free, Prior and Informed Consent (FPIC) of Indigenous Peoples
- Commitment to no trade of CITES listed species
- Other, please specify
| Select all that apply:- CBD - Global Biodiversity Framework
- SDG
- CITES
- F4B - Finance for Biodiversity
- PBAF - Partnership for Biodiversity Accounting Financials [FS only]
- Other, please specify
|
Requested content
General
- A commitment is public when it is accessible to stakeholders (e.g., available on the organization’s website or on any other unrestricted site).
- Select a ‘Yes’ option if your organization has made any public commitment related to biodiversity.
- Do not select a ‘Yes’ option if your commitments are internal or private only.
Biodiversity-related public commitments (column 2)
- This column is presented only if either “Yes, we have made public commitments and publicly endorsed initiatives related to biodiversity” or “Yes, we have made public commitments only” is selected in column 1 (Indicate whether…).
Initiatives endorsed (column 3)
- This column is presented only if either “Yes, we have made public commitments and publicly endorsed initiatives related to biodiversity” or “Yes, we endorse initiatives only” is selected in column 1 (Indicate whether…).
- This list includes examples of leading global initiatives that promote adoption of corporate commitments related to biodiversity.
- Only select CBD – Global Biodiversity Framework if your organization has signed up to the commits and associated actions.
- Only select F4B if you are listed on the initiative's website as a pledge signatory.
- Only select PBAF if you are listed on the initiative’s website as a partner or supporter.
- If you select ‘Other, please specify’, provide a label for the initiative. Initiatives reported here should be voluntary and relate clearly to public biodiversity commitments.
Explanation of terms
- CITES species: species listed in any of the annexes of the Convention on International Trade in Endangered Species of Wild Fauna and Flora (CITES).
- Free, Prior and Informed Consent (FPIC): a community right to give or withhold its consent to proposed projects that may affect the lands they customarily own, occupy or otherwise use, as recognized by several international instruments including the UN Declaration on the Rights of Indigenous Peoples (UNDRIP), International Labour Organization’s Convention 169, and Convention on Biological Diversity (CBD).
- Internationally recognized areas: UNESCO Natural World Heritage Sites, UNESCO Man and the Biosphere Reserves, Key Biodiversity Areas, and wetlands designated under the Convention on Wetlands of International Importance (the Ramsar Convention) (IFC, 2012).
- Protected area: a protected area is a clearly defined geographical space, recognised, dedicated and managed, through legal or other effective means, to achieve the long-term conservation of nature with associated ecosystem services and cultural values (IUCN, 2008). For the purposes of this CDP disclosure, only legally designated areas (i.e., designated by governments) are expected to be disclosed.
- Net Positive Impact: The point at which project-related impacts on biodiversity and ecosystem services are outweighed by measures taken according to the mitigation hierarchy, so that a net gain results. May also be referred to as net gain (CSBI, 2015).
- No Net Loss: The point at which project-related impacts are balanced by measures taken through application of the mitigation hierarchy, so that no loss remains (CSBI, 2015).
- Threatened and protected habitats: All habitats considered threatened or otherwise protected by national or subnational laws and regulation, as well as international multilateral agreements, including protected areas, World Natural Heritage Sites, Natura 2000 sites and other similar areas.
Additional information
- CBD - Global Biodiversity Framework: the post-2020 global biodiversity framework builds on the Strategic Plan for Biodiversity 2011-2020 and sets out an ambitious plan to implement broad-based action to bring about a transformation in society’s relationship with biodiversity and to ensure that, by 2050, the shared vision of living in harmony with nature is fulfilled. The framework aims to galvanize urgent and transformative action by governments and all of society, including indigenous peoples and local communities, civil society and businesses, to achieve the outcomes it sets out in its vision, mission, goals and targets, and thereby contribute to the objectives of the Convention on Biological Diversity and other biodiversity related multilateral agreements, processes and instruments.
- Sustainable Development Goals (SDGs): the UN Sustainable Development Goals (SDGs) are a set of 17 goals for 2030 that look to balance the three dimensions of sustainable development: the economic, social and environmental (Sustainable Development Knowledge Platform, 2015).
- F4B Pledge - Finance for biodiversity pledge: signatories call on global leaders and commit to protecting and restoring biodiversity through their finance activities and investments.
- The Partnership for Biodiversity Accounting Financials (PBAF) is a partnership of financial institutions that work
together to explore the opportunities and challenges surrounding the assessment
and disclosure of the impact on biodiversity associated with their loans and
investments.
- CITES (the Convention on International Trade in Endangered Species of Wild Fauna and Flora) is an international agreement between governments. Its aim is to ensure that international trade in specimens of wild animals and plants does not threaten the survival of the species.
(C15.3) Does your organization assess the impacts and dependencies of its value chain on biodiversity?
Change from last year
Modified question
Rationale
An organization’s assessment of its impacts and dependencies on biodiversity facilitates and sets its approach to monitoring and addressing biodiversity issues. It identifies not only the activities and operations that could impact and/or are dependent on biodiversity, but also generates specific information on the species, habitats and ecosystem services affected. Your response to this question aligns with requirements of “Stage 1: Priorities” in IUCN’s Guidelines for planning and monitoring corporate biodiversity performance, which recommends that companies understand their impacts and dependencies on biodiversity.
Ambition: Companies asses the impacts and dependencies of their value chain on biodiversity using recognized methods.
Connection to other frameworks
SDG
Goal 12: Responsible consumption and production
Goal 15: Life on Land
Response options
Please complete the following table:
(*column/row appearance is dependent on selections in this or other questions)
0
|
1
|
2
|
3
|
4
|
5
|
| Type of assessment
|
Indicate whether your organization undertakes this type of assessment
|
Value chain stage(s) covered*
|
Portfolio activity [FS only]*
|
Tools and methods to assess impacts and/or dependencies on biodiversity*
|
Please explain how the tools and methods are implemented and provide an indication of the associated outcome(s)*
|
| Impacts on biodiversity
|
Select from:
- Yes
- No, but we plan to within the next two years
- No and we don’t plan to within the next two years
|
Select all that apply:
- Direct operations
- Upstream
- Downstream [not shown to FS]
- Portfolio activity [FS only]
|
Select all that apply:
- Bank lending portfolio (Bank)
- Investing portfolio (Asset manager)
- Investing portfolio (Asset owner)
- Insurance underwriting portfolio (Insurance company)
|
Select all that apply from drop-down options below
|
Text field [maximum 2,500 characters]
|
| Dependencies on biodiversity
|
|
|
|
|
|
Tools and methods to assess impacts and/or dependencies on biodiversity (column 4)
- BFC – Biodiversity Footprint Calculator
- BFM – Biodiversity Footprint Methodology
- BIM – Biodiversity Impact Metric
- Biodiversity indicators for site-based impacts
- Biological Diversity Protocol
- Bioscope
- BISI – Biodiversity Indicators for Site-based impacts
- BNGC – Biodiversity Net Gain Calculator
- CBD – Global Biodiversity Framework
- CBF – Corporate Biodiversity Footprint
- CISL Biodiversity Impact Metric
- ENCORE tool
- F4B - Finance for Biodiversity [FS only]
|
- GBS – Global Biodiversity Score
- IBAT – Integrated Biodiversity Assessment Tool
- LafargeHolcim
- LIFE Key
- Natural Capital Protocol
- PBAF – Partnership for Biodiversity Accounting Financials [FS only]
- PBF – Product Biodiversity Footprint
- ReCiPe
- SBTN materiality tool
- STAR – Species Threat Abatement and Restoration metric
- TNFD – Taskforce on Nature-related Financial Disclosures
- WBCSD Corporate Ecosystem Services Review
- No biodiversity assessment tools/methods used
- Other, please specify
|
Requested content
General
- When responding to this question organizations should consider how they assess whether their actions cause impacts and/or are dependent on biodiversity.
Value chain stage(s) covered (column 2)
- This column is presented only if “Yes” is selected in column 1 (Indicate whether your organization…).
- Select all the stages of your value chain that are covered by your assessment.
Tools and methods to assess impacts and/or dependencies on biodiversity (column 4)
- This column is presented only if “Yes” is selected in column 1 (Indicate whether your organization…).
- Select all the tools and/or methods used to assess your impacts (row 1) or dependencies (row 2) on biodiversity.
- If any biodiversity-specific tools and/or methods that you use are not listed, select “Other, please specify” and provide a label for the tool(s)/method(s).
- If you do not use biodiversity-specific tools or methods for your assessment, select “No biodiversity assessment tools/methods used”.
Please explain how the tools and methods are implemented and provide an indication of the associated outcome(s) (column 5)
- This column is presented if anything other than “No biodiversity assessment tools/methods used” is selected in column 4.
- Explain why you have chosen to use the tools/methods selected in column 4 (Tools and methods…), and how you implement them.
- Indicate how the tools provided insight into your impacts/dependencies on biodiversity, and how this has informed decision-making and/or actions taken.
Portfolio activity [FS only] (column 3)
- This column is presented only if "Portfolio activity” is selected in column 2.
- Select all the portfolios for which you assess impacts (row 1) or dependencies (row 2) on biodiversity.
Explanation of terms
- Biodiversity performance: the measurement of success of an organization’s interventions towards mitigation of their negative biodiversity impacts.
- Dependency on biodiversity: organizations may be dependent on the services ecosystems provide if they function as an input or if they enable, enhance or influence environmental conditions required for successful corporate performance (IUCN, 2021).
Additional information
(C15.4) Does your organization have activities located in or near to biodiversity- sensitive areas in the reporting year?
Change from last year
New question
Rationale
Awareness of the proximity of your organization’s activities to biodiversity-sensitive areas demonstrates an understanding of the relationship between the two.
Ambition: Companies indicate whether they have activities located in or near to biodiversity-sensitive areas.
Connection to other frameworks
SDG
Goal 15: Life on Land
Response options
Select one of the following options:
Requested content
General
- Indicate whether any of your organization’s activities (i.e., sites and/or operations) are located within or near to biodiversity -sensitive areas.
- A ‘biodiversity- sensitive area’ refers to any area within the Natura 2000 network of protected areas, UNESCO World Heritage sites, and Key Biodiversity Areas (‘KBAs’), as well as any other protected area.
- Activities are considered to be located within a biodiversity- sensitive area if there is total or partial overlap of the activities with the biodiversity- sensitive area.
- Activities are considered to be located near to biodiversity- sensitive areas if the biodiversity- sensitive area is within the site/operation’s area of influence i.e., the area within which the activities may directly and/or indirectly cause impacts. For some sectors, such as Metals & mining, it is possible for impacts to be felt as far as 70km away (Sonter, L.J., Herrera, D., Barrett, D.J. et al., 2017).
(C15.4a) Provide details of your organization’s activities in the reporting year located in or near to biodiversity -sensitive areas.
Question dependencies
This question only appears if you select “Yes” in C15.4.
Change from last year
New question
Rationale
Awareness of the proximity of your organization’s activities to biodiversity -sensitive areas demonstrates an understanding of the relationship between the two. This awareness allows companies to mitigate potential negative effects of their activities on biodiversity -sensitive areas
Ambition: Companies implement mitigation measures to ensure their activities do not have negative impacts on biodiversity-sensitive areas.
Connection to other frameworks
SDG
Goal 15: Life on Land
Response options
Please complete the following table. You are able to add rows by using the “Add Row” button at the bottom of the table.
*Column/row appearance is dependent on selections in this or other questions.
| 1
|
2
|
3
|
4
|
5
|
| Classification of biodiversity -sensitive area
|
Country/area
|
Name of the biodiversity-sensitive area
|
Proximity
|
Briefly describe your organization’s activities in the reporting year located in or near to the selected area
|
Select from:
- Natura 2000 network of protected areas
- UNESCO World Heritage site
- Key Biodiversity Area (KBAs)
- Other biodiversity sensitive area, please specify
|
Select from:
[List of countries/areas]
|
Text field [maximum 500 characters]
|
Select from:
- Overlap
- Adjacent
- Up to 5 km
- Up to 10 km
- Up to 25 km
- Up to 50 km
- Up to 70 km
- Data not available
|
Text field [maximum 2,500 characters]
|
| 6
|
7
|
8
|
| Indicate whether any of your organization’s activities located in or near to the selected area could negatively affect biodiversity
|
Mitigation measures implemented within the selected area*
|
Explain how your organization’s activities located in or near to the selected area could negatively affect biodiversity, how this was assessed, and describe any mitigation measures implemented*
|
Select from:
- Yes, but mitigation measures have been implemented
- Yes, and no mitigation measures have been implemented
- No
- Not assessed
|
Select all that apply:
- Site selection
- Project design
- Scheduling
- Physical controls
- Operational controls
- Abatement controls
- Restoration
- Biodiversity offsets
- Other, please specify
|
Text field [maximum 3,000 characters]
|
[Add Row]
Requested content
General
- Add a row to provide information for each biodiversity -sensitive area that your activities (i.e., sites and/or operations) are located within or near to.
- If you have activities located in or near to multiple biodiversity -sensitive areas within a classification system listed in column 1, add a separate row to report information for each area within that classification.
Country/Area (column 2)
- Select the country/area that the biodiversity -sensitive area is located within.
- If the biodiversity- sensitive area spans across more than one country/area, select the country/area that the biodiversity- sensitive area falls primarily within.
Name of the biodiversity-sensitive area (column 3)
- Enter the name of the area/site, as specified in the classification system selected in column 1.
Proximity (column 4)
- Select the option that best describes the distance from your organization’s sites/operations to the biodiversity- sensitive area specified in column 3.
- If selecting one of the “Up to […] km” options, the specified distance represents the maximum distance from the biodiversity- sensitive area that impacts may be detected.
- Select “Adjacent” if your organization’s sites/operations are located side-by-side (i.e., share borders) with the biodiversity- sensitive area.
- Select “Data not available” if you are unable to determine the proximity.
Briefly describe your organization’s activities in the reporting year located in or near to the selected area (column 5)
- Provide details that contextualize the interaction between your organization’s sites/operations and the biodiversity sensitive area.
- Include details of how the proximity selected in column 4 was determined.
Indicate whether any of your organization’s activities located in or near to the selected area could negatively affect biodiversity (column 6)
- Activities negatively affecting biodiversity- sensitive areas refers to activities:
- Leading to the deterioration of natural habitats and the habitats of species, and to disturbance of the species for which the protected area has been designated; and
- where mitigation measures have not been implemented accordingly.
- When assessing whether your activities could negatively affect biodiversity, you should consider both:
- the direct impacts of physical sites, power transmission corridors, pipelines, disposal areas, and associated facilities that would not have been constructed in the absence of the sites/operations; and
- the indirect impacts of any other activities associated with the sites/operations and of emissions/effluents released by the sites/operations.
Mitigation measures implemented within the selected area (column 7)
- This column is presented only if “Yes, but mitigation measures have been implemented” is selected in column 6 (Indicate whether any of your organization’s…).
- The drop-down options are based on the mitigation hierarchy referred to in the guide prepared by The Biodiversity Consultancy to the Cross-Sector Biodiversity Initiative – CSBI (CSBI, 2015):
- Site selection – relocation of the site or site components away from an area recognized for its high biodiversity and ecosystem services value.
- Project design – selection of the type of infrastructure, and its placing and mode of operation on the site.
- Scheduling – changes in the timing of operational activities.
- Physical controls – adaptation of the physical design of the infrastructure to reduce potential impacts, such as installing culverts on roads, or bird flight diverters on transmission lines.
- Operational controls – management and regulation of the actions of people associated with the site/operations — including staff, contractors or (where feasible) project affected people and migrants.
- Abatement controls – reduction of the levels of pollutants (e.g. emissions of dust, light, noise, gases or liquids) that could have negative impacts on biodiversity and ecosystem services.
- Restoration – in the context of the mitigation hierarchy, restoration refers to measures taken to repair degradation or damage to specific biodiversity features and ecosystem services of concern (which might be species, ecosystems/habitats or particular ecosystem services) following impacts that cannot be completely avoided and/or minimized.
- Biodiversity offsets – measures taken to compensate for any residual significant, adverse impacts that cannot be avoided, minimized and / or rehabilitated or restored, in order to achieve no net loss or a net gain of biodiversity. Offsets can take the form of positive management interventions such as restoration of degraded habitat, arrested degradation or averted risk, protecting areas where there is imminent or projected loss of biodiversity (BBOP, 2012).
Explain how your organization’s activities located in or near to the selected area could negatively affect biodiversity, how this was assessed, and describe any mitigation measures implemented (column 8)
- This column is presented if anything other than “Not assessed” is selected in column 6.
- Provide further details and context regarding your selection in column 6:
- If you selected “No”, indicate the types of impacts included in your assessment and how you reached the conclusion that none of your sites/operations within this biodiversity -sensitive area could negatively affect biodiversity.
- If you selected “Yes, but mitigation measures have been implemented”, describe the mitigation measures implemented and how they mitigate negative direct and indirect impacts of your activities on biodiversity.
- If you selected “Yes, and no mitigation measures have been implemented”, describe the potential negative impacts of your activities and explain why mitigation measures have not been implemented.
- Where possible, provide sector-specific details of the nature of the potential negative impacts and how this has informed the scope of your assessment and chosen mitigation measures. For example, you may wish to indicate if the nature of your sector activities impacts your organization’s ability to avoid biodiversity -sensitive areas (e.g., a utility company that provides services to communities within a biodiversity -sensitive area would need to consider mitigation methods that allow the organization to continue to provide their services).
Explanation of terms
Biodiversity--sensitive area: refers to any area within the Natura 2000 network of protected areas, UNESCO World Heritage sites, and Key Biodiversity Areas (‘KBAs’), as well as any other protected area.
(C15.5) What actions has your organization taken in the reporting year to progress your biodiversity-related commitments?
Change from last year
No change (2022 C15.4)
Rationale
This question enables organisations to demonstrate how they are achieving their vision and ambition for biodiversity through addressing the issues they have identified and committed to addressing. Your response to this question aligns with requirements of “Stage 2: Ambitions” in IUCN’s Guidelines for planning and monitoring corporate biodiversity performance, which recommends that companies develop and deliver biodiversity goals and objectives.
Connection to other frameworks
SDG
Goal 15: Life on Land
Response options
Please complete the following table:
(*column/row appearance is dependent on selections in this or other questions)
| Have you taken any actions in the reporting period to progress your biodiversity-related commitments?
|
Type of action taken to progress biodiversity- related commitments*
|
Select from:
- Yes, we are taking actions to progress our biodiversity-related commitments
- No, we are not taking any actions to progress our biodiversity-related commitments
- No, we are not taking any actions to progress our biodiversity-related commitments, but we plan to within the next two years
- No, and we do not plan to undertake any biodiversity-related actions
|
Select all that apply:
- Land/water protection
- Land/water management
- Species management
- Education & awareness
- Law & policy
- Livelihood, economic & other incentives
- Other, please specify
|
Requested content
General
- Select the options that best describe the actions your organization is taking to progress your biodiversity-related commitments.
Type of actions taken to progress biodiversity-related commitments (column 2)
- This column is presented only if “Yes, we are taking actions to progress biodiversity-related commitments” is selected in column 1 (Have you taken any action…).
- Select:
- Land/Water protection: for actions taken to identify, establish or expand parks and other legally protected areas. For example, expanding national parks or identifying and establishing a nature reserve.
- Land/Water Management: for actions directed at conserving or restoring sites, habitats and the wider environment e.g. controlling poacher activity within protected areas.
- Species management: for actions directed at managing or restoring species, focused on the species itself. E.g. setting harvest quotas or selective culling to manage population size within a protected area.
- Education and Awareness: for actions directed at people to improve understanding and skills, and influence behavior. E.g. engaging with park managers to exchange knowledge on species identification or raising environmental awareness through company social media.
- Law and Policy: for actions to develop, change, influence and help implement formal legislation, regulations, and voluntary standards. This could include the promotion of conventions on biodiversity.
- Livelihood, Economic and other incentives: for actions to use economic and other incentives to influence behavior such as the use of certification, or positive incentives.
Additional information
(C15.6) Does your organization use biodiversity indicators to monitor performance across its activities?
Change from last year
No change (2022 C15.5)
Rationale
Robust indicators are critical for a corporate-level assessment of biodiversity impact, by allowing the aggregation of data from different activities and geographies. This question allows an organisation to demonstrate its use of indicators to track progress against its biodiversity goals and objectives and evaluate the success of its intervention/s. Your response to this question aligns with requirements of “Stage 3: Indicators” in IUCN’s Guidelines for planning and monitoring corporate biodiversity performance, which recommends that companies collect, share and analyse biodiversity data that encourages learning and improvement.
Connection to other frameworks
SDG
Goal 12: Responsible consumption and production
Response options
Please complete the following table:
| Does your organization use indicators to monitor biodiversity performance? | Indicators used to monitor biodiversity performance |
|---|
Select from:- Yes, we use indicators
- No, we do not use indicators, but plan to within the next two years
- No
| Select all that apply:- State and benefit indicators
- Pressure indicators
- Response indicators
- Other, please specify
|
Requested content
Indicators used to monitor biodiversity performance (column 2)
- Select:
- State and Benefit indicators: for state indicators focusing on improving habitats and species and benefit indicators that monitor ecosystem services goals.
- Pressure indicators: for pressure indicators that are effective for tracking objectives. For example, a focus of a company objective on loss of habitats could have the indicator ‘habitat cover change’ with data collected on trends in habitat cover loss.
- Response indicators: for response indicators that are informed by the company strategy. For example, to establish the coverage of protected areas.
Explanation of terms
- Biodiversity indicators: biodiversity indicators are communication tools that summarize data on complex environmental issues. They can be used to signal key issues to be addressed through policy or management interventions. Indicators, therefore, are important for monitoring the status and trends of biological diversity and, in turn, feeding back information on ways to continually improve the effectiveness of biodiversity policies and management programmes (GreenFacts, 2006).
Additional information
- For information on using indicators to assess biodiversity performance across company activities, see IUCN’s Guideline for planning and monitoring corporate biodiversity performance.
- For indicator(s) to be useful in a business application, they will need to take into consideration an understanding of the natural system, and an idea of how the system will respond to management (i.e., the indicator will provide a signal that can be attributed to a business).
- Biodiversity indicators help us measure and monitor a) pressures or threats, such as trends in land and water use, habitat loss or invasive species, b) the state of species and ecosystems, such as the health of species or integrity of ecosystems, c) the conservation response, such as the protection of important biodiversity areas, and/or d) benefits to people, such as the ecosystem services that freshwater provides. Fine scale indicators may be developed to inform local decisions on the ground, such as determining the degree to which restoration or management practices are working. Broad scale indicators that aggregate information may be developed to report on the benefits of national environmental policy and conservation investments (IUCN, 2021).
- Note: Companies do not need to develop new indicators. There are several existing indicators used by conservationists. Examples of good biodiversity indicators include those developed for monitoring Aichi targets and the SDGs. Existing indicators can be reviewed and appropriate ones selected.
(C15.7) Have you published information about your organization’s response to biodiversity-related issues for this reporting year in places other than in your CDP response? If so, please attach the publication(s).
Change from last year
No change (2022 C15.6)
Rationale
Investors want to understand how biodiversity issues, as a non-financial metric, have been integrated into mainstream financial reports. They will look to see how it is considered as part of business performance, where this is communicated, and whether these communications are in line with best practice. Your response to this question aligns with requirements of “Stage 4: Implementation” in IUCN’s Guidelines for planning and monitoring corporate biodiversity performance, which recommends that companies share the data that they collect.
Connection to other frameworks
SDG
Goal 12: Responsible consumption and production
Response options
Please complete the following table. You are able to add rows by using the “Add Row” button at the bottom of the table.
(*column/row appearance is dependent on selections in this or other questions)
| Report type
|
Content elements*
|
Attach the document and indicate where in the document the relevant biodiversity information is located*
|
Select from:
- In mainstream financial reports
- In other regulatory filings
- In voluntary sustainability report or other voluntary communications
- No publications
- Other, please specify
|
Select all that apply:- Content of biodiversity-related policies or commitments
- Governance
- Impacts on biodiversity
- Details on biodiversity indicators
- Influence on public policy and lobbying
- Risks and opportunities
- Biodiversity strategy
- Other, please specify
|
Text field [250 characters]
Attach your document here |
[Add row]
Requested content
General
- This question asks about communication of your position on biodiversity outside of your CDP response. Even where the relevant information is web-based, you must produce a static document to attach, due to the need to maintain a fixed response over time that can be accessed in full at any time in the future; a URL is inherently dynamic and therefore cannot fulfill this requirement.
Explanation of terms
- Biodiversity performance: The measurement of success of an organization's interventions towards the mitigation of their negative biodiversity impacts.
Additional information
C16 Signoff
Pathway diagram - questions
This diagram shows the general questions contained in module C16. To access question-level guidance, use the menu on the left to navigate to the question.
Further information
(C-FI) Use this field to provide any additional information or context that you feel is relevant to your organization's response. Please note that this field is optional and is not scored.
Change from last year
No change
Response options
This is an open text question with a limit of 9,999 characters.
Please note that when copying from another document into the ORS, formatting is not retained.
Signoff
(C16.1) Provide details for the person that has signed off (approved) your CDP climate change response.
Change from last year
No change
Rationale
CDP asks companies to identify the job title and corresponding job category of the person signing off (approving) the CDP response. This information signals to investors where in the corporate structure direct responsibility is being taken for the response and the information contained therein.
Response options
Please complete the following table:
| Job title
|
Corresponding job category
|
|
Text field [maximum 200 characters]
|
Select from:
- Board chair
- Board/Executive board
- Director on board
- Chief Executive Officer (CEO)
- Chief Financial Officer (CFO)
- Chief Operating Officer (COO)
- Chief Procurement Officer (CPO)
- Chief Risk Officer (CRO)
- Chief Sustainability Officer (CSO)
- Other C-Suite Officer
- President
- Business unit manager
- Energy manager
- Environmental, health and safety manager
- Environment/Sustainability manager
- Facilities manager
- Process operation manager
- Procurement manager
- Public affairs manager
- Risk manager
- Other, please specify
|
Requested content
General
Job title (column 1)
- Enter the title of the person who has signed off on this CDP response.
- Note that this question asks about the position and not about the name of the individual holding this position. Do not include names or any other personal data in your response.
Corresponding job category (column 2)
- Select the job category that most closely corresponds with the job title provided in column 1 "Job title". The job category selected should clearly correspond with the title given in column 1 "Job title".
- If you select “Other, please specify”, provide a label for the corresponding job category.
Explanation of terms
- Board: Or "Board of Directors" refers to a body of elected or appointed members who jointly oversee the activities of a company or organization. Some countries/areas use a two-tiered system where "board" refers to the "supervisory board" while "key executives" refers to the "management board".
Appendix A: Agricultural/Forestry management practices
Agroforestry: Agroforestry is a land management approach that combines the production of trees with other crops and/or livestock. Trees have high adaptive capacity because they are deep rooted and have large reserves of water and nutrients, and are less susceptible than annual crops to inter-annual variability or short-lived extreme events like droughts or floods. Additionally, trees improve soil quality and fertility by contributing to water retention and by reducing water stress during low rainfall years, and also have higher evapotranspiration rates than row crops or pastures and can thus pump excess water out of the soil. Trees can also reduce the impacts of weather extremes such as droughts or torrential rain and can stabilize the soil against landslides and raise infiltration rates
Biodiversity considerations: Enhancing agricultural biodiversity has significant potential to mitigate the impacts of greenhouse gases by increasing soil biodiversity to build soil organic matter, capturing carbon; using diverse leguminous crops to fix nitrogen in the soil, reducing the need for chemical fertilizers; introducing perennial crops to store carbon below ground; and planting temporary vegetative cover between successive crops to reduce nitrous oxide emissions by extracting unused nitrogen.
Change in the topography or landscapes: The use of hedges, vegetative buffer strips and other farm landscaping practices can have an enormous impact on adaptation to drought, heavy rains and winds. A change in topography can occur, for example, through the use of terraces which facilitate adaptation to climate change by optimizing water use.
Composting: The application of compost increases the amount of carbon sequestered in soils. The addition of nitrogen reduces agricultural energy demand as a result of the increased infiltration and storage capacity of soils, thus reducing irrigation needs. The application of compost reduces the need for greenhouse gas (GHG) producing fertilizer, pesticides and herbicides.
Crop diversity: The use of germplasm (genes) of crops, forages and wild relatives that have evolved in other parts of the world, which are under similar climatic conditions to those in areas currently under stress from climate change.
Contour farming: Reduces erosion and carbon mineralization
Crop rotation: Better nutrient management through crop rotation can decrease nitrogen fertilizer use, substantially lowering related GHG emissions.
Diversifying farmer income: Many producers are including more livestock in their operations to make use of increased forage production and to add value on the farm. Livelihood diversification into off-farm activities has the potential to reduce vulnerability to climate change impacts by reducing livelihood dependence upon farming activities. Increasing farmer resilience could ensure that the supply of agricultural inputs required by companies in the agricultural sector can be maintained over time.
Efficient equipment use: Equipment or machinery operated on farms or forest units; such as mobile machinery (e.g., harvesters), stationary equipment (e.g., boilers), and refrigeration and air-conditioning equipment are net sources of carbon dioxide (CO2), methane (CH4), and nitrous oxide (N2O), or fluorinated gases (e.g. HFCs and PFCs). When equipment and machines are used efficiently it contributes to reduce the overall greenhouse gas emissions.
Enhanced forest regeneration practices: Practices that may improve or accelerate forest regeneration, e.g., planting seeds or seedlings of fast-growth species.
Fertilizer management: Fertilizer type, application rate, timing and placement have been shown to influence the amount of nitrous oxide released to the atmosphere from some soils in some years. Improved fertilizer efficiency will also reduce the amount of excess nitrogen fertilizer that can be lost to the atmosphere or to surface or groundwater.
Fire control: A series of measures can be taken to reduce the risk of large forest fires, e.g., prescribed burning, grazing, vegetation cutting, sustainable forest management, fences and fire patrol. These measures reduce the fuel loading and/or ensure fires are controlled in time.
Equipment maintenance and calibration: Ensures reliability and accuracy of data.
Governmental or institutional policies and programs: Government programs and policies, such as tax credits, research support, trade controls and crop insurance regulations, significantly influence agricultural practices. Programs and policies may act to either promote or hinder adaptation to climate change.
Integrated pest management: Integrated Pest Management (IPM) is an effective and environmentally sensitive approach to pest management that relies on a combination of common-sense practices. IPM programs use current, comprehensive information on the life cycles of pests and their interaction with the environment. This information, in combination with available pest control methods, is used to manage pest damage. Consequently, carbon emissions from pesticide use can be reduced.
Knowledge sharing: Monitoring climate change, forecasting impacts and using early warning systems to disseminate data to a range of stakeholders from the national to the local level are all vital components to successful long-term adaptation planning and implementation. Sharing of best practice in agriculture is an important component of this practice.
Land use change: One of the most effective methods of reducing emissions is to allow or encourage the reversion of cropland to another land cover, typically one similar to the native vegetation. The conversion can occur over the entire land area (‘set-asides’) or in localized spots such as grassed waterways or field margin. Such land cover change often increases storage of carbon; for example, converting arable cropland to grassland typically results in the gain of soil carbon owing to lower soil disturbance and reduced carbon removal in harvested products. Compared to cultivated lands, grasslands may also have reduced nitrous oxide emissions from lower nitrogen inputs and higher rates of methane oxidation.
Additionally, reforestation and afforestation initiatives can increase the amount of biomass in a given area of land, thereby sequestering carbon in plant material.
Livestock management: Livestock, predominantly ruminants such as cattle and sheep, are significant sources of methane emissions and according to the Intergovernmental Panel on Climate Change (IPPC)’s Sixth Assessment Report (AR6) livestock account for approximately 30% of global anthropogenic emissions of this gas. The methane is produced primarily by enteric fermentation and voided by belching. Practices for reducing methane emissions from this source fall into three general categories: improved feeding practices, use of specific agents or dietary additives, and longer-term management changes and animal breeding. There are also anti-methogen vaccines available.
Adaptations in field-based livestock include additional care to continuously match stock rates with pasture production, altered rotation of pastures, modification of times of grazing, and timing of reproduction, alteration of forage and animal species/breeds, altered integration within mixed livestock/crop systems including using adapted forage crops, reassessing fertilizer applications, care to ensure adequate water supplies, and use of supplementary feeds and concentrates. Other adaptation methods include adjusting shading and air conditioning, and the use of sprinklers to cool livestock during excessive summer heat.
Low carbon energy use: For example, the installation of on-site renewable energy systems for electricity.
Low tillage and residue management: Since soil disturbance tends to stimulate soil carbon losses through enhanced decomposition and erosion, reduced or no-till agriculture often results in soil carbon gain. Systems that retain crop residues also tend to increase soil carbon because these residues are the precursors for soil organic matter, the main store of carbon in the soil.
Low tillage or increases soil organic matter. Soil organic matter improves and stabilizes the soil structure so that the soils can absorb higher amounts of water. Soil organic matter also improves the water absorption capacity of the soil for during extended drought. Additionally, a no- or low-tilled soil conserves the structure of soil for fauna and related macrospores (earthworms, termites and root channels) to serve as drainage channels for excess water.
Manure management: Animal manures can release significant amounts of nitrous oxide and methane during storage, but the magnitude of these emissions varies. Methane emissions from manure stored in lagoons or tanks can be reduced by cooling or covering the sources, or by capturing the methane emitted. The manures can also be digested anaerobically to maximize retrieval of methane as an energy source. Storing and handling the manures in solid rather than liquid form can suppress methane emissions
Organic farming: Agriculture can make a significant contribution to mitigating climate change by taking carbon out of the air and sequestering it in the soil. The soil carbon benefit of organic farming results from the fact that the system is based on inputs of organic matter to the soil and the decomposition of this by soil microbial activity for releasing nutrients for crop production, instead of using inorganic fertilizers. This process at the same time produces humus (stable soil carbon) and thereby raises the soil’s carbon levels. As well, there is evidence that organic farming can have advantages in drought-conditions, such as higher yields compared to non-organic systems, because of the higher water-holding capacity of soils under organic management.
Practices to increase wood production and forest productivity: One of the most effective ways to sequestering carbon from the atmosphere is through carbon fixation in wood. Thus, applying techniques that promote high wood yield and productivity may be an effective mitigation strategy.
Permanent soil cover (including cover crops): The maintenance of permanent soil cover through crops, crop residues or cover crops increases soil organic matter. Surface mulch cover also acts to protect soil from excess temperatures and evaporation losses and can reduce crop water requirements by 30% (FAO, 2007).
Pest, disease and weed management practices: The introduction of new cultivated species and improved varieties of crop is a technology aimed at enhancing plant productivity, quality, health and nutritional value and/or building crop resilience to diseases, pest organisms and environmental stresses. Crop diversification refers to the addition of new crops or cropping systems to agricultural production on a particular farm
Reducing energy use: Energy-related greenhouse gas emissions from the agricultural sector can be reduced in a number of ways, including the use of more fuel-efficient machinery
Restoration: Forest restoration in general can result in net emissions reduction as forests sequester more carbon than it loses.
Replacing fossil fuels by renewable energy sources: Fossil fuels used in machinery/vehicles may be responsible for large CO2e emissions. Thus, transitioning to renewable fuels is an alternative to reduce these emissions.
Restoration of degraded lands and cultivated organic soils: Agricultural soil is a dynamic biological system that both stores and releases greenhouse gases. Whether or not the soil acts as a net source of CO2e or a net sink for CO2 can be influenced by soil management. By increasing soil organic matter levels growers can decrease CO2e emissions and increases the soil carbon sink.
Rice management: Cultivated wetland rice soils emit significant quantities of methane. Emissions during the growing season can be reduced by many practices. For example, draining the wetland rice once or several times during the growing season effectively reduces methane emissions
Seed variety selection: Varietal selection of seeds to minimize GHGs.
Selective logging: Techniques used to harvest trees of commercial interest, ensuring the integrity of structure and functionality of natural forests are beneficial for climate change mitigation. Selective logging may represent emissions reductions compared with other harvesting techniques.
Selecting species to maximize carbon capture: Carbon sequestration rates vary according to plant species. For forest plantations or in restoration projects, fast-growth species may be selected to accelerate carbon capture.
Species introduction: Introducing grass species with higher productivity or carbon allocation to deeper roots has been shown to increase soil carbon. For example, introducing legumes into grazing lands can promote soil carbon storage.
Timing of farm operations: A diversity of crop types and varieties are grown in rotation can help spread the risk of losing an entire year's production. Some producers also stagger their seeding and therefore harvesting dates by choosing a variety of crops that require a range of growing conditions so that crops are at different stages (and therefore more or less vulnerable) if and when climate/weather conditions start having a negative impact. A longer and warmer growing season may allow earlier planting and harvesting dates, so that the extremely arid conditions of late summer are avoided.
Waste management: The disposal and treatment of waste can produce emissions of several greenhouse gases (GHGs), which contribute to global climate change. Sustainable waste management encourages the generation of less waste, the re-use of consumables, and the recycling and recovery of waste that is produced.
Water Management: Irrigation measures can enhance carbon storage in soils through enhanced yields and residue returns. The drainage of agricultural lands in humid regions can also promote productivity (and hence soil carbon) and suppress nitrous oxide emissions by improving aeration.
A broad range of agricultural water management practices and technologies are available to spread and buffer production risks. Enhancing residual soil moisture through land conservation techniques assists significantly at the margin of dry periods while buffer strips, mulching and zero tillage help to mitigate soil erosion risk in areas where rainfall intensities increase. The inter-annual storage of excess rainfall and the use of resource efficient irrigation remain the only guaranteed means of maintaining cropping intensities.
The use of artificial systems to improve water use/availability and protect against soil erosion, is also considered to be an adaptation mechanism.
Glossary - Climate Change
- Acquisition: Obtaining ownership and control by one firm, in whole or in part, of another firm or business entity.
- Adaptation: Adjustment to climate change current or expected effects so the consequences to the business and environment are alleviated and beneficial opportunities are realized.
- Attribute: Descriptive or performance characteristics of a particular generation resource. For Scope 2 GHG accounting, the GHG emission rate attribute of the energy generation is required to be included in a contractual instrument in order to make a claim.
- Best available technique (BAT): Best available technique (BAT) refers to the available techniques which are the best for preventing or minimizing emissions and impacts on the environment. BAT include both the technology used, and the way your installation is designed, built, maintained, operated and decommissioned.
- Biogas: A mixture of methane (CH4) and carbon dioxide (CO2) used as fuel and produced by bacterial degradation of organic matter or through gasification of biomass. Included in this category are landfill gas and sludge gas (sewage gas and gas from animal slurries) and other biogas.
- Biogenic carbon: This refers to carbon which is contained in biomass (both above-ground and below-ground), dead organic matter, soil organic matter, and harvested products.
- Biomass: any organic matter, i.e. biological material, available on a renewable basis. Includes feedstock derived from animals or plants, such as wood and agricultural crops, and organic waste from municipal and industrial sources. Biomass fuels should be sustainably sourced and certified where possible, and include:
- Solid biofuels - solid fuels derived from biomass. Includes feedstock derived from animals or plants, such as wood and agricultural crops, and organic waste from municipal and industrial sources.
- Biogas - a mixture of methane (CH4) and carbon dioxide (CO2) used as fuel and produced by bacterial degradation of organic matter or through gasification of biomass.
- Liquid biofuels – liquid fuels derived from biomass such as ethanol and biodiesel.
- Board: Or “Board of Directors” refers to a body of elected or appointed members who jointly oversee the activities of a company or organization. Some countries use a two-tiered system where “board” refers to the “supervisory board” while “key executives” refers to the “management board".
- C-suite: A term used to collectively refer to the most senior executive team.
- Capital allocation: Refers to distributing and investing a company's financial resources in ways that will increase its efficiency and maximize its profits. Some options for allocating capital could include returning cash to shareholders via dividends, repurchasing shares of stock, issuing a special dividend, or increasing a research and development (R&D) budget. Alternatively, the company may opt to invest in growth initiatives, which could include acquisitions and organic growth expenditures.
- Capital expenditure: A measure of the value of purchases of fixed assets such as property, buildings, an industrial plant, technology, or equipment. Put differently, CapEx is any type of expense that a company capitalizes, or shows on its balance sheet as an investment, rather than on its income statement as an expenditure.
- Carbon capture and storage (CCS): As defined by the IEA, a family of technologies and techniques that enable the capture of carbon dioxide (CO2) from fuel combustion or industrial processes, the transport of CO2 via ships or pipelines, and its storage underground, in depleted oil and gas fields and deep saline formations.
- Carbon capture, utilization and storage (CCUS): A family of technologies and techniques in which carbon dioxide (CO2) is captured and utilized/used. Examples of direct utilization include CO2 use in the food and drink industry and for enhanced oil recovery. CO2 can also be converted into chemicals or fuels. If CO2 is stored but not utilized, then the process should be classified as CCS.
- Climate-related risk: In line with the TCFD, this refers to the potential negative impacts of climate change on an organization. Physical risks emanating from climate change can be event-driven (acute) such as increased severity of extreme weather events (e.g., cyclones, droughts, floods, and fires). They can also relate to longer-term shifts (chronic) in precipitation, temperature and increased variability in weather patterns (e.g., sea level rise). Climate-related risks can also be associated with the transition to a lower-carbon global economy, the most common of which relate to policy and legal actions, technology changes, market responses, and reputational considerations.
- Climate-related opportunity: In line with the TCFD, this refers to the potential positive impacts on an organization resulting from efforts to mitigate and adapt to climate change, such as through resource efficiency and cost savings, the adoption and utilization of low-emission energy sources, the development of new products and services, and building resilience along the supply chain. Climate-related opportunities will vary depending on the region, market, and industry in which an organization operates.
- Climate transition plan: a time-bound action plan that clearly outlines how an organization will achieve its strategy to pivot its existing assets, operations, and entire business model towards a trajectory that aligns with the latest and most ambitious climate science recommendations, i.e., halving greenhouse gas (GHG) emissions by 2030 and reaching net-zero by 2050 at the latest, thereby limiting global warming to 1.5 degrees Celsius. Please refer to the CDP Climate Transition Plan technical note for more details.
- Combustion: Combustion refers to combustion within the company’s boundary giving rise to emissions of CO2, N2O, and CH4. Sources may include boilers, heaters, furnaces, incinerators, internal combustion engines, and turbines. Scope 1 GHG emissions exclude emissions of CO2 arising from the combustion and fermentation of biomass and biofuels; these emissions are reported as a separate category.
- Company: Throughout this questionnaire, “your company” refers collectively to all the companies, businesses, organizations, other entities or groups that fall within your definition of the reporting boundary.This term is used interchangeably with “your organization”, but CDP recognizes that some disclosing organizations may not consider themselves to be, or be formally classified, as “companies”.
- Consolidation approach: The identification of companies, businesses, organizations etc. for inclusion within the reporting boundary of the responding organization is known as the “consolidation approach”. The way in which you report information for the companies that are included within the reporting boundary is known as the “consolidation approach” because, unless stated otherwise, the information you provide in response to the questionnaire should be presented as one “consolidated” result covering all of the companies, entities, businesses etc within your reporting boundary. The GHG Protocol states that two distinct approaches may be used to consolidate GHG emissions; the equity share and the control approaches. Control can be defined in either financial (financial control) or operational (operational control) terms.
- Consumption: Consumption includes the use of goods, waste disposal and end of life treatment of products sold by the reporting organization.
- Contractual instrument (or 'instrument'): Any type of contract between two parties for the sale and purchase of energy bundled with attributes about the energy generation, or for unbundled attribute claims. Markets differ as to what contractual instruments are commonly available or used by companies to purchase energy or claim specific attributes about it, but they can include energy attribute certificates (e.g. RECs, GOs), direct contracts (PPAs), green tariffs and other instruments.
- Direct costs: Also known as “costs of goods or services sold”. These expenses can be attributed to the manufacture of a particular product or the provision of a particular service.
- Divestment: A process for selling assets for financial, environmental, political or social goals.
- Electricity: In line with GHG Protocol, this term is used as shorthand for electricity, steam, and heating/cooling. Purchased electricity is defined as electricity that is purchased or otherwise brought into the organizational boundary of the company. Scope 2 emissions physically occur at the facility where electricity is generated.
- Energy attribute certificates: A category of contractual instruments used in the energy sector to convey information about energy generation to other entities involved in the sale, distribution, consumption, or regulation of electricity.
- Feedstocks: Feedstocks are starting materials, ranging from fossil fuels to biomass-based resources. These materials are fed into a process, and converted into other commodities or resources, which are either used directly or further transformed . For example, in the steel industry, coking coal is converted to coke, which is used in the steel production. In the petrochemical industry, gaseous feedstocks (ethane, propane, or butane) are used to produce high value chemicals.
- Financial planning: In line with the TCFD recommendations, refers to an organization’s consideration of how it will achieve and fund its objectives and strategic goals. Financial planning allows organizations to assess future financial positions and determine how resources can be utilized in pursuit of short- and long-term objectives. As part of financial planning, organizations often create “financial plans” that outline the specific actions, assets, and resources (including capital) necessary to achieve these objectives over a 1- 5 year period. However, financial planning is broader than the development of a financial plan as it includes long-term capital allocation and other considerations that may extend beyond the typical 3-5 year financial plan (e.g., investment, research and development, manufacturing, and markets).
- Fugitives: Fugitives comprises all intentional or unintentional releases of carbon dioxide (CO2) methane (CH4) and other greenhouse gases. The primary sources of these emissions may include fugitive equipment leaks, evaporation losses, venting, flaring and accidental releases. Further examples of leak sources include valves, fittings, flanges, compressor seals, other compressor related leaks, heaters, dehydrators, and pipelines. Accidental fugitive emissions can be individually found and fixed in order to make the emissions near zero. Emissions from non-point sources, such as wastewater treatment and surface impoundments, should be accounted for under fugitive emissions.
- gCO2/kWh: Grams of carbon dioxide (gCO2) per kilowatt hour (kWh)of electricity consumed.
- gCO2e/kWh: Grams of carbon dioxide equivalents (CO2e) emitted per kilowatt hour (kWh) of electricity consumed. CO2-equivalents allow for other Greenhouse Gases (GHGs) to be expressed in relation to CO2 based on their Global Warming Potentials (GWPs).
- GHG inventory: A quantified list of an organization’s greenhouse gas emissions and sources.
- Global warming potential (GWP): The Intergovernmental Panel on Climate Change (IPPC)’s Fifth Assessment Report (AR5) defines the Global Warming Potential (GWP) as “an index, based on radiative properties of greenhouse gases, measuring the radiative forcing following a pulse emission of a unit mass of a given greenhouse gas in the present day atmosphere integrated over a chosen time horizon, relative to that of carbon dioxide. The GWP represents the combined effect of the differing times these gases remain in the atmosphere and their relative effectiveness in causing radiative forcing. The Kyoto Protocol is based on GWPs from pulse emissions over a 100-year time frame.” By using GWPs, GHG emissions from multiple gases can be standardized to a carbon dioxide equivalent (CO2e).
- Greenhouse gases: In line with Kyoto Protocol to the United Nations Framework Convention on Climate Change (UNFCCC) and amendment issued by the Greenhouse Gas Protocol on May 2013 the basket of greenhouse gases (GHGs) consists of:
- Carbon dioxide (CO2);
- Methane (CH4);
- Nitrous oxide (N2O);
- Hydrofluorocarbon family of gases (HFCs);
- Perfluorocarbon family of gases (PFCs);
- Sulfur hexafluoride (SF6), and;
- Nitrogen trifluoride (NF3).
Nitrogen trifluoride (NF3) is now considered a potent contributor to climate change and is therefore mandated to be included in national inventories under the UNFCCC. NF3 should also be included in GHG inventories under the GHG Protocol Corporate Standard, and the GHG Protocol Corporate Value Chain (Scope 3) Standard.
- Heating Value: Lower heating value (LHV) and Higher heating value (HHV), also known as net calorific value (NCV) and gross calorific value (GCV) respectively, are different measures of heat energy released from fuel combustion. Figures measured in HHV are larger because HHV includes the latent heat of water vaporization from combustion, whereas LHV does not. The difference between LHV and HHV is related to the fuel’s hydrogen content.
- Indirect (operating) costs: Refers to the essential expenses incurred in order to maintain the business including wages, rent, transport, energy (electricity, fuel, etc.), maintenance, and so on. These expenses cannot be attributed to the manufacture of a particular product or the provision of a particular service - they are standard costs that apply regardless of the volume of goods produced.
- Intensity metrics : Intensity metrics describe an organization’s CO2e emissions in the context of another business metric. In this way, the emissions are normalized to account for growth. Intensity is calculated by dividing the CO2e emissions figure (the numerator) by an alternative business metric (the denominator), such as the number of full-time equivalent employees, the revenue or tons of aggregate produced.
- Land use: Land use is based on the functional dimension of land for different human purposes or economic activities. Typical categories for land use are dwellings, industrial use, transport, recreational use or nature protection areas. Additional land use metrics can relate to the climate-related arrangements, activities, and inputs regarding these categories that organizations engage in, and can include land use change and land use management metrics.
- Low-carbon energy: In line with the IEA definition, low-carbon technologies are technologies that produce low – or zero – greenhouse-gas emissions while operating. In the power sector this includes fossil-fuel plants fitted with carbon capture and storage, nuclear plants and renewable-based generation technologies. Natural gas, combined cycle gas turbine and fossil fuel-based combined heat and power (cogeneration), despite being less carbon intensive than other means of electricity production like coal, are not considered low-carbon.
- Low-carbon product or service: CDP broadly defines a low-carbon product/service as a product or service which has comparatively lower emissions across its entire life cycle (i.e. from material acquisition through to product end-of-life) when compared to a baseline (business-as-usual) scenario or reference product of a similar function. Note that a product can only be considered low-carbon if its production and use does not prevent and/or contributes to reaching net-zero by 2050 or sooner. To define whether the product or service is low-carbon, CDP encourages the use of existing industry taxonomies and frameworks such as Climate Bonds Taxonomy, the IEA Energy Technology Perspectives (ETP) Clean Energy Technology Guide, and the EU Taxonomy for Environmentally Sustainable Economic Activities.
- Mainstream reports: In line with CDSB, this refers to the annual reporting packages in which organizations are required to deliver their audited financial results under the corporate, compliance or securities laws of the country in which they are incorporated or, if relevant, operate. Mainstream reports are traditionally publicly available. They provide information to existing and prospective investors about the financial position and financial performance of the organisation. The exact provisions under which companies are required to deliver mainstream financial reports differ internationally, but will generally contain financial statements and other financial reporting, including governance statements and management commentary.
- Metric tons of CO2 (tCO2): a metric ton of carbon dioxide (CO2) has a mass of 1000 kg, equivalent to 2204.62 lbs. The “long ton”, a term generally used in Britain, is equivalent to 2,240lbs and the “short ton” is generally used in the USA and is equivalent to 2,000 lbs.
- Metric tons of CO2-equivalent (tCO2e): a metric that allows for other Greenhouse Gases (GHGs) to be expressed in relation to CO2 based on their Global Warming Potentials (GWPs). A metric ton is 1000 kg, equivalent to 2204.62 lbs.
- Mitigation: or "climate change mitigation" refers to efforts to reduce or prevent emission of greenhouse gases.
- Organization: Throughout this questionnaire, “your organization” refers collectively to all the companies, businesses, other entities or groups that fall within the definition of your reporting boundary (provided in C0.5). This term is used interchangeably with “your company”. CDP recognizes that some disclosing organizations may not consider themselves to be, or be formally classified, as “companies”.
- Process emissions: emissions from industrial production processes which chemically or physically transform materials (e.g. CO2 from the calcinations step in cement manufacturing, CO2 from catalytic cracking in petrochemical processing, PFC emissions from aluminum smelting, etc.)
- Purchased or acquired electricity, steam, heat, and/or cooling: Specific information on these energy carriers can be found in section 5.3.1 and Appendix A of the GHG Protocol Scope 2 Guidance. The terms ‘purchased’ and ‘acquired’ are used when your organization has received the energy from a third party. This rules out energy that is sourced from within the organizational/sector boundary. It should be noted that purchased or acquired heat does not include the heat content, or calorific value, of fuels that are purchased or acquired by the organization. This is accounted for at the point of fuel consumption, which falls inside the Scope 1 boundary. You should also be aware that steam, heat or cooling received via direct line as ‘waste’ from an industrial process, should still be accounted for if it is consumed.
- Renewable energy: CDP follows the definition of renewable energy given in the GHG Protocol: “Energy taken from sources that are inexhaustible, e.g. wind, water, solar, geothermal energy and biofuels.”
- Reporting boundary: This determines which organizational entities, such as groups, businesses and companies, are included in or excluded from your disclosure. These may be included according to your financial control, operational control, equity share or another measure. Please consistently apply this organizational boundary when responding to questions unless you are specifically asked for data about another category of activities.
- Research and development (R&D): Refers to the activities companies undertake to innovate and introduce new products and services. It is often the first stage in the development process. Investment in R&D is a type of expense associated with the research and development of a company's goods or services
- Revenue: Income arising in the course of an entity’s ordinary activities (less returns, allowances and discounts) - before deducting costs for the goods/services sold and operating expenses to arrive at profit (based on the International Financial Reporting Standard)
- Risk management: Risk management involves identifying, assessing and responding to risk to make sure organizations achieve their objectives. It must be proportionate to the complexity and type of organization involved (based on Institute of Risk Management, 2016).
- Scenario analysis: A scenario describes a potential path of development that will lead to a particular outcome or goal. Scenario analysis is the process of highlighting central elements of a possible future and drawing attention to key factors (or critical uncertainties). It is a tool to enhance critical strategic thinking by challenging “business-as-usual” assumptions, and to explore alternatives based on their relative impact and likelihood of occurrence. Scenarios are not forecasts or predictions, but tools to describe potential pathways that lead to a particular outcome or goal.
- Qualitative scenarios: A high level, narrative approach to scenario analysis, suitable for organizations familiarizing themselves with the process. Qualitative scenario analysis explores relationships and trends for which little or no numerical data is available.
- Quantitative scenarios: A more detailed method for conducting scenario analysis, with greater rigor and sophistication in the use of data sets and quantitative models which may warrant further analysis. Quantitative scenario analysis can be used to assess measurable trends and relationships using models and other analytical techniques.
- 2°C or lower scenario: A core element of the TCFD’s Strategy recommendation c) “Describe the resilience of the organization’s strategy, taking into consideration different climate-related scenarios, including a 2°C or lower scenario”. As noted on page 26 of the TCFD Guidance on Scenario Analysis for Non-Financial Companies, the TCFD now recommends that in assessing transition risks, companies should consider using or developing a 1.5°C scenario for the “2°C or lower scenario”, stating that “a 1.5°C scenario would provide stronger diversity in assumptions about future policies and technologies. A 1.5°C scenario also aligns with the latest scientific research from the IPCC, the growing momentum of pledges to limit emissions to net-zero by 2050, and the spirit of the Paris Agreement, demonstrating a company’s alignment to recognized temperature targets.”
- Publicly available scenarios: Taken from TCFD recommendations, “Publicly available scenarios” refer to scenarios which are:
- used/referenced and issued by an independent body;
- wherever possible, supported by publicly available datasets;
- updated on a regular basis; and linked to functional tools (e.g., visualizers, calculators, and mapping tools) that can be applied by organizations.
- Sequestration of CO2: The fixation of atmospheric carbon dioxide in a carbon sink through biological or physical processes.
- Strategy: In line with TCFD recommendations, refers to an organization’s desired future state. An organization’s strategy establishes a foundation against which it can monitor and measure its progress in reaching that desired state. Strategy formulation generally involves establishing the purpose and scope of the organization’s activities and the nature of its businesses, taking into account the risks and opportunities it faces and the environment in which it operates.
- Substantive impact on the business: An impact that has a considerable or relatively significant effect on an organization at the corporate level. This could include operational, financial or strategic effects that undermine the entire business or part of the business.
Important Information
Companies should not consider their CDP response a means of complying with any regulatory requirement to share financially sensitive non-public information with the market. You may wish to consult with your financial, legal, and/or compliance departments for advice on your company’s general approach to the provision of forward-looking statements and information concerning risks.
CDP questionnaire copyright and licensed use
The copyright to CDP’s annual questionnaire/s is owned by CDP Worldwide, a registered charity number 1122330 and a company limited by guarantee, registered in England number 05013650. Any use of any part of the questionnaire, including the questions, must be licensed by CDP. Any unauthorized use is prohibited and CDP reserves the right to protect its copyright by all legal means necessary.
Terms for responding to the CDP Climate Change Questionnaire 2023
These terms apply if you are submitting a response to the CDP Climate Change Questionnaire 2023. If you are also submitting a response to the CDP Forests Questionnaire 2023 or the CDP Water Security Questionnaire 2023 the corresponding terms for responding to each questionnaire will also apply.
1. DEFINITIONS
Affiliate(s): means any entity that controls, is controlled by, or is under common control with a party. For the purposes of this definition, “control” of an entity means the ownership, directly or indirectly, of more than fifty percent of the outstanding voting securities or capital stock of such entity, or the legal power to direct or cause the direction of the general management and policies of such entity.
Amended Response: has the meaning given in Section 10.3.
Bank Program Member: means a banking institution or organization that has entered into a bank program member agreement with CDP, that is requesting disclosure from their clients.
Billing Company: means the organization determined in accordance with the table in Section 20 of these terms.
CDP: means CDP Worldwide, a charitable company registered with the Charity Commission of England and Wales (registered charity no. 1122330 and company number 05013650). References to “we”, “our” and “us” in these terms are references to CDP.
CDP Affiliate(s): means any Affiliate of CDP, and any organizations within CDP’s operational group to whom we license the CDP name and brand (which shall include CDP North America, and CDP Europe, and their Affiliates).
CDP Europe: means CDP Europe AISBL, a charity registered in Belgium whose registered address is Due Ducale 67, 1000 Brussels, Belgium.
CDP North America: means CDP North America, Inc., the Delaware incorporated non-profit 501(c)3 organization whose registered office is at 127 W 26th Street, Third Floor, New York, NY, 10001, United States.
CDP Response Dashboard: the area of our website where each Responding Company signs into its corporate user account, in order to view which Requesting Authorities have requested it to submit a Response, and other information to track submission of its Response.
Deadline: means 26 July 2023 (or any alternative date that is notified to Responding Companies during CDP’s disclosure cycle for 2023, via the notification methods outlined in Section 6.4 of these terms).
Disclosure API: means the application programming interface connected to the Online Response System that the Responding Company may use through any CDP accredited solutions provider to facilitate submission of its Response.
Fee: means the annual administrative fee to enable CDP to maintain its Online Response System.
Final Closure Date: 27 September 2023 (or any alternative date that is notified to Responding Companies during CDP’s disclosure cycle for 2023, via the notification methods outlined in Section 6.4 of these terms).
Financial Services Responding Company: means any Responding Company that is assigned the CDP ACS classification of ‘financial services’ and that responds to the ‘financial services’ questions contained in the Questionnaire.
Full Version: means the complete version of the Questionnaire which contains all questions that are applicable to you as a Responding Company.
Investor Signatory: means an organization that has entered into an investor signatory agreement with us, that is requesting disclosure from companies.
Minimum Version: means the version of the Questionnaire which contains a subset of the questions included in the Full Version.
Net Zero Asset Managers initiative: means the network partners of the Net Zero Asset Managers initiative, namely: CDP; PRI (Principles for Responsible Investing) PRI Association, of 25 Camperdown Street, London, E1 8DZ, UK; IIGCC (Institutional Investor Group on Climate Change) of Pennine Place 2a Charing Cross Road London, WC2H 0HF UK; AIGCC (Asian Investors Group on Climate Change) of PO Box Q937 Queen Victoria Building, Sydney NSW 1230 Australia; IGCC (Investors Group on Climate Change), of PO Box Q937, Queen Victoria Building, NSW 1230, Australia; and Ceres, of 99 Chauncy Street, 6th Floor, Boston, MA 02111 USA, that is requesting disclosure from its member companies.
Online Response System: means the CDP operated online disclosure system, where Responding Companies are required to complete and submit their Response.
Personal Data: means data which relates to an individual who can be identified from the data (such as a person’s name, email address, and job title).
Questionnaire: means the CDP Climate Change Questionnaire 2023.
RE100 initiative: means the global corporate renewable energy initiative bringing together businesses committed to 100% renewable electricity, led by The Climate Group (registered charity no. 1102909 and registered company no. 4964424) in its capacity as leader, in partnership with CDP, that is requesting disclosure from its member companies.
Reopened Response: has the meaning given in Section 10.1.
Requesting Authority: means the organization(s) requesting you to complete the Questionnaire as listed on your CDP Response Dashboard, categorised in accordance with the following types (which may be modified and subject to change, from time to time):
(1) Investor Signatories;
(2) Supply Chain Members;
(3) Bank Program Members;
(4) the Net Zero Asset Managers initiative; and
(5) the RE100 initiative.
Responding Company: means the company responding to the Questionnaire. References to “you” and “your” in these terms are references to you as the Responding Company.
Response: means your submitted response to the Questionnaire made via our Online Response System.
Supply Chain Member: means an organization, that has entered into a supply chain member agreement with CDP, that is requesting disclosure from companies that are in its supply chain.
2. PARTIES
2.1. The parties to these terms are:
(1) CDP;
(2) Responding Company
(and solely where the Billing Company is not CDP, and the Fee is payable); and
(3) Billing Company.
2.2. The Billing Company can be identified by referring to Section 20.
3. YOUR AGREEMENT TO THESE TERMS
3.1. These are the terms that apply when you submit a Response to the Questionnaire. Please read these terms carefully. Submission of your Response signifies your agreement to these terms. Further, you will not be able to submit a Response unless you agree to these terms.
3.2. If you do not agree to these terms, please contact us at our Help Center: https://help.cdp.net/
4. IMPORTANT REPRESENTATIONS
4.1. You confirm that:
(a) the person submitting the Response to us is authorised by the Responding Company to submit the Response;
(b) the Responding Company has obtained all necessary consents and permissions to submit a Response to us;
(c) the Responding Company is a legal entity and not a sole trader, partnership or natural person or persons; and
(d) the Response that you submit:
(i) does not infringe the rights of any third party (including privacy, publicity or intellectual property rights);
(ii) does not defame any third party; and
(iii) does not include any Personal Data.
5. ‘PUBLIC’ AND ‘NON-PUBLIC’ RESPONSES GENERALLY
5.1. Submitting your Response ‘publicly’ or ‘non-publicly’. When responding to our Questionnaire, you will be given a choice as to whether your Response can be made ‘public’ or whether your Response is ‘non-public’. We strongly encourage you to make your Response ‘public’.
6. SCORING ELIGIBILITY, DEADLINES, RELEVANT DATES, OUR SYSTEMS AND GENERAL INFORMATION
6.1. Eligibility for scoring. To be eligible for scoring you must submit your Response to us via our Online Response System by the Deadline. CDP may publish your score in accordance with Sections 11 to 13 of these terms. Please review those Sections carefully for further information relating to scoring your Response, and the criteria for publication of your score.
6.2. If submission of your Response misses the Deadline. Notwithstanding Section 10 below (in relation to amending your Response), we reserve the right:
(i) not to score your Response; and
(ii) not to include data contained in your Response in any report, data product or other analysis.
6.3. We may elect at our sole discretion to score your Response if you submit it after the Deadline and before the Final Closure Date but are under no obligation to do so.
6.4. CDP reserves the right to make changes to relevant dates. To the extent that any calendar date, or period of days is referred to in these terms and relates to the timetable for submission of your Response, or CDP’s timetable for scoring and/or publication of your score, such calendar date, or period of days, may be subject to change and modified by CDP at its sole discretion at any time, and notified to you via methods including: emails to the Responding Company and/or notifications within the CDP Response Dashboard. In addition, CDP may provide notice of any such relevant date change(s) on the CDP website.
6.5. CDP’s online systems. Our Online Response System and the CDP Response Dashboard are not the same. The CDP Response Dashboard allows you to track information related to submission of your Response and the identity of your Requesting Authorities, whereas our Online Response System is the online solution where you draft and submit your Response. You agree that CDP shall not be liable, shall be held fully harmless and accepts no responsibility for any delay to the time of submission of Response, failure to submit Responses by the Deadline, errors, omissions, corruption or loss of data or software, caused directly or indirectly by the Responding Company’s use of the Disclosure API to facilitate submission of its Response.
6.6. Requesting Authority list(s) on our website. From time to time, we may make a list of Requesting Authorities available on our website, but we are under no obligation to do so on an ongoing, or exhaustive basis.
7. PUBLIC RESPONSES AND CDP’S USAGE
7.1. You agree that CDP may use your ‘public’ Response for all purposes that we decide. If you submit your Response using the ‘public’ option, our uses of your Response may include (but not be limited to):
(i) making your Response publicly available on our website;
(ii) making your Response available to your Requesting Authorities (and their Affiliates);
(iii) making your Response available to other third parties; and
(iv) scoring your Response.
7.2. Where you are headquartered in the EU, and your Response is ‘public’, we may share your reported climate and environmental actions on the European Climate Pact website. The European Climate Pact is a European Commission initiative bringing citizens and organizations together to achieve a climate-neutral Europe, and more information can be found here: https://europa.eu/climate-pact/about/about-pact_en
8. NON-PUBLIC RESPONSES AND CDP’S USAGE
CDP general restrictions.
8.1. Subject to Section 8.7, if your Response is submitted using the ‘non-public’ option, CDP shall not publish the Response without the information in your Response first being anonymized (or aggregated in such manner that it has the effect of being anonymized).
How CDP may share your non-public Response.
8.2. Where your Response is ‘non-public’, dependant on the type(s) of Requesting Authorities that have requested your Response, you agree that CDP may share your non-public Response in accordance with Parts A to D below (where relevant, and as applicable).
Part A – Supply Chain Members, and Bank Program Members.
8.3. You agree that where one of your Requesting Authorities is a Supply Chain Member, or a Bank Program Member, as soon as your ‘non-public’ Response is received:
(i) CDP may make your Response available to each Supply Chain Member (that is a Requesting Authority specifically for you, and their Affiliates); and
(ii) CDP may make your Response available to each Bank Program Member (that is a Requesting Authority specifically for you, and their Affiliates).
8.4. Your Response may therefore be provided to multiple Supply Chain Members, or multiple Bank Program Members. This will depend on the number of Requesting Authorities that have requested a Response specifically from you, as a Responding Company. This information can be viewed and tracked in your corporate user account within the CDP Response Dashboard.
Part B – Investor Signatories.
8.5. You agree that where one of your Requesting Authorities is an Investor Signatory, as soon as your ‘non-public’ Response is received:
(i) CDP may make your Response available to Investor Signatories (and their Affiliates);
(ii) your Response may be made available via Bloomberg terminals to Investor Signatories (and their Affiliates);
(iii) your Response may be made available via other secure third party platforms to Investor Signatories (and their Affiliates); and
(iv) CDP may list the Responding Company on the CDP website or otherwise make it known that the Responding Company has responded to our Questionnaire.
Part C - Net Zero Asset Managers initiative and the RE100 initiative.
8.6. You agree that where one of your Requesting Authorities is the Net Zero Asset Managers initiative, and/or the RE100 initiative, as soon as your ‘non-public’ Response is received, CDP may make your Response available to the Net Zero Asset Managers initiative and/or the RE100 initiative.
8.7. You agree that where one of your Requesting Authorities is the RE100 initiative, as soon as your ‘non-public’ Response is received:
(i) CDP may use your Response to calculate the Responding Company’s reported and verified share of renewable electricity consumption, which you further agree may be made public by CDP and/or the RE100 initiative;
(ii) CDP may publish the name of the Responding Company, your location of headquarters, your RE100 targets, and any interim targets provided as part of your Response; and
(iii) CDP may publish in combination with renewable electricity consumption data contained in your Response, the historical percentage (%) of renewable electricity consumption of the Responding Company contained in any previous years’ CDP RE100 report, to the extent that said report contains renewable electricity consumption data of the Responding Company.
8.8. You agree that where one of your Requesting Authorities is the RE100 initiative, as soon as your ‘non-public’ Response is received we may make information you submit in Response to questions C0.2, C0.3, C0.5, C4.2a, C4.3b, C8.2a, C8.2d, C8.2g, C8.2h, C8.2j, C8.2k, C8.2l, C8.2m, C10.1a, C10.1b, C12.1a, and C12.2a (relating to the RE100 initiative), available to each of your Requesting Authorities for any use within their organization (including their Affiliates in the case of Investor Signatories, Supply Chain Members and Bank Program Members) but not for publication unless the data contained in your Response has been anonymized (or aggregated in such manner that it has the effect of being anonymized).
Part D - CDP Affiliates and other recipients.
8.9. You agree that as soon as your ‘non-public’ Response is received, CDP may make your Response available to:
(a) CDP Affiliates;
(b) country partners;
(c) research partners;
(d) report writers; and
(e) scoring partners,
for:
(i) scoring your Response; and
(ii) any other use within their organizations.
9.SUPPLY CHAIN MODULE (2023 CLIMATE CHANGE)
9.1. This Section 9 solely applies to the extent that your Response includes answers to the Supply Chain Module (2023 Climate Change).
9.2. Please note that all parts of your Response to Supply Chain Module (2023 Climate Change) will be treated as ‘non-public’ irrespective of whether you selected the ‘public’ or ‘non-public’ option for your Response. For the avoidance of doubt, you have the option to respond to the Supply Chain Module (2023 Climate Change) as part of either a ‘public’ or a ‘non-public’ Response, but the Supply Chain Module (2023 Climate Change) answers within your Response will be ‘non-public’ by default.
9.3. Notwithstanding Section 9.2 above, you acknowledge and agree that:
(a) some questions in the Supply Chain Module (2023 Climate Change) require you to select a Supply Chain Member using a drop-down menu. Only the Supply Chain Member (and its Affiliates) that you select for each row will have access to the information in that part of your Response; and
(b) all information you submit in the Supply Chain Module (2023 Climate Change) will be accessible to:
(i) CDP Affiliates;
(ii) country partners;
(iii) research partners;
(iv) report writers; and
(v) scoring partners,
all of which are obliged to keep such information confidential.
10. ‘REOPENING’ AND ‘AMENDING’ YOUR RESPONSE
10.1. You may ‘reopen’ a Response that you have submitted for correction by you (a “Reopened Response”), provided that you do so before the Deadline. When you reopen a Response any submission that is in progress, or that has already been submitted, will automatically become void. If you reopen a Response, you must ensure that a Reopened Response is submitted before the Deadline to be eligible for scoring. To reopen a Response, you must notify us that you wish to do so by 13 July 2023, and you must submit a Reopened Response by the Deadline to be eligible for scoring.
10.2. If you choose not to submit a Reopened Response before the Final Closure Date, your original Response will be stored within our Online Response System, but no further processing will be undertaken, CDP will not use it in any manner prescribed for valid on-time Responses pursuant to these terms, and your Response will no longer be made available to your Requesting Authorities (or any other third parties).
10.3. Our process for ‘amending’ your Response differs from our process for reopening your Response. Amending your Response may be actioned by CDP staff on your behalf, with the decision to do so being at CDP’s absolute discretion, and furthermore, we may charge a fee for making amendments to your Response (an “Amended Response”).
10.4. We are under no obligation to accept your request for, or to provide you with an option to submit an Amended Response, but in the event that we choose to do so:
(i) amendments to your Response will be made no earlier than 5 October 2023;
(ii) the final date for requesting that CDP make amendments to your Response is 30 November 2023; and
(iii) any amendments requested to be made to a submitted Response from 14 July 2023 may not be reflected in any score, report, data product or other analysis.
10.5. We cannot commit to consideration of amending your Response if the Scoring Special Provisions described in Section 11 apply to you. In the event that the Scoring Special Provisions apply to you, and you wish for us to amend your Response, please contact our Help Center: https://help.cdp.net/ for more information about amending your Response.
11. SCORING SPECIAL PROVISIONS
11.1. Where you are headquartered or operate in Ukraine and do not submit a Response, we will not attribute any score to your Response and will recognise a pause in reporting where appropriate. Where you are headquartered in Belarus or the Russian Federation, your Response will not be eligible for scoring.
12. SCORING THE MINIMUM AND THE FULL VERSION
12.1. Scoring your Response to the Minimum Version. Responses to the Minimum Version will only be scored in certain circumstances. Please contact your local CDP office for further information.
12.2. Scoring your Response to the Full Version. Save in the case where Scoring Special Provisions apply, if you submit your Response to the Full Version in English (or the applicable language for your location set out below):
(i) by the Deadline: CDP will score your Response;
(ii) after the Deadline but on or before 9 August 2023: you can request an ‘on-demand’ score for a fee. Only a limited number of on-demand scores are available in 2023, so your request may not be granted. Please contact your local CDP office for more information about on-demand scoring.
12.3. Scoring non-English language Responses. CDP recommends that wherever possible you respond in English. This is to facilitate the broadest applicability, usages, and utility of your Response. Please contact your local CDP office for information about scoring if you intend to submit your Response in any language other than English. The following languages may be used to submit your Response to the Full Version of the Questionnaire: Chinese (if you are located in China); Japanese (if you are located in Japan); Portuguese (if you are located in Brazil); or Spanish (if you are located in any country in Latin America except for Brazil).
13. PUBLICATION AND USE OF SCORES
13.1. If you are not responding to a CDP climate change questionnaire for the first time, CDP may publish your score, and use, and make it available for all purposes that we decide (whether for a fee or otherwise).
13.2. If your Response is the first CDP climate change questionnaire you are submitting, you may choose for your score to be ‘private,’ in which case CDP will not publish your score. If you do not actively elect for your score to be ‘private’, CDP shall be entitled to publish your score.
13.3. If you request the ‘private’ option in relation to your score (irrespective of whether your Response is submitted as ‘non-public’ or ‘public’), and you do not achieve an A grade, we may only make it available to:
(i) any Supply Chain Member or Bank Program Member that is a Requesting Authority for your Response;
(ii) CDP Affiliates;
(iii) country partners;
(iv) research partners;
(v) report writers and scoring partners,
in each case for any use within their organizations. We will not make it available to Investor Signatories.
13.4. If your Response is answered using the ‘private’ score option, and you achieve an A grade, we may only make it available to Investor Signatories, and the organizations listed above in Section 13.3.
13.5. If you are a Financial Services Responding Company responding to the forests and water security questions contained in the Questionnaire, your forests score will automatically be ‘private,’ but we reserve the right to make your forests score available to:
(i) CDP Affiliates;
(ii) country partners;
(iii) research partners;
(iv) report writers; and
(v) scoring partners,
in each case for any use within their organizations and not for external publication. We will not make your score for forests available to your Requesting Authorities. For clarity, the water security related questions will not be scored.
14. FUTURE QUESTIONNAIRES
14.1. Your submission of a Response for the current year also constitutes the grant of consent for CDP to invite you (and to remind you) to respond in future years but you acknowledge that any future responses will be made upon the then current version of these terms which you will need to accept at that time in order to submit a response.
15. FEE
15.1. Why we charge a Fee. We are a not-for-profit organization and charge certain companies an annual administrative fee to enable us to maintain our Online Response System. Unless the Responding Company is exempt from paying the Fee, as set out below, or the Responding Company is listed, incorporated or headquartered in a country/region that is listed in Section 15.2, the Fee (plus any applicable taxes) is payable to CDP (or the Billing Company, as applicable). The Fee is payable once, regardless of how many responses to questionnaires relating to forests and/or water security, and/or public authorities the Responding Company submits in 2023 in addition to the Questionnaire.
15.2. Countries/regions where the Fee applies. A Responding Company will be required to pay the Fee to the Billing Company unless it is listed, incorporated or headquartered in one of the following countries: Albania, Belarus, Bulgaria, Croatia, the Czech Republic, Estonia, Hungary, Latvia, Lithuania, Poland, Romania, Russia, the Slovak Republic, Slovenia and Ukraine.
15.3. Exemptions from the Fee. A Responding Company may be eligible for exemption from paying the Fee if:
(a) the Responding Company is listed, incorporated, or headquartered outside of Europe and North America and the Responding Company has not submitted a Response to CDP in the last three years; or
(b) the Responding Company does not have any Investor Signatories as a Requesting Authority.
15.4. Payment of the Fee. You must pay the Fee to CDP or the Billing Company (as applicable) by credit or debit card, or request an invoice via the CDP Response Dashboard, which must be paid within such time as set out in the invoice. Please note that you will not be able to submit your Response unless you have paid the Fee, you have requested an invoice, or you are exempt from paying the Fee.
15.5. CDP’s discretion regarding Fees. Please note that CDP reserves the right to decide (at its sole discretion) whether the Fee is payable or not, and we will notify you before you submit your Response whether you are exempt (via communications made through the CDP Response Dashboard and/or email).
16. RIGHTS IN THE RESPONSES
16.1. Ownership. All intellectual property rights in your Response will be owned by you (and your licensors).
16.2. License. You grant to CDP, or shall procure the grant to us, of a perpetual, irrevocable, non-exclusive, assignable, sub-licensable, royalty-free and worldwide license to use your Response and any intellectual property rights including copyright and database rights in your Response for the uses set out in these terms.
17. LIABILITY
17.1. We do not exclude or limit in any way our liability to you where it would be unlawful to do so. This includes liability for death or personal injury caused by our negligence or the negligence of our employees, agents or subcontractors, or for fraud or fraudulent misrepresentation.
17.2. We are not liable for financial losses. Neither CDP nor the Billing Company have any liability to you in any circumstances whatsoever for any loss of revenue, loss of profit, loss of business, business interruption, loss of business opportunity, loss of goodwill, loss of reputation, loss of, damage to or corruption of data, or software.
17.3. We are not liable for consequential losses. Neither CDP nor the Billing Company have any liability to you in any circumstances whatsoever for any indirect or consequential loss or damage of any nature whatsoever.
17.4. Exclusion of liability. Neither CDP nor the Billing Company have liability to you in any circumstances howsoever arising from the content or submission of your Response to us, our use of your Response, or your score and/or the use of or any reliance placed upon your Response or your score by you or by any third parties (including any Requesting Authorities).
18. DATA PROTECTION
18.1. Each party acknowledges that CDP may process Personal Data provided to it by or on behalf of the Responding Company, including Personal Data of corporate users of the CDP Response Dashboard, and other contacts. CDP will only process such Personal Data for purposes related to its business relationship with the Responding Company (for example, sending communications to the Responding Company encouraging completion of the Questionnaire). CDP may also share Personal Data with Supply Chain Members and Bank Program Members to enable them to send communications to Responding Companies encouraging completion of the Questionnaire.
18.2. You shall ensure that any relevant data subjects receive a fair processing notice which includes the above information and includes a reference to CDP’s privacy notice available at https://www.cdp.net/en/info/privacy-policy and shall otherwise ensure that CDP is able to process all Personal Data provided to it by or on behalf of the Responding Company for the above purposes in compliance with applicable data protection legislation including the Data Protection Act 2018 as amended by the Data Protection, Privacy and Electronic Communications (Amendments etc.) (EU Exit) Regulations 2019 which merge the previous requirements of that Act with the requirements of the General Data Protection Regulation ((EU) 2016/679) (“UK GDPR”).
19. GENERAL
19.1. We may assign our rights to someone else. We may transfer our rights and obligations under these terms to another organization.
19.2. Nobody else has any rights under these terms. These terms are between you and us (and the Billing Company, where the Billing Company is not CDP). The Billing Company may enforce these terms for its own benefit but otherwise no other person shall have any rights to enforce any of its terms.
19.3. Entire agreement. These terms constitute the entire agreement between you and us in relation to your Response to the CDP Climate Change Questionnaire 2023.
19.4. Variation. CDP reserves the right to change these terms at any time. The consent of the Billing Company is not needed, and any such changes shall be effective immediately or such other time as CDP elects. If you do not agree to the updated terms, you may request to withdraw your Response within 30 days of us notifying you of the update.
19.5. If a court finds part of these terms illegal, the remainder will continue in full force and effect. Each of the Sections of these terms operates separately. If any court or relevant authority decides that any of them are unlawful, the remaining Sections will remain in full force and effect.
19.6. Governing law and jurisdiction. These terms are governed by English law and both the Responding Company and CDP submit to the exclusive jurisdiction of the English courts to resolve any dispute or claim arising out of or in connection with these terms, their subject matter or formation.
19.7. Language. In the event of any inconsistency or ambiguity if these terms are translated into any language other than English, the English language version will prevail in relation to interpretation.
20.BILLING COMPANY
| Billing Company
|
Location of Responding Company
|
|
CDP Worldwide
|
All countries/regions not listed elsewhere in this table
|
|
CDP Worldwide (Europe) gGmbH
|
Austria, Belgium, Denmark, Finland, France, Germany, Iceland, Italy, Luxembourg, Netherlands, Norway, Portugal, Spain, Sweden, Switzerland
|
|
CDP North America, Inc.
|
Canada, USA
|
|
Carbon Disclosure Project Latin America
|
Antigua and Barbuda, Argentina, Aruba, Bahamas, Barbados, Belize, Bolivia, Brazil, Chile, Colombia, Costa Rica, Cuba, Dominica, Dominican Republic, Ecuador, El Salvador, Grenada, Guatemala, Guyana, Haiti, Honduras, Jamaica, Mexico, Nicaragua, Panama, Paraguay, Peru, Saint Kitts and Nevis, Saint Lucia, Saint Vincent and the Grenadines, Suriname, Trinidad and Tobago, Uruguay, Venezuela
|
|
Beijing Carbon Disclosure Project Environment Consulting Co., Ltd. (北京诚度普 环境咨询有限公司)
|
China
|
|
CDP Operations India Private Limited
|
India
|
|
一般社団法人
CDP Worldwide-Japan
|
Japan
|