CDP Cities 2018 Reporting Guidance
Introduction to CDP
CDP is a global environmental impact non-profit helping investors, companies and cities assess their environmental impact and take urgent action to build a truly sustainable economy.
High quality, relevant information is the fundamental basis for action and we help investors, companies and cities to measure, understand and address their environmental impact. The world’s economy looks to CDP as the gold standard of environmental reporting with the richest and most comprehensive dataset on corporate and city action. We aim to make environmental reporting mainstream and provide the detailed insights and analysis to drive the urgent action needed for a climate safe, water secure, deforestation free world.
Introduction to CDP’s cities program
CDP offers a voluntary climate change reporting platform for city governments. The program provides the world’s first global platform for municipal governments to disclose greenhouse gas emissions, climate change risks, and mitigation and adaptation strategies. CDP collects and delivers materially relevant data for cities, the private sector, and other stakeholders.
The World’s Renewable Energy Cities is CDP Cities’ latest report, analyzing the data disclosed to CDP by over 570 cities in 2017 to show that 100 cities now get at least 70% of their electricity from renewable sources. Other recent outputs include ‘Who’s tacking urban water challenges’ which highlights how to improve water security for all, as well as ‘It takes a city: The case for collaborative climate action’ which illustrates the emerging case for collaborative climate action between cities, regions, businesses and investors.
The CDP Cities 2018 questionnaire
The CDP Cities 2018 questionnaire is composed of a series of sections. Each section asks questions about an aspect of your city including; GHG emissions, hazards and adaptation, governance, water, opportunities from climate change, strategies for mitigating emissions, and strategies for adapting to changes in the climate.
Cities are asked to respond to the Questionnaire using the Online Response System (ORS) which can be accessed through the individual activation link sent by email to users by CDP. If you are unable to respond via the ORS, please email [email protected].
This document contains extended question specific guidance which is intended to help respondents to the questionnaire to report their data with the highest degree of understanding, and has been developed in tandem with the ‘help text’ that exists within the online response system. Questions that relate to the reporting requirements of the Global Covenant of Mayors also feature extended question-specific compliance guidance.
Important information
For any technical or system enquires please contact [email protected].
This also extends to any enquires related to amendments to your response. Upon contacting [email protected] our team will place your response in ‘amendment status’ meaning that you can access the ORS post-submission to make a change. In this case the ORS will ask you about the changes to questions that you have made, so please keep a detailed track of all changes.
However, depending on the timing of an amendment, we ask cities to understand that the changes may not be reflected in CDPs outputs, such as Cities Analytics and reports, which may have already been produced based on the previously submitted figures.
Acknowledgements
CDP would like to thank the following people and organizations for their assistance in developing the CDP Cities 2018 questionnaire and guidance documents:
|
Ajani Ismail Adeleke, Ibadan |
Alessandra Elia, Naples |
|
Björn Grönholm, Union of the Baltic Cities |
Cathy Nangini & others, LSCE |
|
Cecilia Fernandez, Toronto |
Charlotte Lejop, Paris |
|
Chris Pountney, AECOM |
City of Ravenna |
|
Cristiana Scarpa, Venice |
Estefania Riberio, Brumadinho Municipality |
|
Flavia Tonioli, Miami Beach |
Georg Hafner, Zurich |
|
Helena Andersson, Gotland |
Ibrahima Djitte, Commune de Dioudoubou |
|
Inês Silva, Guimarães |
Is'haaq Akoon, City of Ekurhuleni |
|
Jaanus Tamm, Tartu |
Jairo Garcia, City of Atlanta |
|
Janet Fogg, Cambridge |
Jeff Sovich, City of Greensboro |
|
John Griffiths, Melbourne |
Jorge Cristino, Guimarães |
|
Kerina Singh, Pietermaritzburg |
Kerina Singh, Pietermaritzburg |
|
Leila Soraya Menezes, Brasília, Distrito Federal |
Maria Amor A. Salandanan, City of Santa Rosa |
|
Mary Chan, Tampico |
Melchiorina Mirella Iacono, Torino |
|
Mike Steinhoff, ICLEI-USA |
Mildreth Liliana Gonzalez Cuadros, Bucaramanga |
|
Molly Saylor, Fort Collins |
Mundhir Abdallah Mohamed, Moroni |
|
Nahuel Pugliese, Ciudad Autónoma de Buenos Aires |
Nasha, Saskatoon |
|
Nicola Luca Sgaramella, Monza |
Nicola Luca Sgaramella, Municipality of Monza |
|
Omar Salazar Paternina, Sincelejo |
Pamela Lucia Bravo Ortiz, Muncipalidad de Miraflores |
|
Paula Rezende Rios, Betim |
Rachael Schaffner, Fayetteville |
|
Salum Hamisi Kidungwe, Dar es Salaam City Council |
Shanju Xie, Auckland |
|
Sofia Widforss, WWF One Planet City |
Thomas Herrod, Denver |
|
Valquiria, Lima |
Warren Brooke, The City of Calgary |
|
Wendy Goodfriend, San Francisco |
Wild Ndipo, Blantyre |
Introduction
Introduction
0.1 Please give a general description and introduction to your city including your city’s reporting boundary in the table below.
Response Options
Please complete the following table:
| Administrative boundary | Description of city |
|---|---|
| Select from:
| Text field |
Question 0.1 is required for the Global Covenant of Mayors.
0.2 If you have not previously submitted a Letter of Commitment to the Global Covenant of Mayors, please attach your Letter of Commitment here, signed by an appropriately mandated official (e.g. Mayor, City Council). Please click here to download the template of the Letter of Commitment.
Response Options
Please attach the relevant document here.
Question 0.2 is required for the Global Covenant of Mayors.
GCoM Compliance Requirements
To join the Global Covenant of Mayors initiative, please visit the Global Covenant website and download the Letter of Commitment template. Once the mayor, or equivalent legal representative authority, has signed the letter of commitment, the city is asked to comply with a series of requirements over a timeframe of three years.
Cities whose commitments have already been acknowledged by the Global Covenant do not need to reattach their letter.
City Details
0.3 Please provide information about your city’s Mayor or equivalent legal representative authority in the table below.
Response Options
Please complete the following table:
| Leader title | Leader name | Current term start year | Current term end year | Total time in office (years) |
|---|---|---|---|---|
| Text field | Text field | Numerical field | Numerical field | Numerical field |
Question 0.3 is required for the Global Covenant of Mayors.
0.4 Please select the currency used for all financial information disclosed throughout your response.
Response Options
Select from Appendix A.
Question 0.4 is required for the Global Covenant of Mayors.
0.5 Please provide details of your city's annual operating budget, in the currency reported in question 0.4.
Response Options
Please complete the following table:
| Annual operating budget | Budget year start | Budget year end |
|---|---|---|
| Numerical field | Drop-down calendar: From | Drop-down calendar: To |
Question 0.5 is required for the Global Covenant of Mayors.
0.6 Please provide details of your city’s current and projected population.
Response Options
Please complete the following table:
| Current population | Current population year | Projected population | Projected population year |
|---|---|---|---|
| Numerical field | Numerical field | Numerical field | Numerical field |
Question 0.6 is required for the Global Covenant of Mayors.
0.7 Please provide details of your city’s GDP in the currency reported in question 0.4.
Response Options
Please complete the following table:
| GDP | Year of GDP | Source |
|---|---|---|
|
Numerical field |
Numerical field |
Text field |
Question 0.7 is required for the Global Covenant of Mayors.
0.8 Please provide further details about the geography of your city.
Response Options
Please complete the following table:
| Average annual temperature (in Celsius) | Land area (in square km) | Average altitude (m) | Longitude (e.g. -120.9762) | Latitude (e.g. 41.25) |
|---|---|---|---|---|
| Numerical field | Numerical field | Numerical field | Numerical field | Numerical field |
Question 0.8 is required for the Global Covenant of Mayors.
Governance & Data Management
Governance
1.0 Please describe the impact of national and/or regional climate change activities on your city’s own climate change activities.
Response Options
This is an open text question.
Please note that when copying from another document into the disclosure platform, formatting is not retained.
1.1 Please describe how your city manages overall responsibility for climate change mitigation (emissions reduction) and adaptation (climate risk reduction).
Response Options
This is an open text question.
Please note that when copying from another document into the disclosure platform, formatting is not retained.
1.2 Please describe the administrative structure of your government.
Response Options
Please complete the following table:
| Administrative structure | Description of administrative structure |
|---|---|
|
Select from:
|
Text field |
Question 1.2 is required for the Global Covenant of Mayors.
1.3 Please provide details on your city’s annual revenue sources.
Response Options
Please complete the following table:
| Revenue source | Percentage of annual revenue |
|---|---|
| National / central government | Percentage field |
| Regional / state / provincial government | Percentage field |
| Local taxes | Percentage field |
| Levies and fees | Percentage field |
| Operational revenues | Percentage field |
| Other: please specify | Percentage field |
Question 1.3 is required for the Global Covenant of Mayors.
1.4 Does your city incorporate sustainability goals and targets (e.g. GHG reductions) into the master planning for the city?
Response Options
Select one of the following options:
- Yes
- No
- In progress
- Intending to undertake in future
- Not intending to undertake
- Do not know
If Yes is selected in response to 1.4:
1.4a Please detail which goals and targets are incorporated in your city’s master plan and describe how these goals are addressed in the table below.
Response Options
Please complete the following table. You are able to add rows by using the “Add Row” button at the bottom of the table.
| Goal type | How are these goals/targets addressed in the city master plan? |
|---|---|
| Select from:
| Text field |
[Add Row]
Data Management
1.5 Does the Mayor have a statutory duty (legal responsibility) to reduce greenhouse gases?
Response Options
Select one of the following options:
- Yes, driven by the regional level
- Yes, driven by the national level
- Yes, driven by the city
- No
- Do not know
Guidance
Indicate whether there is, and at what level, a formal enactment of legislative authority that requires that your Mayor is responsible for reductions of greenhouse gas emissions within your city.
1.6 How many staff (FTE) work on topics related to climate change mitigation and adaptation?
Response Options
Please complete the following table:
| Mitigation | Adaptation |
|---|---|
| Numerical field | Numerical field |
Guidance
Indicate the number of resources within your city government allocated to climate change mitigation (either reducing the sources of greenhouse gases or enhancing "sinks" to accumulate and store gasses) and climate change adaptation (adjusting to actual or expected future climate).
1.7 How many staff (FTE) does your city have for environmental related data management? (including collecting, storing, analysing and communicating).
Response Options
Numerical field.
Guidance
Indicate how many staff members (or full time equivalent) are employed to manage and curate the data generated within your team for specific projects or ongoing programmes.
1.8 How would you characterize the data management of your city and department?
Response Options
Please complete the following table:
| City | Department |
|---|---|
| Select from:
| Select from:
|
Guidance
Indicate the level in which your department manages, governs, uses and controls data and information as an asset.
1.9 What tools does your city / department use to manage its environmental related data?
Response Options
Select all that apply:
- Microsoft excel
- Enterprise (packaged) software
- Custom designed software
- Other: please specify
Guidance
This question asks about what software your city / department uses to manage environmental related data. Data management refers to the collection, processing, analysis, storage and communication of data.
1.10 What tools does your city / department use to analyse its environmental related data?
Response Options
Select all that apply:
- Microsoft excel
- Statistical Software - SPSS, SAS, etc.
- Visualization/Analysis Software - Tableau, Qlik, etc
- We do not analyse our environmental data
Guidance
This question aims to understand the software tools used by your city / department to analyse environmental related data. Data analysis refers to the research, organisation and manipulation of data in a way that brings about useful information.
1.11 Does your city have a team dedicated to data analysis (e.g., data analytics staff, performance management staff, evaluation staff, chief data officer, etc.)?
Response Options
Select one of the following options:
- The city does not have a team dedicated to data analysis
- The city has a team dedicated to data analysis that supports some departments, but our engagement with them is limited
- The city has a team dedicated to data analysis city-wide
1.12 Has your city's Mayor or equivalent legal authority communicated their commitment to governing with data publicly to city residents (e.g., through public remarks, press releases, etc.)?
Response Options
Select one of the following options:
- Yes
- No
- Do not know
Hazards and Adaptation
Climate Hazards
2.0 Has a climate change risk or vulnerability assessment been undertaken for your local government area?
Response Options
Select one of the following options:
Question 2.0 is required for the Global Covenant of Mayors.
GCoM Compliance Requirements
All cities are required to conduct and publish a city-wide risk and/or vulnerability assessment within two years of committing to the Global Covenant of Mayors. The risk or vulnerability assessment does not have a specific time frame requirement, but it must cover the whole city boundary and it must consider both current and future climate conditions. Assessments that cover areas larger than the city boundary must specifically refer to hazards that impact or will impact the city to be considered compliant.
A climate change risk assessment is a qualitative and/or quantitative scientific estimation of risks caused by climate change. Climate change risks are usually defined as the potential for consequences where something of human value (including humans themselves) is at stake and where the outcomes is uncertain. Climate risk is often represented as the probability of occurrence of hazardous climate events or trends multiplied by the consequence of these events occurring.
A climate change vulnerability assessment is a qualitative and/or quantitative assessment of the degree to which a system is susceptible to, or unable to cope with, adverse effects of climate change, including climate variability and extremes. Vulnerability is a function of the character, magnitude, and rate of climate variation to which a system is exposed, its sensitivity, and its adaptive capacity.
If Yes or In progress is selected in response to 2.0:
2.0a Please select the primary process or methodology used to undertake the risk or vulnerability assessment of your city.
Response Options
Please complete the following table:
| Primary methodology | Description |
|---|---|
| Select from:
| Text field |
If Yes is selected in response to 2.0:
2.0b Please attach and provide details on your climate change risk or vulnerability assessment. Please provide details on the boundary of your assessment, and where this differs from your city’s boundary, please provide an explanation.
Response Options
Please complete the following table. You are able to add rows by using the “Add Row” button at the bottom of the table.
| Publication title | Year of publication | Attach the document | Web link | Boundary of assessment relative to city boundary (reported in 0.1) | Explanation of boundary choice | Primary author of assessment | Does the assessment identify vulnerable populations? |
|---|---|---|---|---|---|---|---|
|
Text field |
Numerical field |
Attach your document here. |
Text field |
Select from:
|
Text field |
Select from:
|
Select from:
|
[Add Row]
Question 2.0b is required for the Global Covenant of Mayors.
GCoM Compliance Requirements
Please refer to the compliance requirements regarding vulnerability assessments outlined in question 2.0.
If Yes is selected in response to 2.0:
2.0c Please describe how your city’s risk or vulnerability assessment addresses the following key requirements as defined by the Global Covenant, and provide details on the location of this evidence within your assessment.
Response Options
Please complete the following table:
| GCoM key requirements | Proof statement from within your risk or vulnerability assessment (in English) | Page number(s) | Publication title of your risk or vulnerability assessment |
|---|---|---|---|
| Assessment of impact of current hazards | Text field | Text field | Text field |
| Assessment of impact of future hazards | Text field | Text field | Text field |
Question 2.0c is required for the Global Covenant of Mayors.
GCoM Compliance Requirements
Please provide at least one statement demonstrating evidence for each key requirement from within your vulnerability or risk assessment. Please also provide the page number(s) that this statement can be found on, and the title of the vulnerability or risk assessment you are referring to. If your vulnerability or risk assessment is not in English, please ensure that the proof statements are translated to English.
If Yes is selected in response to 2.0:
2.1 Does your city have an update / revision process for the climate risk or vulnerability assessment?
Response Options
Select one of the following options:
- Yes
- No
- Do not know
Question 2.1 is required for the Global Covenant of Mayors.
If Yes is selected in response to 2.1:
2.1a Please provide more details on the update / revision process for your city’s climate risk or vulnerability assessment.
Response Options
Please complete the following table:
| Time period for update (years) | Status of current update | Number of times previously updated | Comment |
|---|---|---|---|
| Numerical field | Select from:
| Numerical field | Text field |
Question 2.1a is required for the Global Covenant of Mayors.
2.2 Do the current and/or anticipated effects of climate change present risks to your city at present or in the future?
Response Options
Select one of the following options:
- Yes
- No
- Do not know
Question 2.2 is required for the Global Covenant of Mayors.
GCoM Compliance Requirements
All cities are asked to report on both the current and future climate hazards that they face within their city boundary. To meet compliance, please select ‘Yes’ and report the hazards your city currently faces and expects to face in the future in question 2.2a.
If Yes or Do not know is selected in response to 2.2:
2.2a Please list the most significant climate hazards faced by your city and indicate the probability and consequence of these hazards, as well as the expected future change in frequency and intensity. Please also select the top 3 assets or services that are affected by the climate hazard, and provide a description of the impact.
Response Options
Please complete the following table. The table is displayed over several rows for readability. You are able to add rows by using the “Add Row” button at the bottom of the table.
| Climate Hazards | Hazard status | Magnitude of impact | Anticipated timescale | Probability of hazard | Consequence of hazard |
|---|---|---|---|---|---|
| See drop-down options below |
Select from:
|
Select from:
|
Select from:
|
Select from:
|
Select from:
|
| Future change in frequency | Future change in intensity | Top three assets/ services affected | Impact description |
|---|---|---|---|
Select from:
| Select from:
| Select top 3 from:
| Text field |
[Add Row]
Climate Hazards drop-down options:
Select all that apply:
- Rain storm
- Monsoon
- Heavy snow
- Hail
- Severe wind
- Tornado
- Cyclone (Hurricane/Typhoon)
- Extratropical storm
- Tropical storm
- Lightning / thunderstorm
- Fog
- Extreme winter conditions
- Cold wave
- Extreme cold days
- Heat wave
- Extreme hot days
- Drought
- Forest fire
- Land fire
- Flash/surface flood
- River flood
- Coastal flood
- Groundwater flood
- Storm surge
- Permanent inundation
- Salt water intrusion
- Ocean acidification
- Atmospheric CO2 concentrations
- Landslide
- Avalanche
- Rockfall
- Subsidence
- Water-borne disease
- Vector-borne disease
- Air-borne disease
- Insect infestation
Question 2.2a is required for the Global Covenant of Mayors.
GCoM Compliance Requirements
All cities are asked to report on both the current and future climate hazards that they face within their city boundary. To meet compliance, please report the hazards your city currently faces and expects to face in the future.
If No is selected in response to 2.2:
2.2b Please explain why the anticipated effects of climate change present no risk to your city at present or in the future.
Response Options
Please complete the following table:
| Reason | Explanation |
|---|---|
| Select from:
| Text field |
2.3 Do you consider that the effects of climate change could negatively impact the ability of businesses to operate successfully in your city?
Response Options
Please complete the following table:
| Response | Explanation |
|---|---|
| Select from:
| Text field |
2.4 Please identify the factors that most greatly affect your city’s ability to adapt to climate change, and indicate how those factors either enhance or challenge this ability.
Response Options
Please complete the following table. You are able to add rows by using the “Add Row” button at the bottom of the table.
| Factors that affect ability to adapt | Enhance/ Challenge | Description |
|---|---|---|
|
Select from:
|
Select from:
|
Text field |
Question 2.4 is required for the Global Covenant of Mayors.
Adaptation
3.0 Has the Mayor or city council committed to adapting to climate change across the geographical area of the city, town or settlement?
Response Options
Select one of the following options:
- Yes
- No
- In progress
- Intending to undertake in future
- Not intending to undertake
- Do not know
Question 3.0 is required for the Global Covenant of Mayors.
If Yes is selected in response to 3.0:
3.0a Please select the type of commitment and attach evidence.
Response Options
Please complete the following table. You are able to add rows by using the “Add Row” button at the bottom of the table.
| Type of commitment | Attach | Comments |
|---|---|---|
| Select from:
| Attach your document here. | Text field |
[Add Row]
Question 3.0a is required for the Global Covenant of Mayors.
3.1 Has your city council published a plan that addresses climate change adaptation?
Response Options
Select one of the following options:
- Yes
- No
- In progress
- Intending to undertake in future
- Not intending to undertake
- Do not know
Question 3.1 is required for the Global Covenant of Mayors.
GCoM Compliance Requirements
All cities must publish a city-wide climate adaptation plan within three years of committing to the Global Covenant of Mayors. The climate adaptation plan must cover the whole city boundary and does not have a specific timeframe requirement. Adaptation plans that cover a boundary larger than the city (e.g. at regional or national levels) are not considered compliant.
The city-wide climate adaptation plan must include the requirements detailed below.
- Political commitment to adaptation: Clear political commitment from the Mayor, equivalent legal representative authority, or city council.
- Identification of adaptation actions: Identification of adaptation actions and explanation of how they will be implemented.
To meet compliance, please report an adaptation plan in questions 3.1 and 3.1a and describe the main goals of your city’s adaptation efforts along with the metrics/KPIs for each goal in question 3.4.
- Engagement of multiple city government agencies or departments: Evidence that multiple city departments were involved or consulted in the development of the plan. It might, for instance, mention cross-departmental group in the process description, a clear allocation of tasks to a variety of sections of the city government, or endorsement by a number of department heads.
To meet compliance, please provide evidence that your city engages with stakeholders about adaptation planning in question 3.7.
- Process for regular review of the plan: Process for updating the plan either at regular periods (e.g. every 5 years) or as new information becomes available (e.g. updated climate change projections).
To meet compliance, please report a sound revision process for your adaptation plan in questions 3.2 and 3.2a.
If Yes or In progress is selected in response to 3.1:
3.1a Please provide more information on your plan that addresses climate change adaptation and attach the document. Please provide details on the boundary of your plan, and where this differs from your city’s boundary, please provide an explanation.
Response Options
Please complete the following table. You are able to add rows by using the “Add Row” button at the bottom of the table.
| Publication title | Year of publication | Attach the document | Web link | Boundary of plan relative to city boundary (reported in 0.1) | Explanation of boundary choice | Primary author of plan | Stage of implementation |
|---|---|---|---|---|---|---|---|
| Text field | Numerical field | Attach your document here. | Text field | Select from:
| Text field | Select from:
| Select from:
|
[Add Row]
Question 3.1a is required for the Global Covenant of Mayors.
GCoM Compliance Requirements
Please refer to the compliance requirements regarding the adaptation plan outlined in question 3.1.
If No or Not intending to undertake is selected in response to 3.1:
3.1b Please explain why not and any future arrangements you have to create a plan.
Response Options
Please complete the following table:
| Reason | Comment |
|---|---|
| Select from:
| Text field |
If Yes is selected in response to 3.1:
3.2 Does your city have an update / revision process for the climate adaptation plan(s)?
Response Options
Select one of the following options:
- Yes
- No
- Do not know
Question 3.2 is required for the Global Covenant of Mayors.
GCoM Compliance Requirements
For your adaptation plan to meet compliance, please select ‘Yes’ and report a sound revision process for your adaptation plan. For further information, please refer to the compliance requirements regarding adaptation plan outlined in question 3.1.
If Yes is selected in response to 3.2:
3.2a Please provide more details on the update / revision process for your city’s climate adaptation plan(s)?
Response Options
Please complete the following table:
| Time period for update (years) | Status of current update | Number of times previously updated | Comment |
|---|---|---|---|
| Numerical field | Select from:
| Numerical field | Text field |
Question 3.2a is required for the Global Covenant of Mayors.
GCoM Compliance Requirements
For your adaptation plan to meet compliance, please report a sound revision process for your adaptation plan. For further information, please refer to the compliance requirements regarding adaptation plan outlined in question 3.1.
If Yes is selected in response to 2.2:
3.3 Please describe the actions you are taking to reduce the risk to, or vulnerability of, your city’s infrastructure, services, citizens, and businesses from climate change as identified in the Climate Hazards section.
Response Options
Please complete the following table. You are able to add rows by using the “Add Row” button at the bottom of the table.
| Climate hazards | Action | Status of action | Action description |
|---|---|---|---|
| Drop-down populated with selections from 2.2a column 1 | Select from Appendix B | Select from:
| Text field |
[Add Row]
If Yes is selected in response to 3.1:
3.4 Please describe the main goals of your city’s adaptation efforts and the metrics / KPIs for each goal.
Response Options
Please complete the following table. You are able to add rows by using the “Add Row” button at the bottom of the table.
| Adaptation goal | Target year | Metrics / KPIs | Source of goal |
|---|---|---|---|
| Text field | Numerical field | Text field | Select from:
|
Question 3.4 is required for the Global Covenant of Mayors.
GCoM Compliance Requirements
For your adaptation plan to meet compliance, please describe the main goals of your city’s adaptation efforts along with the metrics/KPIs for each goal. For further information, please refer to the compliance requirements regarding adaptation plan outlined in question 3.1.
If Yes is selected in response to 3.1:
3.5 Please describe the process for how your city has identified and assessed specific adaptation actions. Select all that apply and provide a description of each action assessment method.
Response Options
Please complete the following table. You are able to add rows by using the “Add Row” button at the bottom of the table.
| Method of action selection/prioritization | Description of action assessment |
|---|---|
| Select from:
| Text field |
Question 3.5 is required for the Global Covenant of Mayors.
If Yes is selected in response to 3.1:
3.6 Please describe how much your adaptation actions will address the underlying factors that challenge your city’s ability to adapt.
Response Options
Please complete the following table.
| Underlying factors | Extent addressed | Description of approach |
|---|---|---|
|
Populated from 2.4 column 1 selections |
Select from:
|
Text field |
[Add Row]
Question 3.6 is required for the Global Covenant of Mayors.
3.7 Please describe your progress in engaging stakeholders for adaptation planning.
Response Options
Please complete the following table:
| Do you have a plan for stakeholder engagement? | Implementation of stakeholder engagement plan | Describe stakeholder engagement process |
|---|---|---|
| Select from:
| Select from:
| Text field |
Question 3.7 is required for the Global Covenant of Mayors.
GCoM Compliance Requirements
For your adaptation plan to meet compliance, please provide evidence that your city engages with stakeholders about adaptation planning. For further information, please refer to the compliance requirements regarding adaptation plan outlined in question 3.1.
If Yes is selected in response to 3.1:
3.8 Please describe any additional barriers your city has encountered in implementing your adaptation planning or adaptation actions, and any solutions or interventions taken to overcome those barriers.
Response Options
Please complete the following table. You are able to add rows by using the “Add Row” button at the bottom of the table.
| Barriers to adaptation | Description of barriers to adaptation | Description of solution / intervention | Additional adaptation resource needs |
|---|---|---|---|
| Select from:
| Text field | Text field | Text field |
Question 3.8 is required for the Global Covenant of Mayors.
If Yes is selected in response to 3.1:
3.9 Please identify any additional benefits or improvements resulting from adaptation planning and/or adaptation actions (in addition to the reduction of climate risks).
Response Options
Please complete the following table. You are able to add rows by using the “Add Row” button at the bottom of the table.
| Additional benefits or improvements | Description of benefit or improvement |
|---|---|
| Select from:
| Text field |
Question 3.9 is required for the Global Covenant of Mayors.
4.0 Does your city face any social risks as a result of climate change?
Response Options
Select one of the following options:
- Yes
- No
- Do not know
If Yes or Do not know is selected in response to 4.0:
4.0a Please complete the table below to indicate which social risks your city faces as a result of climate change and indicate if these risks have been covered by your city’s action plan.
Response Options
Please complete the following table. You are able to add rows by using the “Add Row” button at the bottom of the table.
| Social risks | Anticipated timescale in years | Impact description |
|---|---|---|
| Select from:
| Select from:
| Text field |
[Add Row]
If No is selected in response to 4.0:
4.0b Please explain why not.
Response Options
Please complete the following table:
| Reasoning | Explanation |
|---|---|
| Select from:
| Text field |
Opportunities
Opportunities
5.0 Does addressing climate change provide any opportunities for your city?
Response Options
Select one of the following options:
- Yes
- No
- Do not know
If Yes or Do not know is selected in response to 5.0:
5.0a Please indicate the opportunities and describe how the city is positioning itself to take advantage of them.
Response Options
Please complete the following table. You are able to add rows by using the “Add Row” button at the bottom of the table.
| Opportunity | Describe how the city is maximizing this opportunity |
|---|---|
|
Select from:
|
Text field |
[Add Row]
If No is selected in response to 5.0:
5.0b Why do you not foresee any opportunities for your city?
Response Options
Please complete the following table:
| Reason | Comment |
|---|---|
| Select from:
| Text field |
5.1 Does your city collaborate in voluntary partnership with businesses in your city on sustainability projects?
Response Options
Select one of the following options:
- Yes
- No
- In progress
- Intending to undertake in future
- Not intending to undertake
- Do not know
If Yes is selected in response to 5.1:
5.1a Please provide some key examples of how your city collaborates with business in the table below.
Response Options
Please complete the following table. You are able to add rows by using the “Add Row” button at the bottom of the table.
| Collaboration area | Description of collaboration |
|---|---|
| Select from:
| Text field |
5.2 List any emission reduction, adaptation, water related or resilience projects you have planned within your city for which you hope to attract financing, and provide details on the estimated costs and status of the project. If your city does not have any relevant projects, please select No relevant projects under Project Area.
Response Options
Please complete the following table. You are able to add rows by using the “Add Row” button at the bottom of the table.
| Project area | Status of project | Status of financing | Project description | Total cost of project | Total investment cost needed (if relevant) |
|---|---|---|---|---|---|
| Select from:
| Select from:
| Select from:
| Text field | Numerical field | Numerical field |
Finance & Economic Opportunities
5.3 Has your City received/secured funding for any low carbon projects (e.g. energy efficiency, renewable energy, low emission vehicles, bus rapid transit, waste management) or climate adaptation projects from a development bank (e.g. World Bank, Asian Development Bank, etc.)?
Response Options
Select one of the following options:
- Yes
- No
- Do not know
5.4 Has your City established a fund to invest in energy efficiency, renewable energy or carbon reduction projects?
Response Options
Select one of the following options:
- Yes
- No
- Do not know
Guidance
Indicate whether your city has a dedicated fund for renewable energy or carbon reduction programs or services.
5.5 Does your City have its own credit rating?
Response Options
Please complete the following table:
| Does your city have a credit rating? | Rating agency | Rating | |
|---|---|---|---|
| International | Select from:
| Text field | Text field |
| Domestic | Select from:
| Text field | Text field |
Guidance
International and domestic credit ratings and rating agencies are offered by third-party rating agencies such as Standard & Poor or Moody's. Municipal market participants rely heavily on these indicators of risk when they determine the relative value of municipal investments.
5.6 Are Environmental, Social and Governance (ESG) issues incorporated into investment decisions of any of the city retirement funds?
Response Options
Select one of the following options:
- Yes
- No
- Do not know
5.7 How are investment decisions of the city retirement funds made?
Response Options
This is an open text question.
Please note that when copying from another document into the disclosure platform, formatting is not retained.
5.8 Which individuals in the city have responsibility for oversight and/or implementation of investment of the city retirement funds?
Response Options
Please complete the following table:
| Does the individual have responsibility for oversight and/or implementation of investment of the city retirement funds? | |
|---|---|
| City council/elected representatives | Select from:
|
| Treasury or city finance staff | Select from:
|
| Other staff | Select from:
|
5.9 Has your City prepared a strategy for green growth?
Response Options
Select one of the following options:
- Yes
- No
- Do not know
Guidance
This question seeks to understand whether your city has a strategy in place to achieve economic growth and development through urban activities that reduce negative environmental externalities and the impact on natural resources and environmental services.
- “Green” refers to urban activities (public and private) that reduce negative environmental impact (land-use, transport, buildings, energy, waste, and water)
- “Growth” refers to GDP growth primarily, but also urban quality of life.
Developing a green economy is crucial for a healthy and sustainable future within cities. Green businesses are more competitive, efficient and prepared for the future.
Links to strong city green growth strategies:
5.10 How many people within your City are employed in green jobs/ industries?
Response Options
Numerical field.Guidance
This question considers green growth strategies, including those meant to accelerate investment and job creation in the sustainability sector, encourage the growth of green enterprise districts or clusters, and quantify the economic benefit of climate action. If you do not know, please provide an estimate.
Local Government Emissions
The questions in this section refer to emissions associated with your local government operations (sometimes referred to as “corporate” or “municipal”) emissions.
Boundary and scope
6.0 Do you have an emissions inventory for your local government operations to report?
By selecting Yes below, you are indicating that you have fuel and/or greenhouse gas (GHG) emissions data from your local government operations (sometimes referred to as ‘corporate’ or ‘municipal’ emissions) to report at this time.
Response Options
Select one of the following options:
- Yes
- No
- In progress
- Not intending to undertake
If Yes is selected in response to 6.0:
6.1 Please state the dates of the accounting year or 12-month period for which you are reporting an emissions inventory for your local government operations.
Response Options
Please complete the following table:
| From | To |
|---|---|
| Drop-down calendar | Drop-down calendar |
If Yes is selected in response to 6.0:
6.2 Please indicate the category that best describes the boundary of your local government operations emissions inventory.
Response Options
Select one of the following options:
- Departments, entities or companies over which operational control is exercised
- Departments, entities or companies over which financial control is exercised
- Other: please specify
If Yes is selected in response to 6.0:
6.3 Please give the name of the primary protocol, standard, or methodology used to calculate your local government operations emissions inventory.
Response Options
Please complete the following table:
| Primary protocol | Comment |
|---|---|
| Select from:
| Text field |
If Yes is selected in response to 6.0:
6.4 Which gases are included in your emissions inventory?
Response Options
Select all that apply:
- CO2
- CH4
- N2O
- HFCs
- PFCs
- SF6
- NF3
Energy Data
If Yes is selected in response to 6.0:
6.5 Please give the total amount of fuel (refers to Scope 1 emissions) that your local government has consumed this year.
Response Options
Please complete the following table. You are able to add rows by using the “Add Row” button at the bottom of the table.
| Source | Fuel | Amount | Units |
|---|---|---|---|
| Select from:
| Select from Appendix C | Numerical field | Select from:
|
[Add row]
If Yes is selected in response to 6.0:
6.6 How much electricity, heat, steam, and cooling (refers to Scope 2 emissions) has your local government purchased for its own consumption during the reporting year?
Response Options
Please complete the following table. You are able to add rows by using the “Add Row” button at the bottom of the table.
| Source | Type | Amount | Units |
|---|---|---|---|
| Select from:
| Select from:
| Numerical field | Select from:
|
[Add Row]
GHG Emissions Data
If Yes is selected in response to 6.0:
6.7 Please provide total (Scope 1 + Scope 2) GHG emissions for your local government operations, in metric tonnes CO2e. Scopes are a common categorization method.
Scope 1: All direct GHG emissions
Scope 2: Indirect GHG emissions associated with the consumption of purchased or acquired electricity, steam, heating, or cooling.
Response Options
Please complete the following table:
| Total Scope 1 + Scope 2 emissions (metric tonnes CO2e) | Total Scope 1 emissions (metric tonnes CO2e) | Total Scope 2 emissions (metric tonnes CO2e) | Comment |
|---|---|---|---|
| Numerical field | Numerical field | Numerical field | Text field |
If Yes is selected in response to 6.0:
6.8 Do you measure local government Scope 3 emissions?
Response Options
Select one of the following options:
- Yes
- No
- In progress
- Intending to undertake in future
- Not intending to undertake
If Yes is selected in response to 6.8:
6.8a Please complete the table.
Response Options
Please complete the following table. You are able to add rows by using the “Add Row” button at the bottom of the table.
| Source of Scope 3 emissions | Emissions (metric tonnes CO2e) | Comment |
|---|---|---|
| Select from:
| Numerical field | Text field |
[Add Row]
If No or Not intending to undertake is selected in response to 6.8:
6.8b Please explain why not and detail your plans to do so in the future, if any.
Response Options
Please complete the following table:
| Reasoning | Explanation |
|---|---|
| Select from:
| Text field |
If Yes is selected in response to 6.0:
6.9 Please indicate if your local government operations emissions have increased, decreased, or stayed the same since your last emissions inventory, and please describe why.
Response Options
Please complete the following table:
| Change in emissions | Reason for change | Please explain |
|---|---|---|
Select from:
| If “Increased” is selected:
| Text field |
External Verification
If Yes is selected in response to 6.0:
6.10 Has the GHG emissions data you are currently reporting been externally verified or audited in part or in whole?
Response Options
Select one of the following options:
- Yes
- No
- In progress
- Intending to undertake in future
- Not intending to undertake
- Do not know
If Yes is selected in response to 6.10:
6.10a Please provide the following information about the emissions verification process.
Response Options
Please complete the following table:
| Name of verifier | Year of verification | Attach verification certificate | Comments |
|---|---|---|---|
| Text field | Numerical field | Attach your document here. | Text field |
If No, Not intending to undertake or Intending to undertake in future is selected in response to 6.10:
6.10b Please explain why your local government operations inventory is not verified and describe any future plans for verification.
Response Options
Please complete the following table:
| Reason | Comments |
|---|---|
| Select from:
| Text field |
City-wide Emissions
The questions in this section refer to your city’s city-wide (sometimes referred to as “geographic” or “community”) emissions inventory. This inventory encompasses emissions which are within a particular city boundary, over which local governments can exercise a degree of influence through the policies and regulations they implement.
City-wide GHG Emissions Data
7.0 Does your city have a city-wide emissions inventory to report?
By selecting Yes below, you are indicating that you have fuel and/or greenhouse gas (GHG) emissions data from the entire city area over which the city government can exercise a degree of influence through the policies and regulations they implement (sometimes referred to as ‘geographic’ or ‘community’ emissions) to report at this time.
Response Options
- Yes
- No
- In progress
- Intending to undertake in future
- Not intending to undertake
Question 7.0 is required for the Global Covenant of Mayors.
GCoM Compliance Requirements
For your GHG emissions inventory to meet compliance, please report a city-wide inventory in the format of the Global Protocol for Community-scale GHG emissions (GPC), including the mandatory data points and within the right timeframe. For further information, please refer to the compliance requirements regarding GHG emissions inventory outlined in question 7.3.
If Yes is selected in response to 7.0:
7.1 Please state the dates of the accounting year or 12-month period for which you are reporting a city-wide GHG emissions inventory.
Response Options
Please complete the following table:
| From | To |
|---|---|
| Drop-down calendar | Drop-down calendar |
Question 7.1 is required for the Global Covenant of Mayors.
GCoM Compliance Requirements
For your GHG emissions inventory to meet compliance, please report a city-wide inventory in the format of the Global Protocol for Community-scale GHG emissions (GPC), including the mandatory data points and within the right timeframe. For further information, please refer to the compliance requirements regarding GHG emissions inventory outlined in question 7.3.
If Yes is selected in response to 7.0:
7.2 Please indicate the category that best describes the boundary of your city-wide GHG emissions inventory.
Response Options
Select one of the following options:
- Administrative boundary of a local government
- Combination of administrative divisions
- A metropolitan area
- Other: please specify
Question 7.2 is required for the Global Covenant of Mayors.
GCoM Compliance Requirements
For your GHG emissions inventory to meet compliance, please report a city-wide inventory in the format of the Global Protocol for Community-scale GHG emissions (GPC), including the mandatory data points and within the right timeframe. For further information, please refer to the compliance requirements regarding GHG emissions inventory outlined in question 7.3.
If Yes is selected in response to 7.0:
7.3 Does your city have a city-wide emissions inventory that aligns with the Global Protocol for Community-Scale Greenhouse Gas Emissions Inventories (GPC)?
Response Options
Select one of the following options:
- Yes
- No
- In progress
Question 7.3 is required for the Global Covenant of Mayors.
GCoM Compliance Requirements
GPC Framework
Cities are asked to compile and report a city-wide GHG emissions inventory following the international standard of the Global Protocol for Community-scale GHG emissions (GPC). The GPC offers cities and local governments a robust, transparent, and globally-accepted framework to consistently identify, calculate, and report on city greenhouse gases.
The GPC standard classifies GHG emissions into “scopes”, depending on where they physically occur, and into six main sectors, which are then broken down by sub-sectors. It covers the seven gases included in the Kyoto Protocol.
Compiling a GPC inventory
The GPC is a flexible framework that can be used to compile a city’s first GHG emissions inventory, or to input an existing emissions inventory, even if it was measured with different methodologies. Various tools have been freely made available to cities to compile an emissions inventory in the format of the GPC and can be found on the Global Covenant of Mayors website.
Inventory Requirements
The Global Covenant asks cities to report a minimum amount of GHG emissions data using the GPC framework. Each compliance year has different requirements, until cities ultimately meet the GPC’s BASIC level in Year 3 (See p.13 of the GPC manual for further information regarding the BASIC level). Please see Table 2 and Table 3 below for a breakdown of the mandatory data points to be reported in the GPC inventory.
GPC requirements per year
| Sectors | Gases | Activity Data & Emissions Factors | Inventory Timeframe | Data Quality Assessment | Methodology and Notation Keys | |
|---|---|---|---|---|---|---|
| Year 1 |
|
CO2 | Optional | The inventory year may be no more than four years prior to the reporting year (see Table 4) | A data quality assessment for both activity data and emissions factors should be conducted for each emission source reported | A short description of the methodologies used to measure emissions should be provided, as well as reasons for using notation keys |
| Year 2 |
|
CO2 |
Mandatory for each emission source reported |
|||
| Year 3 |
|
CO2 CH4 N2O |
Mandatory for each emission source reported |
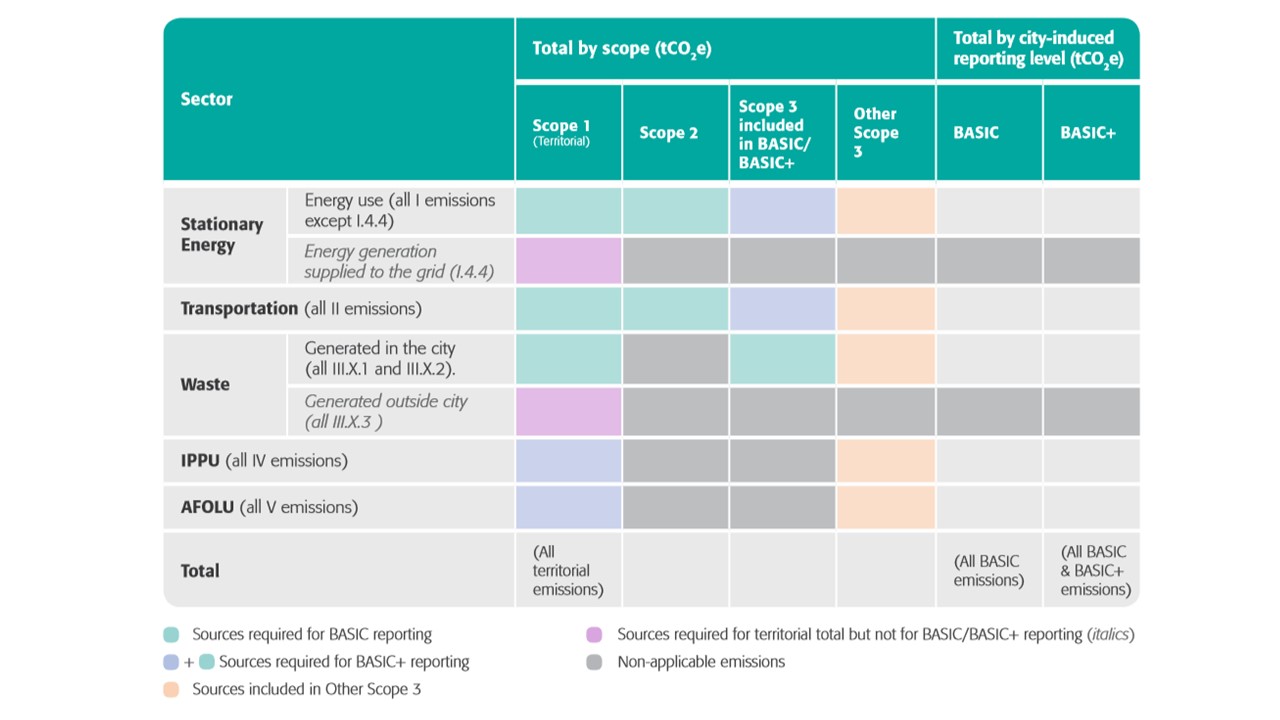
The GPC standard classifies GHG emissions into scopes and into six main sectors. Table 3 below shows the GPC emissions summary table including the annual compliance requirements broken down by sector and by scope.
GPC emissions summary table including annual compliance requirement
Activity Data
Within 2 years, the activity data and emission factors underpinning the GHG inventory must be disclosed and reported.
Unavailability of Data and Notation Keys
The notation keys Not Occurring (NO), Included Elsewhere (IE) or Confidential (C) can be used to accommodate limitations in data availability. Please note that the notation key Not Estimated (NE) will not be accepted for mandatory emission sources.
In case of data unavailability, please report an emissions estimate. Cities can, for instance, downscale national or regional data, note the low-quality data, and explain the circumstances in the comments section. If reporting insignificant emission sources, the notation Not Occurring (NO) may be used.
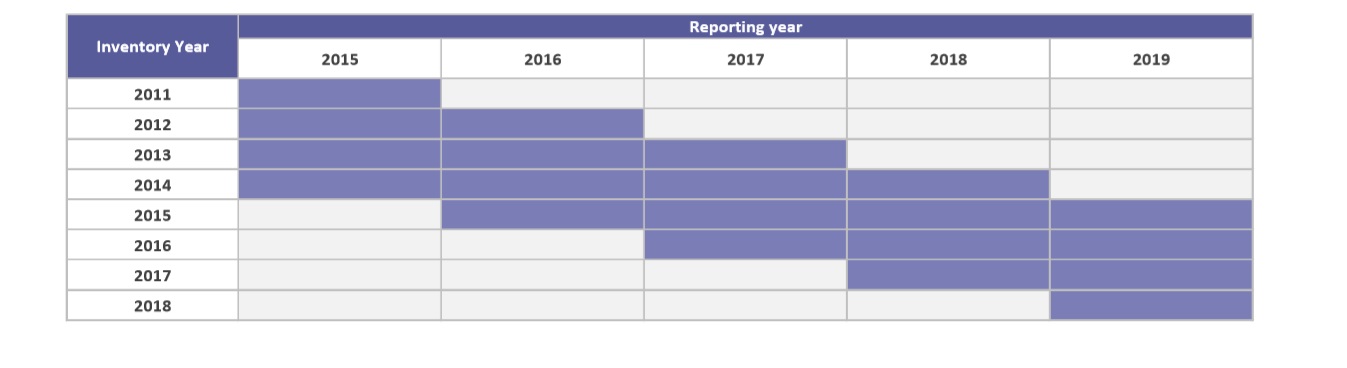
Inventory Reporting Frequency
The inventory year may be no more than four years prior to the reporting year, see Table 4 below. A complete updated inventory shall be required every four years. Over time, we encourage cities to update their inventories on a more frequent basis (e.g. annually) to improve monitoring and reporting of city-wide GHG emissions. In between years when inventories are updated, cities are encouraged to identify and report improvements made to the quality of their inventory, focusing both on data availability and quality, and areas where outstanding data challenges exist.
GHG Emissions Inventory Reporting Frequency
If Yes is selected in response to 7.3:
7.3a Please provide a summary of emissions by sector and scope as defined in the Global Protocol for Community Greenhouse Gas Emissions Inventories (GPC) in the table below.
Response Options
Please complete the following table:
| Sector and scope (GPC reference number) | Emissions (metric tonnes CO2e) |
|---|---|
| Stationary Energy: energy use – Scope 1 (I.X.1) | Numerical field |
| Stationary Energy: energy use – Scope 2 (I.X.2) | Numerical field |
| Stationary Energy: energy use – Scope 3 (I.X.3) | Numerical field |
| Stationary Energy: energy generation supplied to the grid – Scope 1 (I.4.4) | Numerical field |
| Transportation – Scope 1 (II.X.1) | Numerical field |
| Transportation – Scope 2 (II.X.2) | Numerical field |
| Transportation – Scope 3 (II.X.3) | Numerical field |
| Waste: waste generated within the city boundary – Scope 1 (III.X.1) | Numerical field |
| Waste: waste generated within the city boundary – Scope 3 (III.X.2) | Numerical field |
| Waste: waste generated outside the city boundary – Scope 1 (III.X.3) | Numerical field |
| Industrial Processes and Product Use – Scope 1 (IV) | Numerical field |
| Agriculture, Forestry and Land Use – Scope 1 (V) | Numerical field |
| TOTAL Scope 1 (Territorial) emissions | Numerical field |
| TOTAL Scope 2 emissions | Numerical field |
| TOTAL Scope 3 emissions | Numerical field |
| TOTAL BASIC emissions | Numerical field |
| TOTAL BASIC+ emissions | Numerical field |
Question 7.3a is required for the Global Covenant of Mayors.
GCoM Compliance Requirements
For further information, please refer to the compliance requirements regarding GHG emissions inventory outlined in question 7.3.
If No or In progress is selected in response to 7.3:
7.4 Please give the name of the primary protocol, standard, or methodology you have used to calculate your city’s city-wide GHG emissions.
Response Options
Please complete the following table:
| Primary protocol | Comment |
|---|---|
| Select from:
| Text field |
Question 7.4 is required for the Global Covenant of Mayors.
GCoM Compliance Requirements
For your GHG emissions inventory to meet compliance, please report a city-wide inventory in the format of the Global Protocol for Community-scale GHG emissions (GPC) (you can report this information in question 7.3), including the mandatory data points and within the right timeframe. For further information, please refer to the compliance requirements regarding GHG emissions inventory outlined in question 7.3.
If No or In progress is selected in response to 7.3:
7.4a Which gases are included in your city-wide emissions inventory?
Response Options
Select all that apply:
- CO2
- CH4
- N2O
- HFCs
- PFCs
- SF6
- NF3
If No or In progress is selected in response to 7.3:
7.4b Please provide a breakdown of your GHG emissions by scope. Where values are not available, please use the comment field to indicate the reason why.
Response Options
Please complete the following table:
| Scope | Metric tonnes CO2e | Level of confidence | Comments |
|---|---|---|---|
| Scope 1 emissions excluding emissions from grid-supplied energy generation | Numerical field | Select from:
| Text field |
| Scope 1 emissions from grid-supplied energy generation within the city boundary | Numerical field | Select from:
| Text field |
| Total Scope 1 emissions (Row 1 + Row 2) | Numerical field | Select from:
| Text field |
| Total Scope 2 emissions | Numerical field | Select from:
| Text field |
| Total (Scope 1 + Scope 2) emissions | Numerical field | Select from:
| Text field |
| Total Scope 3 emissions | Numerical field | Select from:
| Text field |
If Yes is selected in response to 7.0:
7.5 Please attach your city-wide inventory in the table below.
If you have an inventory in the format of the GPC, please attach it below. You can download the GPC Reporting Tool (CIRIS) here. If you are using the ClearPath tool, please attach both extracts in the table below. If your inventory is not in the format of a GPC, you can also attach it below.
Response Options
Please complete the following table.You are able to add rows by using the “Add Row” button at the bottom of the table.
| Emissions inventory format | Document title | Attachment | Level of confidence | Comment on level of confidence |
|---|---|---|---|---|
|
Select from:
|
Text Field |
Attach your document here. |
Select from:
|
Text field |
[Add Row]
Question 7.5 is required for the Global Covenant of Mayors.
GCoM Compliance Requirements
For your GHG emissions inventory to meet compliance, please report a city-wide inventory in the format of the Global Protocol for Community-scale GHG emissions (GPC) (you can report this information in question 7.3), including the mandatory data points and within the right timeframe. For further information, please refer to the compliance requirements regarding GHG emissions inventory outlined in question 7.3.
ClearPath
ClearPath is ICLEI’s online GHG inventory tool for local governments worldwide, made available to cities committed to the Global Covenant of Mayors. Cities using the ClearPath tool can report their GPC inventories through the CDP platform by following the instructions below.
In the ClearPath tool, please click on the ‘Reports’ tab to access your data summary reports and extract your inventory data in in .xls format. You will have the option of exporting your GPC inventory in various formats, identify the two formats detailed below and click on ‘export’ on the far right of the table to start the downloading process (see screenshot below).
Reports to extract:
- ‘GPC overview’
- ‘Detailed report’
These two reports contain the data points that will be checked against Global Covenant of Mayors requirements.
Once extracted, please save the two reports onto your computer and attach them to the table.
![]()
If 2006 IPCC Guidelines for National Greenhouse Gas Inventories, Greenhouse gas Inventory & Research Center of Korea (GIR), or International Standard for Determining Greenhouse Gas Emissions for Cities (UNEP and World Bank) is selected in response to 7.4:
7.6a Where it will facilitate a greater understanding of your city-wide emissions, please provide a breakdown of these emissions by IPCC sector in the table below.
Response Options
Please complete the following table.You are able to add rows by using the “Add Row” button at the bottom of the table.
| IPCC sector | Sector | Scope | Emissions (metric tonnes CO2e) |
|---|---|---|---|
| Select from:
| Select from:
| Select from:
| Numerical field |
If International Emissions Analysis Protocol (ICLEI) is selected in response to 7.4:
7.6b Where it will facilitate a greater understanding of your city-wide emissions, please provide a breakdown of these emissions by UNFCCC Sector.
Response Options
Please complete the following table.You are able to add rows by using the “Add Row” button at the bottom of the table.
| UNFCCC Sector | Sector | Scope | Emissions (metric tonnes CO2e) |
|---|---|---|---|
| Select from:
| Select from:
| Select from:
| Numerical field |
If U.S. Community Protocol for Accounting and Reporting of Greenhouse Gas Emissions (ICLEI) is selected in response to 7.4:
7.6c Where it will facilitate a greater understanding of your city-wide emissions, please provide a breakdown of these emissions by the US Community Protocol sources.
Response Options
Please complete the following table.You are able to add rows by using the “Add Row” button at the bottom of the table.
| US Community Protocol Sources | Sector | Scope | Emissions (metric tonnes CO2e) |
|---|---|---|---|
| Select from:
| Select from:
| Select from:
| Numerical field |
If Regional or country specific methodology, City specific methodology or Other is selected in response to 7.4:
7.6d Where it will facilitate a greater understanding of your city-wide emissions, please provide a breakdown of these emissions by end user, or any other classification system used in your city.
Response Options
Please complete the following table.You are able to add rows by using the “Add Row” button at the bottom of the table.
| Source | Sector | Scope | Emissions (metric tonnes CO2e) |
|---|---|---|---|
| Text field | Select from:
| Select from:
| Numerical field |
If No or In progress is selected in response to 7.3:
7.7 Please give the total amount of fuel (referring to Scope 1 emissions) consumed in your city during the reporting year.
Response Options
Please complete the following table.You are able to add rows by using the “Add Row” button at the bottom of the table.
| Fuel | Amount | Units | End user/ Economic sector/ IPCC sector/ Other | Sector |
|---|---|---|---|---|
| Select from Appendix C | Numerical field | Select from:
| Text field | Select from:
|
[Add Row]
If No or In progress is selected in response to 7.3:
7.8 How much electricity, heat, steam, and cooling (referring to Scope 2) has been consumed by your city during the reporting year?
Response Options
Please complete the following table.You are able to add rows by using the “Add Row” button at the bottom of the table.
| Type | Amount | Units | End user / Economic sector / IPCC sector / Other | Sector |
|---|---|---|---|---|
| Select from:
| Numerical field | Select from:
| Text field | Select from:
|
[Add Row]
If No or In progress is selected in response to 7.3:
7.9 Does your city have a breakdown by source of city-wide Scope 3 emissions?
Response Options
Select one of the following options:
- Yes
- No
- In progress
- Intending to undertake in future
- Not intending to undertake
If Yes is selected in response to 7.9:
7.9a Please provide a breakdown of your city’s scope 3 emissions.
Response Options
Please complete the following table.You are able to add rows by using the “Add Row” button at the bottom of the table.
| Source of Scope 3 emissions | Emissions (metric tonnes CO2e) | Comment |
|---|---|---|
| Select from:
| Numerical field | Text field |
[Add Row]
If No, Intending to undertake in future or Not intending to undertake is selected in response to 7.9:
7.9b Please explain why not and detail your plans to do so in the future, if any.
Response Options
Please complete the following table:
| Reasoning | Explanation |
|---|---|
| Select from:
| Text field |
If Yes is selected in response to 7.0
7.10 Do you have any credits or offsets resulting in a change to your city’s net emissions that you would like to report?
Response Options
Select one of the following options:
- Yes
- No
- Do not know
If Yes is selected in response to 7.10
7.10a Please provide details on the credits or offsets.
Response Options
Please complete the following table.You are able to add rows by using the “Add Row” button at the bottom of the table.
| Type of offset or credit | Emissions saved (metric tonnes CO2e) | Sector | Comment |
|---|---|---|---|
| Select from:
| Numerical field | Select from:
| Text field |
[Add Row]
If Yes is selected in response to 7.0
7.11 Please indicate if your city-wide emissions have increased, decreased, or stayed the same since your last emissions inventory, and please describe why.
Response Options
Please complete the following table:
| Change in emissions | Reason for change | Please explain |
|---|---|---|
| Select from:
| If “Increased” is selected:
| Text field |
City-wide External Verification
If Yes is selected in response to 7.0:
7.12 Has the city-wide GHG emissions data you are currently reporting been externally verified or audited in part or in whole?
Response Options
Select one of the following options:
- Yes
- No
- In progress
- Intending to undertake in future
- Not intending to undertake
- Do not know
If Yes is selected in response to 7.12:
7.12a Please provide the following information about the city-wide emissions verification.
Response Options
Please complete the following table:
| Name of verifier | Year of verification | Attach verification certificate | Comments |
|---|---|---|---|
| Text field | Numerical field | Attachment your document here. | Text field |
If No, Not intending to undertake or Intending to undertake in future is selected in response to 7.12:
7.12b Please explain why your city-wide emissions inventory is not verified and describe any plans to verify your city-wide emissions in the future.
Response Options
Please complete the following table:
| Reason | Comments |
|---|---|
| Select from:
| Text field |
Re-stating previous emissions inventories
If Yes is selected in response to 7.0:
7.13 Since your last submission, have you needed to recalculate any past city-wide GHG emission inventories previously reported to CDP?
Response Options
Select one of the following options:
- Yes
- No
- Do not know
If Yes is selected in response to 7.13:
7.13a Please provide your city’s recalculated total city-wide emissions figures for any previous inventories along with Scope 1, 2 and 3 breakdowns where applicable.
Response Options
Please complete the following table.You are able to add rows by using the “Add Row” button at the bottom of the table.
| Inventory date from | Inventory date to | Scope | Previous emissions (metric tonnes CO2e) | Updated emissions (metric tonnes CO2e) | Updated methodology | Attach your new inventory | Reasoning for recalculating |
|---|---|---|---|---|---|---|---|
|
Date field |
Date field |
Select from:
|
Numerical field |
Numerical field |
See drop-down options below |
Attach your document here. |
Text field |
[Add Row]
Updated methodology drop-down options
Select from:
- Global Protocol for Community Greenhouse Gas Emissions Inventories (GPC)
- International Emissions Analysis Protocol (ICLEI)
- International Standard for Determining Greenhouse Gas Emissions for Cities (UNEP and World Bank)
- 2006 IPCC Guidelines for National Greenhouse Gas Inventories
- U.S. Community Protocol for Accounting and Reporting of Greenhouse Gas Emissions (ICLEI)
- Greenhouse gas Inventory & Research Center of Korea (GIR)
- Regional or country specific methodology
- City specific methodology
- Other: please specify
Strategy
GHG Emissions Reduction - Local Government Operations
The questions in this section refer to emissions reduction targets and actions associated with your local government operations (sometimes referred to as "corporate" or "municipal") emissions. Targets related to the city-wide emissions (also known as "community") inventory should be reported on the next page in questions 8.2 and 8.3.
8.0 Do you have a GHG emissions reduction target in place for your local government operations?
Response Options
Select one of the following options:
- Yes
- No
If Yes is selected in response to 8.0:
8.0a Please provide details of your local government operations emissions reduction target.
Response Options
Please complete the following table.You are able to add rows by using the “Add Row” button at the bottom of the table.
| Sector | Target start year | Baseline year | Baseline emissions (metric tonnes CO2e) | Percentage reduction target | Target date | Percentage of target acheived | Comment |
|---|---|---|---|---|---|---|---|
| Select from:
| Numerical field | Numerical field | Numerical field | Numerical field | Numerical field | Numerical field | Text field |
[Add Row]
If No is selected in response to 8.0:
8.0b Please explain why you do not have a local government operations emissions reduction target.
Response Options
This is an open text question.
Please note that when copying from another document into the disclosure platform, formatting is not retained.
8.1 What actions are you undertaking to reduce your emissions in your local government operations?
Response Options
Please complete the following table.You are able to add rows by using the “Add Row” button at the bottom of the table.
| Emissions reduction project activity | Status of project | Estimated emissions reduction (metric tonnes CO2e) | Estimated emissions reduction timescale | Project description | Web link to project website |
|---|---|---|---|---|---|
| Select from Appendix D | Select from:
| Numerical field | Select from:
| Text field | Text field |
[Add Row]
Emissions reduction – City-wide
The questions in this section refer to emissions reduction targets and actions associated with your city's Community (sometimes referred to as "geographic" or "city-wide") emissions. Targets related to the local government operations (also known as "municipal") inventory should be reported on the previous page in questions 8.0 and 8.1.
8.2 Does your city have a climate change action plan for reducing city-wide GHG emissions?
Response Options
Select one of the following options:
- Yes
- No
- In progress
- Intending to undertake in future
- Not intending to undertake
- Do not know
Question 8.2 is required for the Global Covenant of Mayors.
GCoM Compliance Requirements
All cities must publish a city-wide climate action plan within three years of committing to the Global Covenant of Mayors. A climate action plan shows how a city will deliver on its commitment to reduce greenhouse gas emissions.
The climate action plan must cover the whole city boundary and must have been published or updated within 5 years of the reporting year (e.g. in 2018, the action plan must have been published or updated between 2013 and 2018). Action plans that cover a boundary larger than the city (e.g. at regional or national levels) are not considered compliant.
The city-wide climate action plan must include the requirements detailed below.
Political commitment to emissions reduction
Clear political commitment from the Mayor, equivalent legal representative authority, or city council.
Vision describing the city’s overall ambition and clear objectives
General objectives or vision that the city aims to achieve with this action plan.
To meet compliance, please provide evidence of this key requirement in question 8.2b.
Context of the action plan
Context that prompted the city to develop an action plan.
To meet compliance, please provide evidence of this key requirement in question 8.2b.
Baseline GHG emissions figure
Baseline GHG emissions figure used by the city to measure progress in emissions reduction.
To meet compliance, please provide a baseline GHG emissions figure as part of your city-wide GHG emissions reduction target in question 8.3 in the ‘Base year emissions’ field.
Business as Usual GHG emissions forecast
A “business-as-usual” baseline case assumes that future development trends follow those of the past and no changes in policies will take place, according to the IPCC Third Assessment Report.
To meet compliance, please provide evidence of this key requirement in question 8.2b.
GHG emissions reduction target(s)
The city-wide GHG emissions reduction target implemented in Year 2 must be clearly referred to.
To meet compliance, please provide a city-wide GHG emissions reduction target in question 8.3.
Implementation plan
Identification of emissions reduction actions and explanation of how they will be implemented.
To meet compliance, your action plan must be in one of the following stages of implementation as reported in question 8.2a:
- Plan in implementation
- Implementation complete
- Measurement in progress
- Plan update in progress
Monitoring plan
Clear plan or KPIs (key performance indicators) to monitor progress against the implemented actions.
To meet compliance, please provide evidence of this key requirement in question 8.2b.
In order to help explore potential emission reduction targets and develop a city climate action plan, cities can use the excel-based CURB tool (see ‘Resources for Phase 3’). CURB is an interactive scenario planning tool designed specifically to help cities act on climate change.
If Yes is selected in response to 8.2:
8.2a Please attach your city’s climate change action plan below.
Response Options
Please complete the following table.You are able to add rows by using the “Add Row” button at the bottom of the table.
| Publication title | Year of publication | Attach | Web link | Stage of implementation |
|---|---|---|---|---|
| Text field | Numerical field | Attach your document here. | Text field | Select from:
|
[Add Row]
Question 8.2a is required for the Global Covenant of Mayors.
GCoM Compliance Requirements
To meet compliance, your action plan must be in one of the following stages of implementation:
- Plan in implementation
- Implementation complete
- Measurement in progress
- Plan update in progress
For further information, please refer to the compliance requirements regarding the action plan outlined in question 8.2.
If Yes is selected in response to 8.2:
8.2b Please describe how your city’s climate change action plan addresses the following key areas, and provide details on the location of this evidence within your plan.
Response Options
Please complete the following table:
| GCoM key requirement | Proof statement from within your action plan (in English) | Page number | Publication title |
|---|---|---|---|
| Vision describing the city’s overall ambition and clear objectives | Text field | Numerical field | Text field |
| Context of the action plan | Text field | Numerical field | Text field |
| Business as Usual GHG Emissions forecast | Text field | Numerical field | Text field |
| Monitoring of the action plan | Text field | Numerical field | Text field |
Question 8.2b is required for the Global Covenant of Mayors.
GCoM Compliance Requirements
Please provide at least one statement demonstrating evidence for each key requirement from within your action plan. Please also provide the page number(s) that this statement can be found on, and the title of the action plan you are referring to. If your action plan is not in English, please ensure that the proof statements are translated to English. For further information, please refer to the compliance requirements regarding the action plan outlined in question 8.2.
If No, Not intending to undertake, or Intending to undertake in future is selected in response to 8.2:
8.2c Please explain why you do not have a city climate change action plan and any future plans to create one.
Response Options
Please complete the following table:
| Reason | Comment |
|---|---|
| Select from:
| Text field |
8.3 Do you have a GHG emissions reduction target in place at the city-wide level?
Response Options
Select all that apply:
- Base year emissions (absolute) target
- Base year intensity target
- Baseline scenario (business as usual) target
- No target
Question 8.3 is required for the Global Covenant of Mayors.
GCoM Compliance Requirements
All cities must report a city-wide GHG emissions reduction target within two years of committing to the Global Covenant. The target must cover the entire city boundary. Multiple reduction targets covering various GHG emissions sectors are not considered compliant.
Targets may be in any of the following formats (as defined in the GHG Protocol Mitigation Goal Standard):
- Base Year Emissions Reduction Target
- Fixed-level Reduction Target
- Baseline Scenario (Business as Usual) Reduction Target
- Intensity Reduction Target
All targets must identify:
- Baseline year (year from which progress will be measured)
- Baseline emissions, or emissions intensity
- Target year (year when the target will be achieved)
- Target reduction to be achieved
To explore potential emission reduction targets and develop a city climate action plan, cities can use the excel-based CURB tool (see ‘Resources for Phase 3’). CURB is an interactive scenario planning tool designed specifically to help cities act on climate change.
If “Base year emissions (absolute) target” is selected in response to 8.3
8.3a Please provide details of your total city-wide base year emissions reduction (absolute) target. In addition, you may add rows to provide details of your sector-specific targets, by providing the base year emissions specific to that target.
Response Options
Please complete the following table.You are able to add rows by using the “Add Row” button at the bottom of the table.
| Sector | Target start year | Base year | Base year emissions (metric tonnes CO2e) | Percentage reduction target | Target year | Percentage of target achieved so far | Comment |
|---|---|---|---|---|---|---|---|
| Select from:
| Numerical field | Numerical field | Numerical field | Percentage field | Numerical field | Percentage field | Text field |
[Add Row]
Question 8.3a is required for the Global Covenant of Mayors.
GCoM Compliance Requirements
To be compliant, cities must report a city-wide GHG emissions reduction target within two years of committing to the Global Covenant. The target must cover the entire city boundary. Multiple reduction targets covering various GHG emissions sectors are not considered compliant. For further information, please refer to the compliance requirements regarding emissions reduction target outlined in question 8.3.
If “Base year intensity target” is selected in response to 8.3:
8.3b Please provide details of your total city-wide base year intensity target. An intensity target is usually measured per capita or per unit GDP. If you have an absolute emissions reduction target, please select “Base year emissions (absolute) target” in question 8.3.
Response Options
Please complete the following table. The table is displayed over several rows for readability. You are able to add rows by using the “Add Row” button at the bottom of the table.
| Sector | Target start year | Intensity unit (Emissions per) | Base year | Base year emissions per intensity unit (metric tonnes CO2e per denominator) |
|---|---|---|---|---|
|
Select from:
|
Numerical field |
Select from:
|
Numerical field |
Numerical field |
| Percentage reduction target in emissions intensity | Target year | Percentage of target achieved | Comment |
|---|---|---|---|
Numerical field | Numerical field | Percentage field | Text field |
Question 8.3b is required for the Global Covenant of Mayors.
GCoM Compliance Requirements
To be compliant, cities must report a city-wide GHG emissions reduction target within two years of committing to the Global Covenant. The target must cover the entire city boundary. Multiple reduction targets covering various GHG emissions sectors are not considered compliant. For further information, please refer to the compliance requirements regarding emissions reduction target outlined in question 8.3.
If “Baseline scenario (business as usual) target” is selected in response to 8.3:
8.3c Please provide details of your total city-wide baseline scenario target, including projected business as usual emissions.
Response Options
Please complete the following table.The table is displayed over several rows for readability. You are able to add rows by using the “Add Row” button at the bottom of the table.
| Sector | Target start year | Base year | Base year emissions (metric tonnes CO2e) | Target year |
|---|---|---|---|---|
|
Select from:
|
Numerical field |
Numerical field |
Numerical field |
Numerical field |
| Estimated business as usual absolute emissions in target year (metric tonnes CO2e) | Percentage reduction target from business as usual | Percentage of target achieved | Comment |
|---|---|---|---|
Numerical field | Percentage field | Percentage field | Text field |
Question 8.3c is required for the Global Covenant of Mayors.
GCoM Compliance Requirements
To be compliant, cities must report a city-wide GHG emissions reduction target within two years of committing to the Global Covenant. The target must cover the entire city boundary. Multiple reduction targets covering various GHG emissions sectors are not considered compliant. For further information, please refer to the compliance requirements regarding emissions reduction target outlined in question 8.3.
If "No target" is selected in response to 8.3:
8.3d Please explain why you do not have a city-wide emissions reduction target and any plans to set one in the future.
Response Options
Please complete the following table:
| Reason | Comment |
|---|---|
| Select from:
| Text field |
8.4 What actions is your city taking to reduce emissions? Please also indicate estimated emissions reduction potential and status of the emissions reduction actions your city has planned.
Response Options
Please complete the following table.You are able to add rows by using the “Add Row” button at the bottom of the table.
| Emissions reduction project activity | Status of project | Estimated emissions reduction (metric tonnes CO2e) | Estimated emissions reduction timescale | Project description | Web link to project website |
|---|---|---|---|---|---|
|
Select from Appendix E |
Select from:
|
Numerical field |
Select from:
|
Text field |
Text field |
[Add Row]
Energy
9.0 Please indicate the energy mix of electricity consumed in your city.
Response Options
Please complete the following table:
| Energy source | Percent |
|---|---|
| Coal | Percentage field |
| Gas | Percentage field |
| Oil | Percentage field |
| Nuclear | Percentage field |
| Hydro | Percentage field |
| Biomass | Percentage field |
| Wind | Percentage field |
| Geothermal | Percentage field |
| Solar | Percentage field |
| Other sources | Percentage field |
9.0a What percentage of your city's electricity grid mix was zero carbon in 2017? "Zero carbon" may include solar, wind, hydro and other zero carbon generation sources.
Response Options
Percentage field.
Requested content
This question seeks to understand the city-wide electricity grid mix.
9.1 How much (in MW capacity) renewable energy is installed within the city boundary in the following categories?
Response Options
Please complete the following table:
| Type | MW capacity |
|---|---|
| Renewable district heat/cooling | Numerical field |
| Solar PV | Numerical field |
| Solar thermal | Numerical field |
| Ground or water source | Numerical field |
| Wind | Numerical field |
| Other: please specify | Numerical field |
9.2 Does your city have a renewable energy or electricity target?
Response Options
Select one of the following options:
- Yes
- No
- In progress
- Intending to undertake in future
- Not intending to undertake
- Do not know
If Yes is selected in response to 9.2:
9.2a Please provide details of your renewable energy or electricity target and how the city plans to meet those targets.
Response Options
Please complete the following table.The table is displayed over several rows for readability. You are able to add rows by using the “Add Row” button at the bottom of the table.
|
Scale |
Energy / electricity types covered by target | Base year | Total renewable energy / electricity covered by target in base year (in unit specified in column 2) |
Percentage renewable energy / electricity of total energy or electricity in base year |
|---|---|---|---|---|
|
Select from:
|
Select from:
|
Numerical field |
Numerical field |
Percentage field |
| Target year | Total renewable energy / electricity covered by target in target year (in unit specified in column 2) | Percentage renewable energy / electricity of total energy or electricity in target year | Percentage of target achieved | Plans to meet target (include details on types of energy/electricity) |
|---|---|---|---|---|
Numerical field | Numerical field | Percentage field | Percentage field | Text field |
[Add Row]
If No, Not intending to undertake, or Intending to undertake is selected in response to 9.2
9.2b Please explain why you do not have a renewable energy or electricity target and any plans to introduce one in the future.
Response Options
Please complete the following table:
| Reasoning | Comment |
|---|---|
| Select from:
| Text field |
9.3 Does your city have an agreement to purchase a level of renewable electricity from the grid or from a national or municipal utility?
Response Options
Select one of the following options:
- Yes
- No
- In progress
- Do not know
If Yes is selected in response to 9.3:
9.3a What is the agreement or target?
Response Options
This is an open text question.
Please note that when copying from another document into the disclosure platform, formatting is not retained.
Buildings
10.0 Does your city have emissions reduction targets OR energy efficiency targets for the following building types?
Response Options
Please complete the following table:
| Emissions reduction target | Energy efficiency target | |
|---|---|---|
| Commercial | Select from:
| Select from:
|
| Municipal | Select from:
| Select from:
|
| Residential | Select from:
| Select from:
|
| New buildings | Select from:
| Select from:
|
Guidance
Indicate whether your city has established targets in reductions in either greenhouse gas emissions or energy use.
10.1 Does your city have a building energy code which incentivises net zero carbon, Passivehaus or other ultra high-efficiency standards for NEW buildings?
Response Options
Select one of the following options:
- Yes
- No
- Do not know
Guidance
Building energy codes are a policy instrument which consist of a set of mandatory requirements designed to reduce the energy consumption of buildings.- A net zero carbon building prioritises energy efficiency, and produces (or purchases) enough emissions-free renewable energy to offset emissions from all energy used in the building annually.
- A Passivhaus is a building, for which thermal comfort (ISO 7730) can be achieved solely by post-heating or post-cooling of the fresh air mass, which is required to achieve sufficient indoor air quality conditions – without the need for additional re-circulation of air.
Some examples of data sources include:
- Development and planning departments
- Departments of building
- Environment and sustainability departments
- Energy department and climate departments
- Housing departments
- Sustainable building rating systems (e.g. LEED, BREEAM)
10.2 Does your city have a building energy code which incentivises reducing the carbon intensity of building stock (even if less ambitious than net zero)? Please specify whether this relates to new buildings only, or to new and existing buildings.
Response Options
Select one of the following options:
- Yes - it applies only to new buildings
- Yes - it applies to both new and existing buildings
- No
- Do not know
Guidance
Building energy codes are a policy instrument which consist of a set of mandatory requirements designed to reduce the energy consumption of buildings.- A net zero carbon building prioritises energy efficiency, and produces (or purchases) enough emissions-free renewable energy to offset emissions from all energy used in the building annually.
- A Passivhaus is a building, for which thermal comfort (ISO 7730) can be achieved solely by post-heating or post-cooling of the fresh air mass, which is required to achieve sufficient indoor air quality conditions – without the need for additional re-circulation of air.
Some examples of data sources include:
- Development and planning departments
- Departments of building
- Environment and sustainability departments
- Energy department and climate departments
- Housing departments
- Sustainable building rating systems (e.g. LEED, BREEAM)
10.3 What percentage of your city's new buildings built in 2017 are ultra high-efficiency (i.e. to Passivhaus, net zero carbon or similar standards, saving at least 50% compared to the average building stock in the city)?
Response Options
Percentage field.
Guidance
- A net zero carbon building prioritises energy efficiency, and produces (or purchases) enough emissions-free renewable energy to offset emissions from all energy used in the building annually.
- A Passivhaus is a building, for which thermal comfort (ISO 7730) can be achieved solely by post-heating or post-cooling of the fresh air mass, which is required to achieve sufficient indoor air quality conditions – without the need for additional re-circulation of air.
Some examples of data sources include:
- Development and planning departments
- Departments of building
- Environment and sustainability departments
- Energy department and climate departments
- Housing departments
- Sustainable building rating systems (e.g. LEED, BREEAM)
10.4 What % of your city's EXISTING building stock (including municipal, residential and commercial buildings) is ultra high-efficiency (to Passivhaus or similar standards)?
Response Options
Percentage field.
Guidance
A Passivhaus is a building, for which thermal comfort (ISO 7730) can be achieved solely by post-heating or post-cooling of the fresh air mass, which is required to achieve sufficient indoor air quality conditions – without the need for additional re-circulation of air.
Some examples of data sources include:
- Development and planning departments
- Departments of building
- Environment and sustainability departments
- Energy department and climate departments
- Housing departments
- Sustainable building rating systems (e.g. LEED, BREEAM)
10.5 What % of your city's municipal buildings have been retrofitted in 2017? Retrofitted buildings should have one or more of full envelope or windows-and-roof retrofit, HVAC or water heating upgrade, automation and controls installed.
Response Options
Percentage field.
Guidance
A full envelope retrofit refers to an upgrade of the thermal and energy performance of the building’s walls, windows and roof.
HVAC refers to the plant and machinery used to provide heating, cooling and ventilation to the building.
Automation and controls refer to a comprehensive system for controlling the building’s lighting, HVAC and other energy consuming equipment.
Some examples of data sources include:
- Development and planning departments
- Departments of building
- Environment and sustainability departments
- Energy department and climate departments
- Housing departments
- Sustainable building rating systems (e.g. LEED, BREEAM)
10.6 What % of your city's private buildings have been retrofitted in 2017? Retrofitted buildings should have one or more of full envelope or windows-and-roof retrofit, HVAC or water heating upgrade, automation and controls installed. If possible, please divide into residential and commercial building types.
Response Options
Please complete the following table:
| Percentage of buildings retrofitted | |
|---|---|
| Both residential and commercial | Percentage field |
| Residential | Percentage field |
| Commercial | Percentage field |
Guidance
A full envelope retrofit refers to an upgrade of the thermal and energy performance of the building’s walls, windows and roof.
HVAC refers to the plant and machinery used to provide heating, cooling and ventilation to the building.
Automation and controls refer to a comprehensive system for controlling the building’s lighting, HVAC and other energy consuming equipment.
10.7 What percentage of your city's municipal building and street lighting energy demand was met with renewables in 2017?
Response Options
Please complete the following table:
| Percentage of municipal buildings energy demand met by renewables | Percentage of street lighting energy demand met by renewables |
|---|---|
| Percentage field | Percentage field |
Guidance
Renewable energy can include hydro, biomass, wind, geothermal and solar energy produced either inside or outside the city boundary.
10.8 Please provide the total final energy use for buildings within the city boundary to show the total city building energy use (for all fuel types).
Response Options
Please complete the following table:
| Total final energy use (kWh) | |
|---|---|
| All building types | Numerical field |
| Municipal | Numerical field |
| Residential | Numerical field |
| Commercial | Numerical field |
Guidance
The total final energy use is sometimes referred to as final or delivered energy, and refers to the total energy used in the buildings.
10.9 Please provide the unadjusted site Energy Use Intensity (EUI) for the buildings in your city, which shows the total site (sometimes called final or delivered) energy (kWh) used per meter square (m2) floor area for all fuel types, excluding energy transmission and distribution losses from the energy source to the building. It may only be possible to provide data for municipal buildings, in which case please specify this.
Response Options
Please complete the following table:
| Unadjusted site Energy Use Intensity (EUI) in kwh/m2 | |
|---|---|
| All building types | Numerical field |
| Municipal | Numerical field |
| Residential | Numerical field |
| Commercial | Numerical field |
Transport
11.0 What is the mode share of each transport mode in your city?
Response Options
Please complete the following table:
| Mode share | |
|---|---|
| Private motorized transport | Percentage field |
| Rail/Metro/Tram | Percentage field |
| Buses (including BRT) | Percentage field |
| Ferries/ River boats | Percentage field |
| Walking | Percentage field |
| Cycling | Percentage field |
| Taxis or For Hire Vehicles | Percentage field |
| Other: please specify | Percentage field |
Guidance
Indicate what proportion of journeys in your city are taken by each mode of transport. For each mode, please indicate what percentage of total trips are taken by this mode. Ideally this information should come from a single source.
For each mode, please indicate what percentage of kilometers by mode. The transport department or transit operators are likely to house this data
11.1 What is the total distance travelled by all transport modes annually in your city (kms)?
Response Options
Numerical field.
Guidance
Indicate the total distance travelled by all modes over the course of the year in kilometers. Ideally this figure should come from a single source. This question aims to understand the total kilometers travelled by all transport modes combined annually - this information is likely to be housed in the transport department or with transit agencies.
11.2 What is the average annual distance travelled by each transport mode in your city (kms)?
Response Options
Please complete the following table:
| Average annual distance travelled (kms) | |
|---|---|
| Private motorized transport | Numerical field |
| Rail/Metro/Tram | Numerical field |
| Buses (including BRT) | Numerical field |
| Ferries/ River boats | Numerical field |
| Walking | Numerical field |
| Cycling | Numerical field |
| Taxis or For Hire Vehicles | Numerical field |
| Other: please specify | Numerical field |
Guidance
Indicate what proportion of journeys in your city are taken by each mode of transport. For each mode, please indicate what percentage of total trips are taken by this mode. Ideally this information should come from a single source. The total of these kms combined such equate to the total in 11.1.
11.3 What are the vehicle kilometres of road goods vehicles travelled in your city?
Response Options
Assign numeric response.
Guidance
This question aims to understand how many kilometres are travelled by road goods vehicles in your city annually. Please provide a breakdown by light goods vehicles and heavy goods vehicles.
11.4 Please provide the total fleet size and number of vehicle types for the following modes of transport.
Response Options
Please complete the following table:
| Number of private cars | Number of buses | Number of municipal fleet (excluding buses) | Number of freight vehicles | Number of taxis | Transport Network Companies (e.g. Uber, Lyft) fleet size | Customer-drive carshares (e.g. Car2Go, Drivenow) fleet size | |
|---|---|---|---|---|---|---|---|
| Total fleet size | Numerical field | Numerical field | Numerical field | Numerical field | Numerical field | Numerical field | Numerical field |
| Electric | Numerical field | Numerical field | Numerical field | Numerical field | Numerical field | Numerical field | Numerical field |
| Hybrid | Numerical field | Numerical field | Numerical field | Numerical field | Numerical field | Numerical field | Numerical field |
| Plug in hybrid | Numerical field | Numerical field | Numerical field | Numerical field | Numerical field | Numerical field | Numerical field |
| Hydrogen | Numerical field | Numerical field | Numerical field | Numerical field | Numerical field | Numerical field | Numerical field |
Guidance
A private vehicle is a road motor vehicle, other than a moped or a motor cycle, intended for the carriage of passengers and designed to seat no more than nine persons (including the driver).
Municipal fleet can include sedans, special use vehicles like police cars and vans etc.
A freight vehicle is a road vehicle designed, exclusively or primarily, to carry goods. Included are:
- Light goods road vehicles with a gross vehicle weight of not more than 3 500 kg, designed exclusively or primarily, to carry goods, e.g. vans and pick-ups;
- Heavy goods road vehicles with a gross vehicle weight above 3 500 kg, designed, exclusively or primarily, to carry goods;
- Road tractors;
- Agricultural tractors permitted to use roads open to public traffic.
11.5 How many buses has your city procured in the last year?
Response Options
Please complete the following table:
| Number of buses | |
|---|---|
| Total number of buses | Numerical field |
| Electric | Numerical field |
| Hybrid | Numerical field |
| Plug-in hybrid | Numerical field |
| Hydrogen | Numerical field |
Guidance
Indicate the number of buses procured in the last year and the break down by technology.
11.6 Do you have a low or zero-emission zone in your city?
Response Options
Select one of the following options:
- Yes
- No
- Do not know
Guidance
Here is an example of a low emission zone https://tfl.gov.uk/modes/driving/low-emission-zone
London are also introducing an Ultra Low Emission Zone https://tfl.gov.uk/modes/driving/ultra-low-emission-zone
If Yes is selected in response to 11.6
11.6a Please provide more details about the zero emissions zone.
Response Options
Please complete the following table:
| Size (sq. km) | Stipulations |
|---|---|
| Numerical field | Text field |
Urban Planning
12.0 What is the size of your city’s park space in square km?
Response Options
Numerical field.
Guidance
Please provide the size of total park area in your city, which can include community gardens and cemeteries, in square kilometres.
12.1 What percentage of your population lives within 500m of a public transport stop?
Response Options
Percentage field.
Guidance
For this question, please only consider public transport stops that have frequent service at rush hour. The transit mode can be of any type (heavy rail, light rail, BRT, bus, cable-propelled transit, ferry, etc.). Using demographic data and a GIS layer of public transport stops, please estimate the percentage of the city’s population that lives within 500 meters of transit stops that receive frequent service at rush hour.
Food
13.0 How many meals per year are served through programs managed by your city?
Response Options
Numerical field.
Guidance
Food public procurement relates to both the purchasing of (raw) food and the contracting out of catering services fully or in parts by public authorities. It applies to different settings and venues such as hospitals, care homes, armed forces, prisons, and canteens in governmental buildings and of course education settings including universities and public schools. Please provide the number of meals served per day by municipal public bodies or by catering services fully or in part contracted out by your city.
13.1 How many tonnes of food are produced within your city's boundaries each year?
Response Options
Numerical field.
Guidance
This is the amount of human or animal edible products grown or directly sourced within your city. This doesn’t include foods produced externally but packaged within the city. This refers to anything produced within the geographical boundary of your city. Please report in metric tonnes. Examples of such growing may be on urban farms, green roofs, allotments, domestic window boxes.
Waste
14.0 How much solid waste does your city generate (tonnes/person/year)?
Response Options
Please complete the following table:
| Amount of solid waste generated (tonnes/person/year) | |
|---|---|
| Total | Numerical field |
| Residential | Numerical field |
| Commercial | Numerical field |
| Industrial | Numerical field |
| Construction and demolition waste | Numerical field |
| Other: please specify | Numerical field |
14.1 What is the amount of your city’s total solid waste collected for each of the following sectors (tonnes/year)?
Response Options
Please complete the following table:
| Amount of total solid waste collected (tonnes/year) | |
|---|---|
| Formal sector | Numerical field |
| Informal Sector | Numerical field |
| Other: please specify | Numerical field |
14.2 Please provide some more information on your city’s waste collection in the table below.
Response Options
Please complete the following table:
| Organic waste collection available? | Recyclables collection available? | |
|---|---|---|
| Multi-unit buildings | Select from:
| Select from:
|
| Single-unit buildings | Select from:
| Select from:
|
| Commercial establishments | Select from:
| Select from:
|
14.3 How much organic waste does your city generate in the following sectors (tonnes/person/year)?
Response Options
Please complete the following table:
| Amount of organic waste (tonnes per person per year) | |
|---|---|
| Total | Numerical field |
| Residential | Numerical field |
| Industrial and commercial | Numerical field |
| Other: please specify | Numerical field |
Guidance
Indicate the best estimate available of organics (food + green waste) generated in your city.
14.4 What percentage of organic waste generated each year is treated?
Response Options
Percentage field.
Guidance
From the estimated organic waste (food + green waste) generated in your city, what fraction is treated and diverted from disposal. Fractions sent to bioreactor landfills; incineration or similar thermal processes should not be counted here.
14.5 Of your total municipal waste treated, what percentage is treated via:
Response Options
Please complete the following table:
| Percentage treated | |
|---|---|
| Re-use | Percentage field |
| Recycling | Percentage field |
| Composting | Percentage field |
| Anaerobic digestion | Percentage field |
| Incineration | Percentage field |
| Incineration without energy recovery | Percentage field |
| Open burning | Percentage field |
| Sanitary landfill | Percentage field |
| Non-sanitary landfill | Percentage field |
| Other: please specify | Percentage field |
Guidance
- Incineration - or burning - is one method of creating energy from waste.
- Incineration without energy recovery refers to waste that is burned without the objective to create energy.
- Open burning refers to waste that is burned outside, i.e. not in a specific incineration facility.
- Sanitary landfill refers to a controlled landfill strategy, where waste is disposed in sites that are sealed with impermeable liners to mitigate the risk of chemicals leaching into the ground. Sanitary landfills may be regenerated for use, e.g. as a public park, golf course, etc.
- Non-sanitary landfill refers to the disposal of waste in the ground without the environmental safety standards of sanitary landfill.
14.6 Please provide details of your city’s landfill gas.
Response Options
Please complete the following table:
| Percentage of landfill gas collected | Percentage of landfill gas utilized |
|---|---|
| Percentage field | Percentage field |
Water
Water Supply
15.0 What are the sources of your city's water supply?
Response options
Select all that apply:
- Surface water
- Ground water
- Desalinated seawater
- Recycled / reclaimed water
- Rainwater
- Other source
Guidance
Please select the most relevant options for sources of your city’s water supply
- Surface water refers to lakes, rivers, reservoirs, etc.
- Ground water refers to water that is stored in aquifers underground.
- Desalinated seawater is seawater that has been treated to remove the salt and make it safe for human consumption.
- Recycled / reclaimed water is wastewater that has been collected and treated to make it safe for either non-human uses (such as washing, toilets, for animals, etc.) or - in some cases - for human consumption.
- Rainwater may be collected in water butts and cisterns for non-human uses, or treated for human use.
15.1 What percentage of your city's population has potable water supply service?
Response options
Percentage field.
Guidance
The proportion of the city’s resident population that has clean drinkable water available, at least 20 litres of safe water per day per person, either directly within their home, or within access across a very short distance, no further than 200 meters from the home.
15.2 Please provide more information on water metering across your city’s buildings in the table below:
Response Options
Please complete the following table:
| Percentage of users with a metered supply | Is water metering mandatory? | |
|---|---|---|
| Residential - Public housing | Percentage field | Select from:
|
| Residential - Private housing | Percentage field | Select from:
|
| Commercial buildings and facilities | Percentage field | Select from:
|
| Institutional (municipal) buildings and facilities | Percentage field | Select from:
|
| Industrial buildings and facilities | Percentage field | Select from:
|
Guidance
Water metering refers to the measurement of water use with a local meter.
15.3 Do you foresee substantive risks to your city’s water supply in the short or long term?
Response options
Select one of the following options:
- Yes
- No
- Do not know
If Yes or Do not know is selected in response to 15.3:
15.3a Please identify the risks to your city’s water supply as well as the timescale and level of risk.
Response Options
Please complete the following table.You are able to add rows by using the “Add Row” button at the bottom of the table.
| Risks | Timescale | Magnitude | Risk description |
|---|---|---|---|
| Select from:
| Select from:
| Select from:
| Text field |
[Add Row]
If No is selected in response to 15.3:
15.3b Please explain why you do not consider your city to be exposed to any substantive water-related risk.
Response Options
Please complete the following table:
| Reason | Explanation |
|---|---|
| Select from:
| Text field |
Water Supply Management
If Yes is selected in response to 15.3:
15.4 Please select the actions you are taking to reduce the risks to your city’s water supply.
Response Options
Please complete the following table.You are able to add rows by using the “Add Row” button at the bottom of the table.
| Risks | Adaptation action | Action description |
|---|---|---|
| Populated from 15.3a | Select from:
| Text field |
[Add Row]
Wastewater
16.0 What percentage of your city's population is served by wastewater collection?
Response Options
Percentage field.
Guidance
Wastewater collection systems gather used water from homes, businesses and industries and convey it to a wastewater treatment plant. Waste water collection either directly in the house, or to be collected locally no more than 200m from the home.
16.1 Please provide the percentage breakdown of the wastewater your city collects and the percentage breakdown of the treatment type for each wastewater type.
Response Options
Please complete the following table:
| Percentage of wastewater collected | No treatment | Pre-treatment | Primary (physical treatment) | Secondary (biological treatment/stabilization) | Tertiary (polishing/potabilization) | |
|---|---|---|---|---|---|---|
| Black water/sewage | Percentage field | Percentage field | Percentage field | Percentage field | Percentage field | Percentage field |
| Greywater/sink water | Percentage field | Percentage field | Percentage field | Percentage field | Percentage field | Percentage field |
| Industrial | Percentage field | Percentage field | Percentage field | Percentage field | Percentage field | Percentage field |
| Runoff/stormwater | Percentage field | Percentage field | Percentage field | Percentage field | Percentage field | Percentage field |
| Other type of wastewater | Percentage field | Percentage field | Percentage field | Percentage field | Percentage field | Percentage field |
| Unknown | Percentage field | Percentage field | Percentage field | Percentage field | Percentage field | Percentage field |
Guidance
Wastewater collection usually involves a sewer network that wastewater drains into.
16.2 What is the aggregated net energy consumption of your wastewater treatment systems in kWh/year? (leave blank if you do not know).
Response Options
Numerical field.
Guidance
Net energy consumption means the final balance of energy consumed from the grid minus the energy returned to the grid.
Some facilities return energy to the grid from biogas utilization and other energy recovery processes, or offset energy consumption through local generation.
16.3 Are you recovering methane from your wastewater treatment system?
Response options
Select one of the following options:
- Yes
- No
- Do not know
If Yes is selected in response to 16.3:
16.3a Are you processing the captured methane for energy recovery?
Response Options
Select the appropriate use:
- Yes, for vehicle fuel
- Yes, for electricity generation
- Yes, both vehicle fuel and electricity generation
- Yes, other
- No
- Do not know
Important Information
CDP has been making information requests relating to carbon and climate change on behalf of investors since 2003. To find out more about CDP and the previous responses from other organizations, please refer to our website at www.cdp.net.
What are the financial implications of responding?
CDP has charitable status and seeks to use its limited funds effectively. Consequently, responses must be prepared and submitted at the expense of responding cities. CDP also reserves the right, where it deems it appropriate in view of its charitable aims and objectives, to charge for access to or use of data and/or reports it publishes or commissions.
What is the basis of participation and what will happen to the data received?
When responding to CDP you will be given a choice as to whether your response is made public or non-public. We strongly encourage cities to make their responses public which means that the response will be made publicly available from the CDP website. Non-public responses will not be made publicly available and will only be used in aggregate and/or anonymously. Any responses submitted to the Global Covenant of Mayors (GCoM) will be considered public.
Scoring of responses
CDP provides private scores to cities who respond to the CDP Cities 2018 information request, the scoring methodology can be found here. Responses to CDP Cities 2018 will not be scored publicly by CDP or its partners. CDP is considering publicly scoring responses in the future.
What if a city wishes to change or update a response?
After you submit your response via the Online Response System, it will become ‘read-only’ and any amendments can be made through the dashboard. Please submit and make all necessary amendments by the submission deadline.
How can a city confirm its participation?
If you received this document in hard copy, please email [email protected] to confirm your participation.
What is the legal status of CDP?
CDP Worldwide (CDP) is a UK Registered Charity no. 1122330 and a company limited by guarantee registered in England and Wales no. 05013650 with its registered office at Level 3, 71 Queen Victoria Street, London EC4V 4AY. The charity has wholly owned subsidiaries in Germany and China and companies in Australia, Brazil and India over which it exercises control through majority Board representation. In the US, CDP North America, Inc. is an independently incorporated affiliate which has United States IRS 501(c)(3) charitable status.
CDP is an independent not-for-profit organization holding the largest database of primary corporate climate change information in the world.
Thousands of organizations from across the world’s major economies measure and disclose their greenhouse gas emissions and climate change strategies through CDP. CDP puts this information at the heart of financial and policy decision-making and its goal is to collect and distribute high quality information that motivates investors, corporations and governments to take action to prevent dangerous climate change.
Appendices
Appendix A: Currency
AED United Arab Emirates dirham
AFN Afghani
ALL Lek
AMD Armenian Dram
ANG Netherlands Antillian Guilder
AOA Kwanza
ARS Argentine Peso
AUD Australian Dollar
AWG Aruban Guilder
AZN Azerbaijanian Manat
BAM Convertible Marks
BBD Barbados Dollar
BDT Bangladeshi Taka
BGN Bulgarian Lev
BHD Bahraini Dinar
BIF Burundian Franc
BMD Bermudian Dollar (customarily known as Bermuda Dollar)
BND Brunei Dollar
BOB Boliviano
BOV Bolivian Mvdol (Funds code)
BRL Brazilian Real
BSD Bahamian Dollar
BTN Ngultrum
BWP Pula
BYR Belarussian Ruble
BZD Belize Dollar
CAD Canadian Dollar
CDF Franc Congolais
CHE WIR Euro (complementary currency)
CHF Swiss Franc
CHW WIR Franc (complementary currency)
CLF Unidades de formento (Funds code)
CLP Chilean Peso
CNY Yuan Renminbi
COP Colombian Peso
COU Unidad de Valor Real
CRC Costa Rican Colon
CUP Cuban Peso
CVE Cape Verde Escudo
CYP Cyprus Pound
CZK Czech Koruna
DJF Djibouti Franc
DKK Danish Krone
DOP Dominican Peso
DZD Algerian Dinar
EEK Kroon
EGP Egyptian Pound
ERN Nakfa
ETB Ethiopian Birr
EUR Euro
FJD Fiji Dollar
FKP Falkland Islands Pound
GBP Pound Sterling
GEL Lari
GHS Cedi
GIP Gibraltar pound
GMD Dalasi
GNF Guinea Franc
GTQ Quetzal
GYD Guyana Dollar
HKD Hong Kong Dollar
HNL Lempira
HRK Croatian Kuna
HTG Haiti Gourde
HUF Forint
IDR Rupiah
ILS New Israeli Shekel
INR Indian Rupee
IQD Iraqi Dinar
IRR Iranian Rial
ISK Iceland Krona
JMD Jamaican Dollar
JOD Jordanian Dinar
JPY Japanese yen
KES Kenyan Shilling
KGS Som
KHR Riel
KMF Comoro Franc
KPW North Korean Won
KRW South Korean Won
KWD Kuwaiti Dinar
KYD Cayman Islands Dollar
KZT Tenge
LAK Kip
LBP Lebanese Pound
LKR Sri Lanka Rupee
LRD Liberian Dollar
LSL Loti
LTL Lithuanian Litas
LVL Latvian Lats
LYD Libyan Dinar
MAD Moroccan Dirham
MDL Moldovan Leu
MGA Malagasy Ariary
MKD Denar
MMK Kyat
MNT Tugrik
MOP Pataca
MRO Ouguiya
MTL Maltese Lira
MUR Mauritius Rupee
MVR Rufiyaa
MWK Kwacha
MXN Mexican Peso
MXV Mexican Unidad de Inversion (UDI) (Funds code)
MYR Malaysian Ringgit
MZN Metical
NAD Namibian Dollar
NGN Naira
NIO Cordoba Oro
NOK Norwegian Krone
NPR Nepalese Rupee
NZD New Zealand Dollar
OMR Rial Omani
PAB Balboa
PEN Nuevo Sol
PGK Kina
PHP Philippine Peso
PKR Pakistan Rupee
PLN Zloty
PYG Guarani
QAR Qatari Rial
RON Romanian New Leu
RSD Serbian Dinar
RUB Russian Ruble
RWF Rwanda Franc
SAR Saudi Riyal
SBD Solomon Islands Dollar
SCR Seychelles Rupee
SDG Sudanese Pound
SEK Swedish Krona
SGD Singapore Dollar
SHP Saint Helena Pound
SKK Slovak Koruna
SLL Leone
SOS Somali Shilling
SRD Surinam Dollar
STD Dobra
SYP Syrian Pound
SZL Lilangeni
THB Baht
TJS Somoni
TMM Manat
TND Tunisian Dinar
TOP Pa'anga
TRY New Turkish Lira
TTD Trinidad and Tobago Dollar
TWD New Taiwan Dollar
TZS Tanzanian Shilling
UAH Hryvnia
UGX Uganda Shilling
USD US Dollar
UYU Peso Uruguayo
UZS Uzbekistan Som
VEB Venezuelan bolívar
VND Vietnamese đồng
VUV Vatu
WST Samoan Tala
XAF CFA Franc BEAC
XAG Silver (one Troy ounce)
XAU Gold (one Troy ounce)
XBA European Composite Unit (EURCO) (Bonds market unit)
XBB European Monetary Unit (E.M.U.-6) (Bonds market unit)
Appendix B: Actions to reduce vulnerability
No action currently taken
Flood mapping
Heat mapping and thermal imaging
Landslide risk mapping
Sea level rise modelling
Biodiversity monitoring
Real time risk monitoring
Crisis management including warning and evacuation systems
Public preparedness (including practice exercises/drills)
Community engagement/education
Projects and policies targeted at those most vulnerable
Testing/vaccination programmes for vector-borne disease
Disease prevention measures
Air quality initiatives
Incorporating climate change into long-term planning documents
Restrict development in at risk areas
Resilience and resistance measures for buildings
Hazard resistant infrastructure design and construction
Diversifying power/energy supply
Economic diversification measures
Flood defences – development and operation & storage
Storm water capture systems
Additional reservoirs and wells for water storage
Soil retention strategies
Tree planting and/or creation of green space
Green roofs/walls
White roofs
Shading in public spaces, markets
Cooling systems for critical infrastructure
Retrofit of existing buildings
Cooling centers, pools, water parks/plazas
Cool pavement
Water extraction protection
Promoting low flow technologies
Water butts/rainwater capture
Xeriscapes – low water landscaping design
Maintenance/repair – leaking infrastructure
Optimizing delivery fuel mix of water supply
Improve water supply distribution method
Promoting and incentivizing water efficiency
Water use restrictions and standards
Water efficient equipment and appliances
Water smart metering
Water use audits
Awareness campaign/education to reduce water use
Diversification of water supply
Other
Appendix C: Fuel Type
Natural gas
Compressed Natural Gas (CNG)
Liquefied Petroleum Gas (LPG)
Liquefied Natural Gas (LNG)
Methane
Butane
Propane
Town gas or city gas
Coal (Bituminous or Black coal)
Coking coal
Crude oil
Diesel/Gas oil
Motor gasoline (petrol)
Aviation gasoline
Jet gasoline
Jet kerosene
Kerosene
Residual fuel oil
Distillate fuel oil No 1
Distillate fuel oil No 2
Distillate fuel oil No 3
Distillate fuel oil No 4
Distillate fuel oil No 5
Distillate fuel oil No 6
Liquified petroleum gas (LPG)
Naptha
Bitumen
Petroleum coke
Wood or wood waste
Biodiesel
Biogasoline
Ethanol
E85
Other liquid biofuel
Landfill gas
Other biogas
Waste (municipal)
OtherConversion of Electricity, Heat, Steam and Cooling data to MWh
Electricity
If you do not have data on purchased electricity in MWh, it can readily be converted from kWh or GWh into MWh.
- To convert from kWh to MWh, divide the figure by 1000.
- To convert from GWh to MWh, multiply the figure by 1000.
Heat and steam
Heat and steam may be bought in British thermal units (Btu), joules (J), and therms, which can be converted to MWh using a calculation tool such as www.onlineconversion.com. Heat is also sometimes bought in kWh, making conversion to MWh straightforward.
Steam may also be bought in units of pounds. Conversion is more difficult as the energy content of the steam varies with temperature and pressure. We would refer organizations to The Climate Registry’s General Reporting Protocol. Chapter 15, section 15.2, step 1 explains how to calculate the energy content of steam.
Cooling
This is frequently bought in refrigeration-ton hours. 1 ton-hour=12,000 Btu=0.003516 MWh.
Conversion of fuel data to MWh
Some questions in the ORS ask for energy and fuel inputs to be reported according to standardized units commonly used for measuring electricity consumption, i.e.: MWh.
Energy and fuel inputs mean the energy content of:
- Fuels before combustion in operations/assets within your reporting boundary; and
- The amount of purchased energy inputs which include electricity, heat, steam and cooling for use by those operations/assets.
This section of the Appendix provides guidance on how to convert fuel data to MWh.
Fuel can be measured in terms of:
- Energy content e.g. in kilojoules (kJ), British thermal units (Btu) or therms;
- Volume e.g. in m3 or liters; and
- Mass e.g. in metric tonnes or short tons.
- The way in which fuel data may be converted to MWh depends upon whether information about fuel is expressed in terms of energy content, volume or mass and guidance on conversion for each measurement is set out below.
- For fuel inputs, we ask for the energy content of fuels prior to combustion.
- Please include in your calculations the energy content of any biomass and self-produced fuels that you use for stationary combustion. Self-produced fuels are fuels produced by assets or activities within your reporting boundary that are combusted for energy generation. This is common in the oil and gas sector, e.g. refinery fuel gas, associated gas, etc.
If you have your fuel data in an energy unit, you can convert it to MWh using a conversion tool such as: www.onlineconversion.com
If your fuel data is in units of volume or mass and you know the energy content of your fuel
- If your fuel consumption is measured by volume or mass you need to obtain the energy content of the fuel in corresponding units, e.g. kJ/liter, kJ/m3, kJ/metric tonne. This is usually called the calorific value or heating value. It may be obtained from your fuel supplier or you may have your own values generated by your own tests.
- Multiply the fuel volume or mass by the calorific value (or heating value) in the appropriate units i.e. if the fuel data is in metric tonnes, then the calorific value must be expressed in energy units per metric tonnes. This gives you the energy content of the fuel used.
- Take the resulting figure and convert it to MWh using a conversion tool.
If your fuel data is in units of volume or mass and you do not know the energy content of the fuel
If you cannot obtain a calorific value (or heating value) specific to the fuel you purchase, default heating values may be used. Default heating values are reproduced in the GHG Protocol’s stationary combustion Excel spreadsheet. Please note: These default values are meant only to provide guidance for users who are developing their own values. Users are encouraged to develop their own values based on the actual characteristics of the fuel being combusted. The GHG Protocol has produced a new tool version 4.0.
If your fuel measurements are in units of mass
- If your figures are already in metric units of mass, convert them to Gg or Giga grams. The online converter has a webpage that can be used to convert between different metric units. The website can also be used to convert to Gg if your figures are in other units of mass e.g. short tons and pounds.
- Select the appropriate default calorific value (or heating value) from Table 1 above and multiply it by your mass figure in Gg. The resulting figure will be in TJ.
- Convert to MWh using the online converter.
If your fuel measurements are in units of volume
- If your fuels are gases or liquids and are in units of volume, convert to units of mass. To do this, organizations will need to know the density of the fuel. Organizations are encouraged to develop their own values based on the actual characteristics of the fuel being combusted. However, if you do not have density data specific to your fuel, you could use default density values from the GHG Protocol’s stationary combustion Excel spreadsheet.
- Multiply the units of volume by the appropriate density values from the spreadsheet to convert them to units of mass. Check that you are using the appropriate conversion factors i.e. if your data is in cubic feet do not use the conversion factor for cubic meters; use the conversion factor for cubic feet.
- Convert the data into Gg or Giga grams. The above online converter has a webpage that can be used to convert between different metric units. The conversion calculator can also be used to convert to Gg if your figures are in other units of mass e.g. short tons and pounds.
- Select the appropriate default calorific value (or heating value) from the spreadsheet above and multiply it by your mass figure in Gg. The resulting figure will be in TJ.
- Convert to MWh using the online converter.
Appendix D: Local government operations emissions reduction activities (question 8.1)
Building codes and standards
Building performance rating and reporting
Energy efficiency/ retrofit measures
On-site renewable energy generation
Switching to low-carbon fuels
Brownfield redevelopment programs
Compact cities
Eco-district development strategy
Green space and/ or biodiversity preservation and expansion
Transit oriented development
Urban agriculture
Low or zero carbon energy supply generation
Optimize traditional power/ energy production
Smart grid
Developing the green economy
Encourage sustainable food production and consumption
LED / CFL / other luminaire technologies
Smart lighting
Awareness and education for non-motorized transport
Improve fuel economy and reduce CO2 from motorized vehicles
Infrastructure for non-motorized transport
Transportation demand management
Recycling or composting collections and/or facilities
Wastewater to energy initiatives
Water metering and billing
Water recycling and reclamation
Appendix E: City-wide emissions reduction activities (question 8.4)
Buildings > Building codes and standards
Buildings > Building performance rating and reporting
Buildings > Carbon emissions reduction from industry
Buildings > Energy efficiency/ retrofit measures
Buildings > On-site renewable energy generation
Buildings > Switching to low-carbon fuels
Community-Scale Development > Brownfield redevelopment programs
Community-Scale Development > Building standards
Community-Scale Development > Compact cities
Community-Scale Development > Eco-district development strategy
Community-Scale Development > Green space and/ or biodiversity preservation and expansion
Community-Scale Development > Low carbon industrial zones
Community-Scale Development > Transit oriented development
Community-Scale Development > Urban agriculture
Energy Supply > Low or zero carbon energy supply generation
Energy Supply > Optimize traditional power/ energy production
Energy Supply > Smart grid
Energy Supply > Transmission and distribution loss reduction
Finance and Economic Development > Developing the green economy
Finance and Economic Development > Instruments to fund low carbon projects
Finance and Economic Development > Low-carbon industrial zones
Food and Agriculture > Encourage sustainable food production and consumption
Mass Transit > Improve bus infrastructure, services, and operations
Mass Transit > Improve fuel economy and reduce CO2 from bus and/or light rail
Mass Transit > Improve fuel economy and reduce CO2 from ferries
Mass Transit > Improve fuel economy and reduce CO2 from trucks
Mass Transit > Improve rail, metro, and tram infrastructure, services and operations
Mass Transit > Smart public transport
Outdoor Lighting > LED / CFL / other luminaire technologies
Outdoor Lighting > Smart lighting
Private Transport > Awareness and education for non-motorized transport
Private Transport > Improve fuel economy and reduce CO2 from aviation
Private Transport > Improve fuel economy and reduce CO2 from motorized vehicles
Private Transport > Improve fuel economy and reduce CO2 from trucks (private)
Private Transport > Improve the efficiency of freight systems
Private Transport > Improve the operations of shipping ports
Private Transport > Infrastructure for non-motorized transport
Private Transport > Transportation demand management
Waste > Improve the efficiency of long-haul transport
Waste > Improve the efficiency of waste collection
Waste > Landfill management
Waste > Recyclables and organics separation from other waste
Waste > Recycling or composting collections and/or facilities
Waste > Waste prevention policies and programs
Water > Wastewater to energy initiatives
Water > Water metering and billing
Water > Water recycling and reclamation

Social risks