2022 Public Authorities Reporting Guidance
PA0 Introduction
(PA0.1) Give a general description of your public authority and select the primary sector(s)/area(s) in which your public authority operate.
Rationale
This will help data users interpret your responses.
Response options
Please complete the following table:
| Description of public authority | Description of legislative mandate | Primary sector(s)/area(s) |
|---|---|---|
| Text field | Text field | Select all that apply:
|
Requested content
Description (column 1)
Provide a description and introduction to your public authority. Include details about your public authority’s level of autonomy and mandate. Consider including details about the population or area you serve and stakeholders.
Primary sector(s)/area(s) (column 2)
Please select the most appropriate sector(s)/area(s) that aligns with the mandate of your public authority.
PA1 Governance
Board oversight
(PA1.1) Provide details on the oversight of climate-related issues within your public authority.
Rationale
This question provides an indication of the importance of climate-related issues to your operations. Investors and other data users are interested in an organization's understanding and approach to climate-related risks at the board level; how aligned this is with business strategy, policies, and performance objectives; and how the board and stalkeholders monitor progress against targets and goals.
Connection to other frameworks
TCFD
Governance recommended disclosure a) Describe the board's oversight of climate-related risks and opportunities.
SDG
Goal 12: Responsible consumption and production
Response options
Please complete the following table:
| Is there board-level oversight of climate-related issues within your public authority? | Frequency with which climate-related issues are a scheduled agenda item | Governance mechanisms into which climate-related issues are integrated | Please explain |
|---|---|---|---|
Select from:
| Select from:
| Select all that apply:
| Text field [maximum 3,000 characters] |
Requested content
General
Note that your response to this question may refer to the position of employees relevant to board oversight mechanisms. In this case, do not include the name of any individual or any other personal data in your response.
Is there board-level oversight of climate-related issues within your public authority? (column 1)
- Consider whether the board and/or board committees take account of climate-related issues when reviewing and guiding their business strategy, major plans of action, risk management policies, annual budgets, and budget plans as well as setting the public authority’s performance objectives, monitoring implementation and performance, and overseeing major capital expenditures.
- If your public authority has board-level oversight of risk assessment that includes climate-related risks, select “Yes.” You’ll be able to provide details in subsequent questions.
Frequency with which climate-related issues are a scheduled agenda item (column 2)
- You should consider the frequency that climate-related issues are a scheduled agenda item for the principal board-level committee having oversight for climate-related issues. This may be a subcommittee of the board or the full board itself.
- If you select “Other, please specify,” provide a label for the frequency with which climate-related issues are a scheduled agenda item.
- This column is only presented if the “Yes” option is selected in column 1.
Governance mechanisms into which climate-related issues are integrated (column 3)
- Select all of the governance mechanisms in which climate-related issues are included.
- This column is only presented if the “Yes” option is selected in column 1.
Please explain (column 4)
- Describe the governance mechanisms selected in column 3 and how these mechanisms contribute to the board’s overall oversight of climate-related issues.
- Include such details as what climate issues are scheduled agenda items, who briefs the board and on which matters (e.g. “a report from each Business Head regarding performance against climate targets is reviewed quarterly”).
- As much as possible, please give examples from the reporting year. • If there is no board-level oversight of climate-related issues, please explain why. If you plan to introduce board-level oversight of climate-related issues in the future, please include more details.
Explanation of terms
- Board: Or “Board of Directors” or “Board of Trustees” refers to a body of elected or appointed members who jointly oversee the activities of a company, organization, or public authority. Some countries use a two-tiered system where “board” refers to the “supervisory board” while “key executives” refers to the “management board.
Responsibility
(PA1.2) Provide details on the highest-level position(s) and/or committee(s) with responsibility for climate-related issues.
Rationale
While it is most important for a member of the board to have responsibility for climate-related issues, assigning management-level responsibility indicates to CDP data users that the public authority is committed to implementing a climate-related strategy.
Connection to other frameworks
TCFD
Governance recommended disclosure b) Describe management's role in assessing and managing climate-related risks and opportunities.
Response options
Please complete the following table. You are able to add rows by using the “Add Row” button at the bottom of the table.
(*column appearance is dependent on selections in this question)
Name of the position(s) and/or committee(s) | Responsibility* | Frequency of reporting to the board on climate-related issues* | Describe management’s role in assessing and managing climate related-risks and opportunities* | Please explain |
|---|---|---|---|---|
Select from:
| Select from:
| Select from:
| Text field | Text field |
[Add Row]
Requested content
General
- Please provide details of the highest management-level position or committee with a responsibility for climate-related issues.
- The responsibility may be for assessing and/or managing climate-related risks and opportunities or have another primary focus.
- Note that this question asks about the position and not about the names of the staff holding these positions. Do not include the name of any individual or any other personal data in your response.
Name of the position(s) and/or committee(s) (column 1)
- Select the best match for the position/committee in your public authority, or select "Other, please specify."
- The list includes senior positions that may sometimes, but not always be, at board level.
- Select one of those positions only if the individual has effective management responsibility for climate-related issues.
- If there is more than one position/committee with high management-level responsibility and you would like to describe this, you may use the "Add Row button." This is optional.
- If you are selecting more than one position or committee by adding rows, make sure that the position/committee with the highest level of responsibility is in the top row of the table.
Responsibility (column 2)
- Select the level of responsibility for climate-related issues assigned to the highest-level position identified in column 1.
- If “Other, please specify” is selected, please provide an explanation.
- This column is presented if an option other than “There is no management level responsibility for climate-related issues” is selected in column 1.
Frequency of reporting to the board on climate-related issues (column 3)
- This column is presented if an option other than “There is no management level responsibility for climate-related issues” is selected in column 1.
Describe management’s role in assessing and managing climate related-risks and opportunities (column 4)
- Use the text box to describe where the highest management-level position(s)/committee(s) with responsibility for climate-related issues sit in the organizational structure, their responsibilities, and how climate-related issues are monitored.
- Give an organization-specific description including:
i. Where in the organizational structure this position(s)/committee(s) lie;
ii. A rationale of why responsibilities for climate-related issues have been assigned to this/these position(s) or committee(s).
- If you selected "There is no management level responsibility for climate-related issues" in column 1, explain your selection here.
- Example response: Overall responsibility for managing climate changes issues is placed at group executive level where the CEO (Chief Executive Officer) has the ultimate responsibility for climate related issues. Climate is fully integrated in Public Authority's steering and governance, and so the CEO has this responsibility and reports to the (Chair) of the Board of directors.
- This column is presented if an option other than “There is no management level responsibility for climate-related issues” is selected in column 1.
Explanation of terms
- Highest management-level position(s) or committee(s): The most senior individual or committee with operational responsibility for the implementation of decisions taken at the board level and day-to-day management.
PA2 Risks and opportunities
Management processes
(PA2.1) Describe your primary process for identifying, assessing, and responding to climate-related risks and opportunities.
Rationale
For many public authorities, climate change poses significant financial challenges and opportunities, now and in the future. CDP asks about a process for identifying, assessing, and responding to climate-related risks and opportunities so that data users may gauge the thoroughness of your public authority's understanding of its exposure to climate-related issues. Understanding how a public authority integrates the consideration of climate-related issues into its overall risk management framework provides insight into the thoroughness of the risk management processes employed by public authorities. Public authorities that fully integrate and frequently assess climate-related risks and opportunities across their value chain and over a range of time-horizons may be better equipped to handle longer-term uncertainties and liabilities.
Connection to other frameworks
TCFD
Risk Management recommended disclosure a) Describe the organization’s processes for identifying and assessing climate-related risks.
Risk Management recommended disclosure b) Describe the organization’s processes for managing climate-related risks
Risk Management recommended disclosure c) Describe how processes for identifying, assessing, and managing climate-related risks are integrated into the organization’s overall risk management.
Response options
Please complete the following table:
(*column appearance is dependent on selections in this question)
| Process in place for addressing climate-related risks and opportunities | Is this an obligatory process within your public authority's mandate* | Risk management process* | Frequency of assessment* | Time horizon(s) covered* | Risk type(s) considered* | Please explain |
|---|---|---|---|---|---|---|
Select from:
| Select from:
|
Select from:
|
Select from:
|
Select all that apply:
|
Select all that apply:
|
Text field [maximum 5,000 characters] |
Requested content
General
- You are requested to provide information on the risk management processes at all the stages of the value chain applicable to your public authority.
Process in place for addressing climate-related risks and opportunities (column 1)
- Select "Yes" if you have any process in place for identifying, assessing, and responding to climate-related risks and opportunities, regardless of how thorough it is. You will be able to provide further details in the subsequent questions.
- Only select "No" if you do not have any form of process for identifying, assessing, and responding to climate-related issues.
Is this an obligatory process within your public authority’s mandate (column 2)
- Select "Yes" if the process to address climate-related risks and opportunities is an obligatory process
Risk management process (column 3)
- Select the option that best describes how your process for identifying, assessing, and responding to climate-related risks and opportunities is integrated into your overall risk management framework. If your public authority has more than one process in place, select the one that is most commonly employed. You will have the opportunity to expand further in column 5 “Description.”
- Integrated into multi-disciplinary organization-wide risk management processes: a documented process where climate-related risks and opportunities are identified and assessed in an integrated way in the organization's centralized enterprise risk management program covering all possible types/sources of risks and opportunities
- A specific climate-related risk management process: a documented process that identifies, assesses and responds to climate change risks and opportunities separate from other business risks and opportunities.
- This column is only presented if the “Yes” option is selected in column 1.
Frequency of assessment (column 4)
- Select the option that describes how often climate-related risks are assessed. If climate-related risk management is integrated into organization-wide risk management processes then the frequency of assessment will be the same throughout the enterprise risk management process.
- This column is only presented if the “Yes” option is selected in column 1.
Time horizons covered (column 5)
- Choose all the time horizons that are considered in your climate-related risk assessment. For example, if you only consider risks that may impact your business in the short term, in line with your definition of time horizons, you should select “short-term” here. Or, if you consider short-term, medium-term and long-term horizons, select all three.
- In case none of the time horizons provided are covered by this risk management process, select “None of the above/ Not defined” and explain the applicable time horizon or why it is not defined in the column “Description.”
- This column is only presented if the “Yes” option is selected in column 1.
Risk type(s) considered (column 6)
- Select the risk types that are relevant to your public authority. Not all risk types are relevant to each public authority.
- This column is only presented if the “Yes” option is selected in column 1.
Please explain (column 7)
- Describe and quantify, in detail, how your public authority defines a “substantive impact” on your business at the corporate level, in the context of a climate-related risk. What constitutes a substantive impact will vary between companies. For example, a 1% reduction in profits will have different effects on different companies depending on their respective profit margins. Companies are therefore asked to determine “substantive” in the way that they would do for their business decision-making. For example, a substantive impact of relatively high magnitude could occur because of a large number for any one of the aspects, or because a small number of the aspects combines to create a larger impact:
- the proportion of business units affected
- the size of the impact on those business units
- the dependency of the public authority on that unit
- the potential for shareholder or customer concern.
- Describe your process for identifying, assessing and responding to climate-related risks and opportunities, including:
- The process used to determine which risks and opportunities could have a substantive financial or strategic impact on the public authority;
- How your public authority makes decisions to mitigate, transfer, accept or control the identified climate-related risks and to capitalize on opportunities.
- If “No” is selected in column one, please outline why your public authority does not have a process in place for identifying, assessing, and responding to climate-related risks and opportunities, and whether you plan to introduce such a process in the future.
- Define, in number of years, what your public authority considers to be short-, medium-, and long-term horizons in the context of climate-related risks and opportunities.
- If your long-term time horizon is open-ended, please state that here.
Explanation of terms
- Climate-related risk, in line with the TCFD, refers to the potential negative impacts of climate change on an organization. Physical risks emanating from climate change can be event-driven (acute) such as increased severity of extreme weather events (e.g., cyclones, droughts, floods, and fires). They can also relate to longer-term shifts (chronic) in precipitation, temperature and increased variability in weather patterns (e.g., sea level rise). Climate-related risks can also be associated with the transition to a lower-carbon global economy, the most common of which relate to policy and legal actions, technology changes, market responses, and reputational considerations.
- Climate-related opportunity, in line with the TCFD, refers to the potential positive impacts on an organization resulting from efforts to mitigate and adapt to climate change, such as through resource efficiency and cost savings, the adoption and utilization of low-emission energy sources, the development of new products and services, and building resilience along the supply chain. Climate-related opportunities will vary depending on the region, market, and industry in which an organization operates.
- Risk management: Risk management involves identifying, assessing and responding to risk to make sure organizations achieve their objectives. It must be proportionate to the complexity and type of organization involved (based on Institute of Risk Management, 2016).
Additional information
Time horizons of climate-related risks
- There is a common perception that all climate-related risks are “long-term”, arising in 10+ years; however, transitional risks such as policies, technology, and markets are emerging earlier than this, and physical risks including the frequency and intensity of storms, floods, and droughts are recognized risks today.
- Evaluating exposure to climate-related risks over a range of time horizons allows for a strategy for the transition to a low-carbon economy as recognized in the Paris Agreement and UN SDGs.
TCFD position on time horizons
- Because the timing of climate-related impacts on organizations will vary, TCFD believes specifying timeframes across sectors could hinder organizations’ consideration of the climate-related risks and opportunities specific to their businesses. TCFD is therefore not defining timeframes and encourages respondents to decide how to define their own timeframes according to the life of their assets, the profile of the climate-related risks they face, and the sectors and geographies in which they operate.
- In assessing climate-related issues, organizations should be sensitive to the timeframes used to conduct their assessments. While many organizations conduct operational and financial planning over a 1-2 year timeframe, and strategic and capital planning over a 2-5 year timeframe, climate-related risks may have implications over a longer period. It is therefore important for organizations to consider the appropriate timeframes when assessing climate-related risks.
Risk and opportunity disclosure
(PA2.2) Have you identified any inherent climate-related risks with the potential to have a substantive financial or strategic impact for your public authority?
Rationale
Investors and data users are interested in learning whether your public authority has knowledge of any substantive climate-related risks, across any part of your value chain.
Connection to other frameworks
TCFD
Strategy recommended disclosure a) Describe the climate-related risks and opportunities the organization has identified over the short, medium, and long term.
SDG
Goal 13: Climate action
Response options
Select one of the following options:
- Yes
- No
Requested content
General
- Please indicate if you have identified any inherent climate-related risks.
- For the purposes of this response, the risks reported should only be those which:
- May pose substantive financial or strategic impacts, in line with your definition of substantive impact; and
- Are inherent (risks that exist in the absence of controls, i.e. not taking into account any potential mitigation or management measures that have been or could be implemented).
(PA2.2a) Provide details of the climate-related risks identified with the potential to have a substantive financial or strategic impact for your public authority.
Question dependencies
This question only appears if you select “Yes” in response to PA2.2.
Rationale
Your response to this question will allow data users to see, in one place, details of the risks posed to your public authority by climate-related issues and the estimated potential financial impact of these risks and your response strategy to manage these risks.
Connection to other frameworks
TCFD
Strategy recommended disclosure a) Describe the climate related risks and opportunities the organization has identified over the short, medium, and long term.
Strategy recommended disclosure b) Describe the impact of climate-related risks and opportunities on the organization's businesses, strategy and financial planning.
SDG
Goal 12: Responsible consumption and production
Goal 13: Climate action
Response options
Please complete the following table. The table is displayed over several rows for readability. You are able to add rows by using the “Add Row” button at the bottom of the table.
| Identifier | Where in the supply chain does the risk driver occur? | Risk type | Primary climate-related risk driver | Primary potential financial impact |
|---|---|---|---|---|
Select from:
|
Select from:
|
Select from:
|
See drop-down options below |
See drop-down options below |
| Description of risk | Time horizon | Likelihood | Magnitude of impact | Please explain |
|---|---|---|---|---|
| Text field [maximum 2,500 characters] | Select from:
| Select from:
| Select from:
| Text field [maximum 2,500 characters] |
Primary climate-related risk driver drop-down options (column 3)
Select one of the following options:
Current regulation
Emerging regulation
Legal
Technology
|
Market
Reputation
Acute physical
Chronic physical
|
Primary potential financial impact drop-down options (column 4)
Select one of the following options:
- Increased direct costs
- Increased indirect (operating) costs
- Increased capital expenditures
- Increased credit risk
- Decreased revenues due to reduced demand for products and services
- Decreased revenues due to reduced production capacity
- Decreased access to capital
- Decreased asset value or asset useful life leading to write-offs, asset impairment or early retirement of existing assets
- Other, please specify
Requested content
General
- For the purposes of this response, the risks reported should only be those which may pose inherently substantive impacts in your operations, revenue, or expenditure, regardless of whether the public authority has taken action to mitigate the risk(s).
Identifier (column 1)
- Select a unique identifier from the drop-down menu provided to identify the risk in subsequent questions, if required, and to track the status of the risk in subsequent reporting years. Please select from Risk1-Risk100 and use the same identifier in subsequent years for the same risk. For any new risks you are adding, always use a new identifier that you have not used previously.
Where in the value chain does the risk driver occur? (column 2)
- Upstream value chain refers to activities, products and services that are inputs to the activities of your business, sourced from third parties. This may include the regulations and policies applied by governments; the products and services provided by your suppliers (i.e. the supply chain).
- Downstream value chain refers to the third parties benefiting from the outputs, products and services of your business activities. This may be your customers and clients, or the organizations and projects your public authority invests in.
Risk type (column 3)
- See explanation of terms for definitions of risk types.
- Note that a selection must be made for both column 3 and column 4. Your data will not be saved if either column is left blank.
Primary climate-related risk driver (column 4)
- Risk driver describes the source of the risk and will depend on the risk type chosen in column 3. Select an option that best describes the primary risk driver of the identified risk from the drop-down menu.
- Note that a selection must be made for both column 3 and column 4. Your data will not be saved if either column is left blank.
Primary potential financial impact (column 5)
- This column refers to the potential financial impact that the risk could have on your public authority. The financial impacts of climate-related issues on public authorities are not always clear or direct, and for many public authorities there might be more than one financial impact associated with a climate-related risk. Select the option from the drop-down menu that you evaluate as having the biggest impact.
Description of risk (column 6)
- Provide further contextual information on the risk driver, including more detail on the exact nature, location and/or regulation of the effect concerned, as well as any notable geographic/regional examples.
- Be sure to include public authority-specific detail, such as references to activities, programs, products, services, methodologies, or operating locations specific to your public authority’s business or operations.
Time horizon (column 7)
- You may specify if this time horizon for assessing climate-related risks and opportunities is aligned with other business practices time horizons and provide any other relevant information.
Likelihood (column 8)
- The likelihood of the impact occurring along with the magnitude of the impact are the building blocks of a risk/opportunity matrix – a common method of identifying and prioritizing risk and opportunities.
- The likelihood refers to the probability of the impact to your business occurring within the time horizon provided, which in the case of an inherent risk might be similar to the probability of the climate event itself.
- For example, if the risk relates to a piece of new legislation which has already been prepared in draft form, the likelihood of the impact associated with that risk occurring will be relatively high.
Magnitude of impact (column 9)
- The magnitude describes the extent to which the impact, if it occurred, would affect your business. You should consider the business as a whole and therefore the magnitude can reflect both the damage that may be caused and the exposure to that potential damage.
- It is not possible for CDP to accurately define terms for magnitude as they will vary from public authority to public authority. For example, a 1% reduction in revenue will have different effects on different public authorities. Therefore, public authorities are asked to determine magnitude on a qualitative scale. Factors to consider include:
- The proportion of business units affected;
- The size of the impact on those business units; and
- The potential for stakeholder or customer concern.
- The proportion of business units affected;
Is this risk publicly reported to stakeholders (column 10)
- Please identify if the risks reported has been publicly reported to stakeholders, regardless of whether the public authority has taken action to mitigate the risk(s).
Please explain (column 11)
- Please provide a definition in number of years of what your public authority considers to be short-, medium-, and long-term horizons in the context of climate-related risks and opportunities.
- If your long-term time horizon is open-ended, please state that here.
Note for electric utility public authorities:
- Electric utilities are asked to consider, among other issues:
- How national and international targets on demand management might affect demand for electricity;
- The impacts of related policies such as building regulations specifying more energy-efficient buildings;
- Policies to increase renewable electricity supply or to support developments that may result in GHG emissions reductions, e.g. CO2 capture and storage, clean coal technologies and energy storage;
- The impacts of any emissions trading schemes and any emissions reduction targets you have set or with which you have to comply, including the analysis of possible scenarios and their effect on the public authority;
- The effects on wholesale and retail power prices of carbon prices in the different markets in which you operate and the extent to which carbon prices are passed through, or may in the future be passed through, into electricity prices in the markets, based on current and anticipated regulatory requirements.
- How national and international targets on demand management might affect demand for electricity;
Note for companies with coal reserves:
- Companies with coal reserves can refer to CDP Technical Note: Guidance for companies with coal reserves for more information on disclosing demand and stranded asset risk.
Explanation of terms
- Climate-related risks: TCFD divides climate-related risks into two major categories: risks related to the transition to a lower-carbon economy and risks related to the physical impacts of climate change.
- Transition risks
- Current and emerging regulation: policy developments that attempt to constrain actions that contribute to the adverse effects of climate change or policy developments that seek to promote adaptation to climate change;
- Technology: all risks associated with technological improvements or innovations that support the transition to a lower-carbon, energy-efficient economic system;
- Legal: all climate-related litigation claims;
- Market: all shifts in supply and demand for certain commodities, products, and services;
- Reputation: all risks tied to changing customer or community perceptions of an organization’s contribution to or detraction from the transition to a lower-carbon economy.
- Physical risks
- Acute: risks that are event-driven, including increased severity of extreme weather events, such as cyclones, hurricanes, or floods;
- Chronic: longer-term shifts in climate patterns (e.g. sustained higher temperatures) that may cause sea level rise or chronic heat waves.
- Upstream and downstream risks: defined based on the location of the risks in your value chain and can also refer to any of the risk types above i.e. emerging regulation, technology, legal, market reputation etc.
Additional information
Time horizons of climate-related risks
- There is a common perception that all climate-related risks are “long-term”, arising in 10+ years; however, transitional risks such as policies, technology, and markets are emerging earlier than this, and physical risks including the frequency and intensity of storms, floods, and droughts are recognized risks today.
- Evaluating exposure to climate-related risks over a range of time horizons allows for a strategy for the transition to a low-carbon economy as recognized in the Paris Agreement and UN SDGs.
TCFD position on time horizons
- Because the timing of climate-related impacts on organizations will vary, TCFD believes specifying timeframes across sectors could hinder organizations’ consideration of the climate-related risks and opportunities specific to their businesses. TCFD is therefore not defining timeframes and encourages respondents to decide how to define their own timeframes according to the life of their assets, the profile of the climate-related risks they face, and the sectors and geographies in which they operate.
- In assessing climate-related issues, organizations should be sensitive to the timeframes used to conduct their assessments. While many organizations conduct operational and financial planning over a 1-2 year timeframe, and strategic and capital planning over a 2-5 year timeframe, climate-related risks may have implications over a longer period. It is therefore important for organizations to consider the appropriate timeframes when assessing climate-related risks.
(PA2.3) Have you identified any climate-related opportunities with the potential to have a substantive financial or strategic impact for your public authority?
Rationale
Investors and data users wish to know whether your public authority has identified any substantive climate-related opportunities, presented across any part of your value chain.
Connection to other frameworks
TCFD
Strategy recommended disclosure a) Describe the climate-related risks and opportunities the organization has identified over the short, medium, and long term.
SDG
Goal 13: Climate action
Response options
Select one of the following options:
- Yes
- Yes, we have identified opportunities but are unable to realize them
- No
Requested content
General
- Regulation on climate change as well as physical changes related to climate may present opportunities for your public authority in a variety of ways, for example through the adoption of low-emission energy sources, the development of new products and services and access to new markets. Further details of such opportunities are provided in the guidance for question PA2.3a.
- Please note that opportunities can be:
- Currently being experienced or expected to arise in the future
- Being managed or newly identified
- Well understood or with high levels of uncertainty with regard to the likelihood of the opportunity materializing and the extent to which it will impact the business
(PA2.3a) Provide details of opportunities identified with the potential to have a substantive financial or strategic impact for your public authority.
Question dependencies
This question only appears if you select “Yes” in response to PA2.3.
Rationale
Your response to this question will allow CDP data users to see, in one place, details of the opportunities posed to your public authority by climate-related issues and the estimated potential scale of these opportunities at the corporate level and your response strategy to take advantage of these opportunities.
Connection to other frameworks
TCFD
Strategy recommended disclosure a) Describe the climate related risks and opportunities the organization has identified over the short, medium, and long term.
Strategy recommended disclosure b) Describe the impact of climate-related risks and opportunities on the organization’s businesses, strategy, and financial planning.
SDG
Goal 7: Affordable and clean energy
Goal 12: Responsible consumption and production
Goal 13: Climate action
Response options
Please complete the following table. The table is displayed over several rows for readability. You are able to add rows by using the “Add Row” button at the bottom of the table.
| Identifier | Where in the supply chain does the opportunity occur? | Opportunity type | Primary climate-related opportunity driver | Primary potential financial impact |
|---|---|---|---|---|
Select from:
|
Select from:
|
Select from:
|
See drop-down options below | See drop-down options below |
| Description of opportunity | Time horizon | Likelihood | Magnitude of impact | Comment and description of time horizon |
|---|---|---|---|---|
| Text field [maximum 2,500 characters] | Select from:
|
Select from:
|
Select from:
|
Text field [maximum 2,500 characters] |
[Add Row]
Primary climate-related opportunity driver drop-down options (column 4)
Select one of the following options:
Resource efficiency
|
Products and services
|
Primary potential financial impact drop-down options (column 5)
Select from the following options:
- Reduced direct costs
- Reduced indirect (operating) costs
- Increased revenues resulting from increased demand for products and services
- Increased revenues through access to new and emerging markets
- Increased revenues resulting from increased production capacity
- Increased access to capital
- Increased value of fixed assets
- Returns on investment in low-emission technology
- Other, please specify
Requested content
General
- For the purposes of this response, the opportunities identified should only be those which may pose substantive impacts on your business operations, revenue, or expenditure.
Identifier (column 1)
- Select a unique identifier from the drop-down menu provided to identify the opportunity in subsequent questions, if required, and to track the status of the opportunity in subsequent reporting years. Please select from Opp1-Opp100 and use the same identifier in subsequent years for the same opportunity. For any new opportunities you are adding, always use a new identifier that you have not used previously.
Where in the value chain does the opportunity occur? (column 2)
- Upstream value chain refers to activities, products and services that are inputs to the activities of your business, sourced from third parties. This may include the regulations and policies applied by governments; the products and services provided by your suppliers (i.e. the supply chain).
- Downstream value chain refers to the third parties benefiting from the outputs, products and services of your business activities. This may be your customers and clients, or the organizations and projects your public authority invests in.
Opportunity type (column 3)
- Select an option from the drop-down menu that best describes the type of the identified opportunity:
- Resource efficiency – opportunities related to improving resource efficiency across production and distribution processes, buildings, machinery/appliances, and transport/mobility.
- Energy source - opportunities related to shifting energy usage toward low emission energy sources.
- Products and services - opportunities related to innovation and development of new low-emission and climate adaptation products and services.
- Markets – opportunities in new markets or types of assets that may help public authorities to diversify their activities and better position themselves for the transition to a lower-carbon economy.
- Resilience – opportunities related to the development of adaptive capacity to respond to climate change. They may be especially relevant for public authorities with long-lived fixed assets or extensive supply or distribution networks; those that depend critically on utility and infrastructure networks or natural resources in their value chain; and those that may require longer-term financing and investment.
Primary climate-related opportunity driver (column 4)
- Opportunity driver describes the source of the opportunity and will depend on the opportunity type selected in column 3. Select an option from the drop-down menu that best describes the identified opportunity. If you select “Other,” please provide further details in column 6, “Description of opportunity.”
Primary potential financial impact (column 5)
- This column refers to the potential financial impact that the opportunity could have on your public authority. The financial impacts of climate-related opportunities on public authority are not always clear or direct, and for many public authorities there might be more than one financial impact associated with a climate-related opportunity.
- Select the option that you deem to have the biggest impact. You can provide additional details on other financial impacts in column 6, “Description of opportunity.”
Description of opportunity (column 6)
- Provide further context on the opportunity driver, including more detail on the exact nature, location, and/or regulation of the effect concerned, as well as any notable geographic/regional examples.
- Be sure to include public authority-specific detail, such as references to activities, programs, products, services, methodologies, or operating locations specific to your public authority’s business or operations.
Time horizon (column 7)
- You may specify if this time horizon for assessing climate-related risks and opportunities is aligned with other business practices time horizons and provide any other relevant information.
Likelihood of impact (column 8)
- The likelihood of the impact occurring, along with the magnitude (see below) are the building blocks of a risk/opportunity matrix – a common method of identifying and prioritizing risk and opportunities.
- The likelihood refers to the probability of the impact to your operations occurring within the time horizon provided, which in the case of an inherent opportunity might be similar to the probability of the climate event itself.
- For example, if the opportunity relates to a piece of new legislation which has already been prepared in draft form, the likelihood of the impact associated with that opportunity occurring will be relatively high.
Magnitude of impact (column 9)
- The magnitude describes the extent to which the impact, if it occurred, would affect your operations. This should consider the public authority as a whole and therefore the magnitude can reflect both the opportunity and the extent to which it applies throughout the public authority.
- It is not possible to accurately define terms for magnitude as they will vary from public authority to public authority. Therefore, public authorities are asked to determine magnitude on a qualitative scale. Factors to consider include:
- The proportion of business units affected;
- The size of the impact on those business units; and
- The potential for stakeholder or customer response.
Please explain (column 10)
- Please provide in number of years of what your public authority considers to be short-, medium-, and long-term horizons in the context of climate-related risks and opportunities.
- If your long-term time horizon is open-ended, please state that here.
Additional information
Time horizons of climate-related risks
- There is a common perception that all climate-related risks are “long-term”, arising in 10+ years; however, transitional risks such as policies, technology, and markets are emerging earlier than this, and physical risks including the frequency and intensity of storms, floods, and droughts are recognized risks today.
- Evaluating exposure to climate-related risks over a range of time horizons allows for a strategy for the transition to a low-carbon economy as recognized in the Paris Agreement and UN SDGs.
TCFD position on time horizons
- Because the timing of climate-related impacts on organizations will vary, TCFD believes specifying timeframes across sectors could hinder organizations’ consideration of the climate-related risks and opportunities specific to their businesses. TCFD is therefore not defining timeframes and encourages respondents to decide how to define their own timeframes according to the life of their assets, the profile of the climate-related risks they face, and the sectors and geographies in which they operate.
- In assessing climate-related issues, organizations should be sensitive to the timeframes used to conduct their assessments. While many organizations conduct operational and financial planning over a 1-2 year timeframe, and strategic and capital planning over a 2-5 year timeframe, climate-related risks may have implications over a longer period. It is therefore important for organizations to consider the appropriate timeframes when assessing climate-related risks.
PA3 Strategy
Climate Plan
(PA3.1) Does your public authority's strategy include a climate plan? If so, provide further information on the plan.
Rationale
Investors and data users are interested in learning whether your public authority has knowledge of any substantive climate-related risks and opportunities, across any part of your value chain. Developing a climate plan provides certainty to data users that a public authority is aligning to the long-term climate goals and that its operations will continue to be relevant in a net-zero carbon economy. Collecting feedback on the climate plan allows stakeholders to review and raise resolutions related to progress. This question allows public authorities to demonstrate transparency on their transition plans and associated feedback mechanisms.
Connection to other frameworks
TCFD
Strategy recommended disclosure b) Describe the impact of climate-related risks and opportunities on the organization’s businesses, strategy, and financial planning.
Response Options
Please complete the following table.
(*column appearance is dependent on selections in this question)
| Climate action plan type | Name of plan* | Attach any relevant documents which detail your plan* | Description of stakeholder engagement* | Please explain |
|---|---|---|---|---|
Select from:
| Text field | Text field and attachment function | Text field | Text field |
Reporting guidance
General
- If your public authority has a climate action plan, please provide additional details about it in this question. Report whether the plan is an integrated plan that addresses both climate mitigation and adaptation, or one that addresses these areas separately. If your public authority does not have a plan, select the most appropriate answer. If you select “no,” you will not be presented with the additional element of the question.
Climate action plan type (column 1)
- Report the type of climate action plan your public authority has in place, this may be an integrated climate action plan which encompasses both adaptation, mitigation (and potentially energy access and/or poverty) or standalone plans that separately address adaption, mitigation and/or energy access.
Name of plan (column 2)
- Use this field to attach your public authority’s climate action plan. You can do this by clicking “Choose file,” navigating to the climate action file and clicking “Attach.” Confirm that the climate action plan has been attached by selecting the option “The plan has been attached” in column 3.
- If you are providing a direct weblink to the climate action plan, please ensure the climate action plan can be accessed unrestricted on the link provided.
- This column is only presented if the “Yes” option is selected in column 1.
Attach any relevant documents which detail your plan (column 3)
- Please be sure to include an attachment
- This column is only presented if the “Yes” option is selected in column 1.
Description of stakeholder engagement (column 4)
- Describe all of the stakeholder(s) that have been engaged with on the selected plan(s) in column 1.
- Engaging with multiple stakeholders ensures that the public authority has incorporated a wide range of perspectives and priorities (UN-Habitat).
- Using a variety of engagement methods increases the ability to engage across different stakeholders, particularly hard-to-reach groups. The methods you use should be selected based on your engagement objectives, for example, to co-design, collaboration, consult, inform or identify/manage. (C40).
- This column is only presented if the “Yes” option is selected in column 1.
Please explain (column 5)
- The column will be presented at the end of this question for all responding public authorities.
- If relevant, attach the stakeholder engagement and communication plan and/or any other reference documents related to the engagement. Reference documents may include meeting minutes, pictures or webpages. However, ensure that no personal data is included in the information reported or the attachments provided.
- If relevant, report the last year the plan was updated and/or the year when it will be updated next.
- Explain how the actions contained in the plan have been prioritized and the factors considered when prioritizing climate-related actions.
(PA3.2) Provide details of how climate-related risks and opportunities influenced your public authority's strategy and/or financial planning?
Rationale
Investors and data users are interested to know how climate-related risks and opportunities may have affected public authorities’ strategies. Answers to this question may be used to inform expectations about the future performance of an public authority and on how resilient its strategy is to climate-related risks and opportunities.
Connection to other frameworks
TCFD
Strategy recommended disclosure b) Describe the impact of climate-related risks and opportunities on the organization’s businesses, strategy, and financial planning.
SDG
Goal 13: Climate action
Response options
Please complete the following table.
(*column appearance is dependent on selections in this question)
| Have climate-related risks and opportunities influenced strategy and/or financial planning | Select the areas where climate-related risks and opportunities have influenced your strategy* | Select the areas where climate-related risks and opportunities have influenced your financial planning* | Description of influence* |
|---|---|---|---|
Select all that apply:
|
Select all that apply:
|
Select all that apply:
|
Text field [maximum 7,000 characters] |
Reporting guidance
Climate-related risks and opportunities influenced strategy and/or financial planning (column 1)
- Select all applicable areas where climate-related risks and opportunities have influenced your strategy and/or financial planning.
- This question is intended to focus on the public authority-wide operations on which you are reporting. However, if it is more appropriate, you may wish to comment on divisional (business unit) strategies.
Describe where climate-related risks and opportunities have influenced your strategy (column 2)
- Select all applicable areas where climate-related risks and opportunities have influenced your strategy.
- If your strategy in this area has not been influenced by climate-related risks and opportunities, explain why not in column 4, “Description of influence.”
Describe where climate-related risks and opportunities have influenced your financial planning (column 3)
- Select all applicable areas where climate-related risks and opportunities have influenced your financial planning.
- If your strategy in this area has not been influenced by climate-related risks and opportunities, explain why not in column 4, “Description of influence.”
Description of influence (column 4)
- Provide details on how climate-related risks and opportunities have influenced the selected elements of your strategy and/or financial planning. For example, if you have disclosed substantive climate-related risks or opportunities in the climate action plan included in question PA3.1, you may provide details of how the risk or opportunity has affected the strategy and/or financial planning element selected in column 2 or 3.
- Specify the time horizons this planning covers.
- Explain if there is another element of strategy and/or financial planning that has been influenced; or why climate-related risks and opportunities have not yet influenced your strategy and/or financial planning.
Explanation of terms
- Strategy: In line with TCFD recommendations, refers to an organization’s desired future state. An organization’s strategy establishes a foundation against which it can monitor and measure its progress in reaching that desired state. Strategy formulation generally involves establishing the purpose and scope of the organization’s activities and the nature of its businesses, taking into account the risks and opportunities it faces and the environment in which it operates.
- Financial planning: In line with TCFD recommendations, refers to an organization’s consideration of how it will achieve and fund its objectives and strategic goals. Financial planning allows organizations to assess future financial positions and determine how resources can be utilized in pursuit of short- and long-term objectives. As part of financial planning, organizations often create “financial plans” that outline the specific actions, assets, and resources (including capital) necessary to achieve these objectives over a 1-5 year period. However, financial planning is broader than the development of a financial plan as it includes long-term capital allocation and other considerations that may extend beyond the typical 3-5 year financial plan (e.g., investment, research and development, manufacturing, and markets).
(PA3.3) Report if your public authority uses climate-related scenario analysis to inform its strategy.
Rationale
Your disclosure to this question provides data users with an indication of the extent to which your public authority is considering a range of possible and probable futures when considering climate-related challenges and opportunities, in line with best practices in corporate environmental management.
Connection to other frameworks
TCFD
Strategy recommended disclosure c) Describe the resilience of the organization’s strategy, taking into consideration different climate-related scenarios, including a 2°C or lower scenario.
SDG
Goal 13: Climate action
Response options
Complete the following table:
(*column appearance is dependent on selections in this question)
| Use of climate-related scenario analysis to inform strategy | Primary reason why your public authority does not use climate-related scenario analysis to inform its strategy* | Explain why your public authority does not use climate-related scenario analysis to inform its strategy and any plans to use it in the future* |
|---|---|---|
Select from:
|
Select from:
|
[Text field, 2,500 characters] |
Reporting guidance
General
- Information on conducting and disclosing scenario analysis can be found in the CDP Technical Note on Scenario Analysis.
- As recommended by TCFD, scenarios should be sufficiently diverse to allow challenging “what-if” analyses and capture a wide range of insights about uncertain futures. In assessing transition risks, a public authority should consider using or developing a 1.5°C scenario. In assessing physical risks, a public authority should use the current GHG pathway based on government policies currently in place, which according to latest estimates from the Climate Action Tracker would result in warming of about 2.7°C above pre-industrial levels. 2.7°C is the median of the low and high ends of current policy projections. Additional information can be found in the TCFD Guidance on Scenario Analysis.
- Public authorities using customized or bespoke scenarios should have a robust and accountable process to ensure that the scenarios used are objective and diverse and should transparently disclose this process and the content of the scenarios in this question.
- See “Explanation of terms” for more details on qualitative and quantitative scenario analysis.
Does your public authority use climate-related scenario analysis to inform its strategy? (column 1)
- Please state if your public authority uses climate-related scenario analysis to inform its business strategy.
- If yes, what type of scenario analysis, and if no, please clarify if you anticipate using it as a tool in the future.
Primary reason why your public authority does not use climate-related scenario analysis to inform its strategy* (column 2)
- This column is only presented if the “No” option is selected in column 1.
- Please select the primary reason why your public authority does not use climate-related scenario analysis to inform its strategy.
- If “Other, please specify” is selected, please specify the reason.
- If more than one reason applies to your organization, select the reason which is most relevant and elaborate on the other reason(s) in column 3.
Explain why your public authority does not use climate-related scenario analysis to inform its strategy and any plans to use it in the future* (column 3)
- This column is only presented if the “No” option is selected in column 1.
- Provide an organization-specific explanation of why you do not use climate-related scenario analysis to inform your strategy and outline any plans to do so in the future.
- If you selected “Judged to be unimportant, explanation provided” in column 2, explain the criteria used to decide that climate-related scenario analysis is not important for your organization.
- If you selected “Lack of internal resources,” specify whether this relates to lack of internal expertise, data availability, funds to outsource the analysis or other resources.
Explanation of terms
- Scenario analysis: A scenario describes a potential path of development that will lead to a particular outcome or goal. Scenario analysis is the process of highlighting central elements of a possible future and drawing attention to key factors (or critical uncertainties). It is a tool to enhance critical strategic thinking by challenging “business-as-usual” assumptions, and to explore alternatives based on their relative impact and likelihood of occurrence. Scenarios are not forecasts or predictions, but tools to describe potential pathways that lead to a particular outcome or goal.
- Qualitative scenarios: A high level, narrative approach to scenario analysis, suitable for public authorities familiarizing themselves with the process. Qualitative scenario analysis explores relationships and trends for which little or no numerical data is available.
- Quantitative scenarios: A more detailed method for conducting scenario analysis, with greater rigor and sophistication in the use of data sets and quantitative models which may warrant further analysis. Quantitative scenario analysis can be used to assess measurable trends and relationships using models and other analytical techniques.
- 1.5°C or lower scenario: A core element of the TCFD’s Strategy recommendation c) “Describe the resilience of the organization’s strategy, taking into consideration different climate-related scenarios, including a 2°C or lower scenario.” As noted on page 26 of the TCFD Guidance on Scenario Analysis for Non-Financial Companies, the TCFD now recommends that in assessing transition risks, companies should consider using or developing a 1.5°C scenario for the “2°C or lower scenario”, stating that “a 1.5°C scenario would provide stronger diversity in assumptions about future policies and technologies. A 1.5°C scenario also aligns with the latest scientific research from the IPCC, the growing momentum of pledges to limit emissions to net-zero by 2050, and the spirit of the Paris Agreement, demonstrating a company’s alignment to recognized temperature targets.”
- Publicly available scenarios: Taken from TCFD recommendations, “Publicly available scenarios” refer to scenarios which are:
- used/referenced and issued by an independent body;
- wherever possible, supported by publicly available datasets;
- updated on a regular basis; and
- linked to functional tools (e.g., visualizers, calculators, and mapping tools) that can be applied by organizations.
- IEA NZE 2050: IEA’s Net Zero by 2050 scenario presents a roadmap for the energy sector to transition to a net zero energy system by 2050. It assumes that advanced economies will reach net zero in advance of 2050 and sets out an emissions trajectory consistent with a 50% chance of limiting the global temperature rise to 1.5°C without a temperature overshoot.
- IEA B2DS: IEA’s Beyond 2°C Scenario (B2DS) sets out a rapid decarbonization pathway in line with international policy goals. The B2DS looks at how far known clean energy technologies could go if pushed to practical limits, in line with countries’ ambitious aspirations in the Paris Agreement. In this scenario, the energy sector reaches carbon neutrality by 2060 to limit future temperature increases to 1.75°C by 2100. This pathway implies that all available policy levers are activated throughout the outlook period in every sector worldwide, requiring unprecedented policy action as well as effort and engagement from all stakeholders.
- IEA 2DS: IEA’s 2°C Scenario is built on a projected warming limit of 2°C and is part of the annual publication “Energy Technology Perspectives”, providing scenario analysis based on the development of lower carbon technology and its deployment in various sectors. The IEA ETP 2DS sets out an energy system development pathway and an emissions trajectory consistent with at least a 50% chance of limiting the average global temperature rise to 2°C. It sets the target of cutting CO2 emissions by almost 60% by 2050 (compared with 2013), followed by continued decline after 2050 until carbon neutrality is reached. It also identifies changes that help ensure a secure and affordable energy system in the long run, while emphasizing that transforming the energy sector is vital, but not enough on its own.
- IEA 450: IEA’s World Energy Outlook 450 scenario is expressed as realizing a 50% chance of limiting warming to a 2°C rise by 2100 (originally based upon a projected warming limit of 2°C through limiting the concentration of GHG’s to around 450ppm of CO2 equivalent) and offers steps by which that goal might be achieved. It references many separate measures which are required to reduce energy-related emissions from 2015 to 2040, including stronger deployment of technologies that are familiar and available at a commercial scale today, delivering close to 60% of the emissions reductions. Technologies referenced include the building of significant additional nuclear capacity and rapid CCS expansion.
- IEA SDS: IEA’s Sustainable Development Scenario (SDS) is compatible with the Paris Agreement’s less ambitious “well-below 2°C” goal. It assumes all energy-related SDGs and all current net-zero pledges are achieved, with advanced economies reaching net zero emissions by 2050, China by 2060 and all others by 2070 at the latest. It has a 50% probability of limiting global temperature rise to 1.65°C, assuming no extensive net negative emissions. With some net negative emissions after 2070, temperature rise could be reduced to 1.5°C by 2100.
- IEA APS: IEA’s Announced Pledges Scenario (APS) takes account of all climate commitments made by governments around the world including Nationally Determined Contributions (NDCs) as well as longer-term net-zero targets and assumes they will be met in full and on time. The global emissions difference between the APS and the NZE represents the “ambition gap” that needs to be closed for governments to achieve the goals agreed in the 2015 Paris Agreement.
- IEA STEPS (previously IEA NPS): IEA’s Stated Policies Scenario (STEPS) does not take for granted that governments will meet all announced goals. It instead looks at where the energy system might go without additional policy implementation, looking at existing policies and measures and those under development. The global emissions difference between the STEPS and the APS represents the “implementation gap” that needs to be closed for governments to achieve their announced decarbonization targets.
- IEA CPS: IEA’s Current Policies Scenario (CPS) includes only existing energy policies. This default setting for the energy system is a benchmark against which the impact of “new” policies can be measured.
- Greenpeace: Refers to the Advanced Energy [R]evolution scenario. Based on Greenpeace’s basic Energy [R]evolution scenario, which includes significant efforts to exploit opportunities for energy efficiency, along with large-scale integration of renewables, biofuels, and hydrogen into the energy mix, the Advanced Energy [R]evolution scenario sets out an ambitions pathway towards a fully decarbonized energy system by 2050 through much stronger efforts to move energy towards a 100% renewable energy supply. Consumption pathways remain similar to the basic scenario, but faster introduction of technologies leads to complete decarbonization. The IEA’s Current Policies Scenario serves as the reference point in the development of Greenpeace’s Advanced Energy Revolution scenario.
- DDP: The Deep Decarbonization Pathways (DDP) initiative builds and brings to the public debate realistic decarbonization pathways to 2050. These are designed to deeply reduce carbon emissions while satisfying socio-economic objectives. The pathways are developed country by country, considering in each case the specific context and highlighting key drivers of the transformation and their potential effects.
- IRENA: IRENA’s REmap determines the potential for countries, regions and the world to scale up renewables in order to ensure an affordable and sustainable energy future. REmap assesses worldwide renewable energy potential assembled from the bottom-up, starting with country analyses – in collaboration with country experts, and then aggregating these results to arrive at a global picture. REmap accounts for renewable power technologies, but also considers technology options in heating, cooling and transport. In determining the potential to scale up renewables, REmap focuses on possible technologies pathways and assesses numerous other metrics, including: technology, sector and system costs; investment needs; externalities relating to air pollution and climate; CO2 emissions; and economic indicators such as employment and economic growth. Based on these country driven results, REmap provides insights to policy and decision makers for areas in which action is needed.
- BNEF NEO: Bloomberg New Energy Finance’s (BNEF) New Energy Outlook (NEO) focusses on the annual long-term economic analysis of the world’s power sector out to 2050. 2021’s edition presents three scenarios that are aligned with the Paris Agreement, achieving net-zero emissions in 2050. The Green Scenario is a net-zero pathway where so-called ‘green hydrogen’ complements greater electricity use, recycling and bioenergy. The Grey Scenario assumes greater use of electricity and renewable power is complemented by carbon capture and storage technology and allows for the continued use of some fossil fuels. The Red Scenario assumes smaller, modular nuclear is deployed to complement wind, solar and battery technology in the power sector, with dedicated nuclear plants manufacturing so-called “red hydrogen”.
- RCP 1.9: Representative Concentration Pathway (RCP) 1.9 is the IPCC’s lowest emission pathway that focuses on limiting warming to below 1.5°C by the end of the century, which is the aspirational goal of the Paris Agreement. RCPs provide a quantitative description of atmospheric pollutions over time, as well as radiative forces in 2100. In RCP 1.9, radiative forcing is limited to no more than 1.9 W/m2 above pre-industrial levels.
- RCP 2.6: In RCP 2.6, radiative forcing peaks at 3.1 W/m2 before returning to 2.6 W/m2 by 2100, achieved through; a shift to renewable energy sources; CO2 remaining at today’s level until 2020, then decline and becoming negative in 2100; and CO2 concentrations peaking by 2050, followed by a modest decline to around 400 ppm by 2100.
- RCP 3.4: RCP 3.4 represents the IPCC’s intermediate pathway between the very stringent RCP2.6 and the less stringent mitigation efforts associated with RCP4.5.
- RCP 4.5: RCP 4.5 represents one of IPCC’s intermediate stabilization pathways in which radiative forcing is stabilized at approximately 4.5 W/m2 after 2100.
- RCP 6.0: RCP 6.0 represents one of IPCC’s intermediate stabilization pathways in which radiative forcing is stabilized at approximately 6.0 W/m2 after 2100.
- RCP 7.0: RCP 7.0 consists of a baseline outcome rather than a mitigation target, and represents the medium-to-high end of the range of future emissions and warming resulting from no additional climate policy.
- RCP 8.5: RCP 8.5 represents the IPCC’s high-end pathway in which radiative forcing reaches greater than 8.5 W/m2 by 2100, and continues to rise for some time afterwards.
- Transition risks
- Current and emerging regulation – policy developments that attempt to constrain actions that contribute to the adverse effects of climate change or policy developments that seek to promote adaptation to climate change;
- Technology – all risks associated with technological improvements or innovations that support the transition to a lower-carbon, energy-efficient economic system;
- Legal – all climate-related litigation claims;
- Market – all shifts in supply and demand for certain commodities, products, and services;
- Reputation – all risks tied to changing customer or community perceptions of a public authority’s contribution to or detraction from the transition to a lower-carbon economy.
- Physical risks
- Acute – risks that are event-driven, including increased severity of extreme weather events, such as cyclones, hurricanes, or floods;
- Chronic – longer-term shifts in climate patterns (e.g., sustained higher temperatures) that may cause sea level rise or chronic heat waves.
Additional information
- IEA Energy Technology Perspectives (ETP): International Energy Agency (IEA)’s comprehensive publication on energy technology focuses on the opportunities and challenges of scaling and accelerating the deployment of clean energy technologies. Additional information on this publication can be found here.
- Critical uncertainties: Identified using a process of scaling potential impacts and uncertainties, those meeting high for both impact and uncertainty should be considered critical uncertainties and the basis for the development of scenarios. A common process for identifying critical uncertainties is the development of an impact/uncertainty grid. Further information on critical uncertainties can be found in CDP’s technical note on Scenario Analysis.
(PA3.3a) Provide details of how your public authority uses climate-related scenario analysis to inform its strategy.
Question dependencies
This question only appears if you select “Yes, qualitative,” “Yes, quantitative,” “Yes, qualitative and quantitative,” or “Yes, qualitative, but we plan to add quantitative in the next two years,” in question PA3.3.
Rationale
Your disclosure to this question provides data users with an indication of the extent to which your public authority is considering a range of possible and probable futures when considering climate-related challenges and opportunities, in line with best practices in corporate environmental management.
Connection to other frameworks
TCFD
Strategy recommended disclosure c) Describe the resilience of the organization’s strategy, taking into consideration different climate-related scenarios, including a 2°C or lower scenario.
SDG
Goal 13: Climate action
Response options
Please complete the following table. You are able to add rows by using the “Add Row” button at the bottom of the table.
| Climate-related scenario used | Temperature alignment of scenario | Provide further information on the use of climate-related scenario analysis |
|---|---|---|
| Select all that apply: Transition scenarios
| Select from:
| [Text field] |
[Add row]
Reporting guidance
General
- As recommended by TCFD, scenarios should be sufficiently diverse to allow challenging “what-if” analyses and capture a wide range of insights about uncertain futures. In assessing transition risks, a public authority should consider using or developing a 1.5°C scenario. In assessing physical risks, a public authority should use the current GHG pathway based on government policies currently in place, which according to latest estimates from the Climate Action Tracker would result in warming of about 2.7°C above pre-industrial levels. 2.7°C is the median of the low and high ends of current policy projections.
- Public authorities using customized or bespoke scenarios should have a robust and accountable process to ensure that the scenarios used are objective and diverse and should transparently disclose this process and the content of the scenarios in this question.
Climate-related scenario (column 1)
- Add a row for each scenario used in your scenario analysis.
Temperature alignment of scenario (column 2)
- This column is only presented if “Customized publicly available physical scenario,” “Customized publicly available transition scenario,” “Bespoke physical scenario,” or “Bespoke transition scenario” is selected in column 1.
Provide further information on the use of climate-related scenario analysis (column 3)
- Provide details on how the selected scenario was identified, with reference to the parameters, assumptions and analytical methods used:
- Parameters refer to measurable factors built into the scenario that may have a material impact on your business performance, such as discount rate, GDP, and other macro-economic or demographic variables.
- Assumptions refer to assumptions made about how the parameters are likely to develop over the scenario’s timeframe, such as the timing of policy changes (e.g., carbon prices) or the development of market prices of key commodities/products.
- Analytical choices refer to the time horizons, data sources and models used, such as any SSPs (Shared Socioeconomic Pathways) used in conjunction with your scenario.
- Indicate in your response whether your analysis using this scenario was quantitative or qualitative.
Explanation of terms
- Scenario analysis: A scenario describes a potential path of development that will lead to a particular outcome or goal. Scenario analysis is the process of highlighting central elements of a possible future and drawing attention to key factors (or critical uncertainties). It is a tool to enhance critical strategic thinking by challenging “business-as-usual” assumptions, and to explore alternatives based on their relative impact and likelihood of occurrence. Scenarios are not forecasts or predictions, but tools to describe potential pathways that lead to a particular outcome or goal.
- Qualitative scenarios: A high level, narrative approach to scenario analysis, suitable for public authorities familiarizing themselves with the process. Qualitative scenario analysis explores relationships and trends for which little or no numerical data is available.
- Quantitative scenarios: A more detailed method for conducting scenario analysis, with greater rigor and sophistication in the use of data sets and quantitative models which may warrant further analysis. Quantitative scenario analysis can be used to assess measurable trends and relationships using models and other analytical techniques.
- 1.5°C or lower scenario: A core element of the TCFD’s Strategy recommendation c) “Describe the resilience of the organization’s strategy, taking into consideration different climate-related scenarios, including a 2°C or lower scenario.” As noted on page 26 of the TCFD Guidance on Scenario Analysis for Non-Financial Companies, the TCFD now recommends that in assessing transition risks, companies should consider using or developing a 1.5°C scenario for the “2°C or lower scenario”, stating that “a 1.5°C scenario would provide stronger diversity in assumptions about future policies and technologies. A 1.5°C scenario also aligns with the latest scientific research from the IPCC, the growing momentum of pledges to limit emissions to net-zero by 2050, and the spirit of the Paris Agreement, demonstrating a company’s alignment to recognized temperature targets.”
- Publicly available scenarios: Taken from TCFD recommendations, “Publicly available scenarios” refer to scenarios which are:
- used/referenced and issued by an independent body;
- wherever possible, supported by publicly available datasets;
- updated on a regular basis; and
- linked to functional tools (e.g., visualizers, calculators, and mapping tools) that can be applied by organizations.
- IEA NZE 2050: IEA’s Net Zero by 2050 scenario presents a roadmap for the energy sector to transition to a net zero energy system by 2050. It assumes that advanced economies will reach net zero in advance of 2050 and sets out an emissions trajectory consistent with a 50% chance of limiting the global temperature rise to 1.5°C without a temperature overshoot.
- IEA B2DS: IEA’s Beyond 2°C Scenario (B2DS) sets out a rapid decarbonization pathway in line with international policy goals. The B2DS looks at how far known clean energy technologies could go if pushed to practical limits, in line with countries’ ambitious aspirations in the Paris Agreement. In this scenario, the energy sector reaches carbon neutrality by 2060 to limit future temperature increases to 1.75°C by 2100. This pathway implies that all available policy levers are activated throughout the outlook period in every sector worldwide, requiring unprecedented policy action as well as effort and engagement from all stakeholders.
- IEA 2DS: IEA’s 2°C Scenario is built on a projected warming limit of 2°C and is part of the annual publication “Energy Technology Perspectives”, providing scenario analysis based on the development of lower carbon technology and its deployment in various sectors. The IEA ETP 2DS sets out an energy system development pathway and an emissions trajectory consistent with at least a 50% chance of limiting the average global temperature rise to 2°C. It sets the target of cutting CO2 emissions by almost 60% by 2050 (compared with 2013), followed by continued decline after 2050 until carbon neutrality is reached. It also identifies changes that help ensure a secure and affordable energy system in the long run, while emphasizing that transforming the energy sector is vital, but not enough on its own.
- IEA 450: IEA’s World Energy Outlook 450 scenario is expressed as realizing a 50% chance of limiting warming to a 2°C rise by 2100 (originally based upon a projected warming limit of 2°C through limiting the concentration of GHG’s to around 450ppm of CO2 equivalent) and offers steps by which that goal might be achieved. It references many separate measures which are required to reduce energy-related emissions from 2015 to 2040, including stronger deployment of technologies that are familiar and available at a commercial scale today, delivering close to 60% of the emissions reductions. Technologies referenced include the building of significant additional nuclear capacity and rapid CCS expansion.
- IEA SDS: IEA’s Sustainable Development Scenario (SDS) is compatible with the Paris Agreement’s less ambitious “well-below 2°C” goal. It assumes all energy-related SDGs and all current net-zero pledges are achieved, with advanced economies reaching net zero emissions by 2050, China by 2060 and all others by 2070 at the latest. It has a 50% probability of limiting global temperature rise to 1.65°C, assuming no extensive net negative emissions. With some net negative emissions after 2070, temperature rise could be reduced to 1.5°C by 2100.
- IEA APS: IEA’s Announced Pledges Scenario (APS) takes account of all climate commitments made by governments around the world including Nationally Determined Contributions (NDCs) as well as longer-term net-zero targets and assumes they will be met in full and on time. The global emissions difference between the APS and the NZE represents the “ambition gap” that needs to be closed for governments to achieve the goals agreed in the 2015 Paris Agreement.
- IEA STEPS (previously IEA NPS): IEA’s Stated Policies Scenario (STEPS) does not take for granted that governments will meet all announced goals. It instead looks at where the energy system might go without additional policy implementation, looking at existing policies and measures and those under development. The global emissions difference between the STEPS and the APS represents the “implementation gap” that needs to be closed for governments to achieve their announced decarbonization targets.
- IEA CPS: IEA’s Current Policies Scenario (CPS) includes only existing energy policies. This default setting for the energy system is a benchmark against which the impact of “new” policies can be measured.
- Greenpeace: Refers to the Advanced Energy [R]evolution scenario. Based on Greenpeace’s basic Energy [R]evolution scenario, which includes significant efforts to exploit opportunities for energy efficiency, along with large-scale integration of renewables, biofuels, and hydrogen into the energy mix, the Advanced Energy [R]evolution scenario sets out an ambitions pathway towards a fully decarbonized energy system by 2050 through much stronger efforts to move energy towards a 100% renewable energy supply. Consumption pathways remain similar to the basic scenario, but faster introduction of technologies leads to complete decarbonization. The IEA’s Current Policies Scenario serves as the reference point in the development of Greenpeace’s Advanced Energy Revolution scenario.
- DDP: The Deep Decarbonization Pathways (DDP) initiative builds and brings to the public debate realistic decarbonization pathways to 2050. These are designed to deeply reduce carbon emissions while satisfying socio-economic objectives. The pathways are developed country by country, considering in each case the specific context and highlighting key drivers of the transformation and their potential effects.
- IRENA: IRENA’s REmap determines the potential for countries, regions and the world to scale up renewables in order to ensure an affordable and sustainable energy future. REmap assesses worldwide renewable energy potential assembled from the bottom-up, starting with country analyses – in collaboration with country experts, and then aggregating these results to arrive at a global picture. REmap accounts for renewable power technologies, but also considers technology options in heating, cooling and transport. In determining the potential to scale up renewables, REmap focuses on possible technologies pathways and assesses numerous other metrics, including: technology, sector and system costs; investment needs; externalities relating to air pollution and climate; CO2 emissions; and economic indicators such as employment and economic growth. Based on these country driven results, REmap provides insights to policy and decision makers for areas in which action is needed.
- BNEF NEO: Bloomberg New Energy Finance’s (BNEF) New Energy Outlook (NEO) focusses on the annual long-term economic analysis of the world’s power sector out to 2050. 2021’s edition presents three scenarios that are aligned with the Paris Agreement, achieving net-zero emissions in 2050. The Green Scenario is a net-zero pathway where so-called ‘green hydrogen’ complements greater electricity use, recycling and bioenergy. The Grey Scenario assumes greater use of electricity and renewable power is complemented by carbon capture and storage technology and allows for the continued use of some fossil fuels. The Red Scenario assumes smaller, modular nuclear is deployed to complement wind, solar and battery technology in the power sector, with dedicated nuclear plants manufacturing so-called “red hydrogen”.
- RCP 1.9: Representative Concentration Pathway (RCP) 1.9 is the IPCC’s lowest emission pathway that focuses on limiting warming to below 1.5°C by the end of the century, which is the aspirational goal of the Paris Agreement. RCPs provide a quantitative description of atmospheric pollutions over time, as well as radiative forces in 2100. In RCP 1.9, radiative forcing is limited to no more than 1.9 W/m2 above pre-industrial levels.
- RCP 2.6: In RCP 2.6, radiative forcing peaks at 3.1 W/m2 before returning to 2.6 W/m2 by 2100, achieved through; a shift to renewable energy sources; CO2 remaining at today’s level until 2020, then decline and becoming negative in 2100; and CO2 concentrations peaking by 2050, followed by a modest decline to around 400 ppm by 2100.
- RCP 3.4: RCP 3.4 represents the IPCC’s intermediate pathway between the very stringent RCP2.6 and the less stringent mitigation efforts associated with RCP4.5.
- RCP 4.5: RCP 4.5 represents one of IPCC’s intermediate stabilization pathways in which radiative forcing is stabilized at approximately 4.5 W/m2 after 2100.
- RCP 6.0: RCP 6.0 represents one of IPCC’s intermediate stabilization pathways in which radiative forcing is stabilized at approximately 6.0 W/m2 after 2100.
- RCP 7.0: RCP 7.0 consists of a baseline outcome rather than a mitigation target, and represents the medium-to-high end of the range of future emissions and warming resulting from no additional climate policy.
- RCP 8.5: RCP 8.5 represents the IPCC’s high-end pathway in which radiative forcing reaches greater than 8.5 W/m2 by 2100, and continues to rise for some time afterwards.
- Transition risks
- Current and emerging regulation – policy developments that attempt to constrain actions that contribute to the adverse effects of climate change or policy developments that seek to promote adaptation to climate change;
- Technology – all risks associated with technological improvements or innovations that support the transition to a lower-carbon, energy-efficient economic system;
- Legal – all climate-related litigation claims;
- Market – all shifts in supply and demand for certain commodities, products, and services;
- Reputation – all risks tied to changing customer or community perceptions of a public authority’s contribution to or detraction from the transition to a lower-carbon economy.
- Physical risks
- Acute – risks that are event-driven, including increased severity of extreme weather events, such as cyclones, hurricanes, or floods;
- Chronic – longer-term shifts in climate patterns (e.g., sustained higher temperatures) that may cause sea level rise or chronic heat waves.
PA4 Targets
Emissions targets
(PA4.1) Does your public authority have an emissions reduction target(s)? If so, select the type(s) of emissions reduction target.
Rationale
Target setting provides direction and structure to environmental strategy. CDP data users want to understand public authorities’ commitments to reducing emissions and whether the public authority has a goal towards which they are harmonizing and focusing emissions-related efforts.
Connection to other frameworks
TCFD
Metrics & Targets recommended disclosure c) Describe the targets used by the organization to manage climate-related risks and opportunities and performance against targets.
SDG
Goal 7: Affordable and clean energy
Goal 12: Responsible consumption and production
Select all that apply:
- Absolute target
- Intensity target
- No target
Requested content
General
- Targets that are based on a future “business as usual” year are not equivalent to emissions reduction targets and therefore should not be reported here. Acceptable targets must determine emissions reductions through comparison to a set base year in the past, not to a projected “business as usual” emissions figure in the future.
- You have an “active target” if the target ends in or after the reporting year and the target is to reduce absolute emissions or emissions intensity.
- Absolute target: an absolute target describes a reduction in actual emissions in a future year when compared to a base year. The target can relate to your Scope 1, Scope 2 and/or Scope 3 emissions in full or in part.
- Intensity target: an intensity target describes a future reduction in emissions that have been normalized to a business metric when compared to the same normalized business metric emissions in a base year. The target can relate to your Scope 1, Scope 2 and/or Scope 3 emissions in full or in part.
Note for electric utility sector companies:
- Investors request that public authorities disclose public authority-wide targets and, where applicable, at divisional level, and that intensity targets are also expressed as absolute targets where possible.
Additional information
Examples of emissions reduction targets
The following are examples of absolute targets:
- Metric tons CO2e or % reduction from base year
- Metric tons CO2e or % reduction in product use phase relative to base year
- Metric tons CO2e or % reduction in supply chain relative to base year
- Metric tons CO2e or % reduction per year
- Metric tons CO2e or % reduction relative to 5 year rolling average of emissions
- Cap on emissions in metric CO2e
The following are examples of intensity targets:
- Metric tons CO2e or % reduction per unit revenue (also per unit turnover; per unit gross sales) relative to base year
- Metric tons CO2e or % reduction per full-time employee equivalent (also per hours worked; per operating hour; per guest night; per capita; per patient days) relative to base year
- Metric tons CO2e or % reduction per unit of product (e.g. metric ton of paper; metric ton of aluminum) relative to base year
- Metric tons CO2e or % reduction per passenger kilometer (also per km; per nautical mile) relative to base year
- Metric tons CO2e or % reduction per square foot relative to base year
- Cap on emissions relative to an activity (e.g. stabilizing emissions at x metric tons CO2e per metric to of steel produced)
- Metric tons CO2e or % reduction per MWh
- Metric tons CO2e or % reduction in emissions from business flights per employee
(PA4.1a) Provide details of your absolute emissions target(s) and progress made against those targets.
Question dependencies
This question only appears if you select “Absolute target” in response to PA4.1.
Rationale
The question is aimed at encouraging best practice in target setting, such as the use of science-based targets where available.
Connection to other frameworks
TCFD
Metrics & Targets recommended disclosure c) Describe the targets used by the organization to manage climate-related risks and opportunities and performance against targets.
SDG
Goal 7: Affordable and clean energy Goal 12: Responsible consumption and production Goal 13: Climate actionResponse options
Please complete the following table. The table is displayed over several rows for readability. You are able to add rows by using the “Add Row” button at the bottom of the table.
| Target reference number | Year target was set | Target coverage | Scope(s) | Scope 2 accounting method | Scope 3 category(ies) | Base year |
|---|---|---|---|---|---|---|
| Abs1-Abs100 |
Numerical field [enter a number between 1900- 2022] |
Select from:
|
Select all that apply:
|
Select from:
|
Select all that apply:
|
Numerical field [enter a number between 1900- 2022] |
| Base year Scope 1 emissions covered by target (metric tons CO2e) | Base year Scope 2 emissions covered by target (metric tons CO2e) | Base year Scope 3 emissions covered by target (metric tons CO2e) | Total base year emissions covered by target in all selected Scopes (metric tons CO2e) | Base year Scope 1 emissions covered by target as % of total base year emissions in Scope 1 | Base year Scope 2 emissions covered by target as % of total base year emissions in Scope 2 | Base year Scope 3 emissions covered by target as % of total base year emissions in Scope 3 (in all Scope 3 categories) |
|---|---|---|---|---|---|---|
| Numerical field [enter a number from 0-999,999,999,999 using a maximum of 2 decimal places and no commas] | Numerical field [enter a number from 0-999,999,999,999 using a maximum of 2 decimal places and no commas] | Numerical field [enter a number from 0-999,999,999,999 using a maximum of 2 decimal places and no commas] | Numerical field [enter a number from 0-999,999,999,999 using a maximum of 2 decimal places and no commas] | Percentage field [enter a percentage from 0-100 using a maximum of 2 decimal places] | Percentage field [enter a percentage from 0-100 using a maximum of 2 decimal places] | Percentage field [enter a percentage from 0-100 using a maximum of 2 decimal places] |
| Base year emissions covered by target in all selected Scopes as % of total base year emissions in all selected Scopes | Target year | Targeted reduction from base year (%) |
Total emissions in target year covered by target in all selected Scopes (metric tons CO2e)
[auto-calculated] |
Scope 1 emissions in reporting year covered by target (metric tons CO2e) | Scope 2 emissions in reporting year covered by target (metric tons CO2e) | Scope 3 emissions in reporting year covered by target (metric tons CO2e) |
|---|---|---|---|---|---|---|
| Percentage field [enter a percentage from 0-100 using a maximum of 2 decimal places] | Numerical field [enter a whole number between 2017- 2100] | Percentage field [enter a percentage from 0-100 using a maximum of 2 decimal places] | Numerical field [0-999,999,999,999] | Numerical field [enter a number from 0-999,999,999,999 using a maximum of 2 decimal places and no commas] | Numerical field [enter a number from 0-999,999,999,999 using a maximum of 2 decimal places and no commas] | Numerical field [enter a number from 0-999,999,999,999 using a maximum of 2 decimal places and no commas] |
| Total emissions in reporting year covered by target in all selected scopes (metric tons CO2e) | % of target achieved relative to base year [auto-calculated] | Target status in reporting year | Is this a science-based target? | Target ambition | Alignment with Nationally Determined Contribution | Please explain target coverage and identify any exclusions | Plan for achieving target, and progress made to the end of the reporting year | List the emissions reduction initiatives which contributed most to achieving this target |
|---|---|---|---|---|---|---|---|---|
| Numerical field [enter a number from 0-999,999,999,999 using a maximum of 2 decimal places and no commas] | Percentage field | Select from:
| Select from drop-down options below | Select from:
| Select from:
| Text field [maximum 2,400 characters] | Text field [maximum 2,500 characters] | Text field [maximum 2,500 characters] |
[Add Row]
Is this a science-based target? drop-down options:
Select one of the following options:
- Yes, and this target has been approved by the Science Based Targets initiative
- Yes, we consider this a science-based target, and the target is currently being reviewed by the Science Based Targets initiative
- Yes, we consider this a science-based target, and we have committed to seek validation of this target by the Science Based Targets initiative in the next two years
- No, but we are reporting another target that is science-based
- No, but we anticipate setting one in the next 2 years
- No, and we do not anticipate setting one in the next 2 years
Requested content
General
- Note that CDP is requesting data on gross emissions targets. Gross means total emissions before any deductions or other adjustments are made to take account of offset credits, avoided emissions, and/or reductions attributable to the sequestration or transfer of GHGs (except in a specific case of bioenergy use for science-based targets – see “Additional information” for more details).
- If you have a target that will be met in part by offsetting (including carbon neutrality targets), or CO2 removals except for the bioenergy case specified in “Additional information”, only the proportion of the target that relates to emissions reductions (and not offset purchases or CO2 removals) should be reported here. If you are uncertain of the proportion that will be achieved through emissions reductions, make an estimation based on the initiatives that you have in place or planned. Targets to reduce emissions in the product use phase or to reduce emissions from the supply chain should be captured as Scope 3 targets.
Target reference number (column 1)
- Select a unique target reference from the drop-down menu provided to identify the target in subsequent questions and to track progress against the target in subsequent reporting years.
- If you reported a target to CDP last year and will be reporting progress against the same target this year, ensure you use the same target reference number as last year. For any new targets you are adding, always use a new reference number that you have not used previously.
Year target was set (column 2)
- Enter the year in which your public authority set the target.
- This must be either before or during the reporting year but cannot be after the reporting year. It also cannot be after the target year.
- If you have a year-on-year rolling target, enter the year you first set the target. This can be before the base year.
- If you set the target based on financial years, enter the year that applies to the end of your financial year and specify this in the “Please explain target coverage and identify any exclusions” column.
Target coverage (column 3)
- It is considered best practice to report one overarching target covering total public authority-wide Scope 1 and 2 emissions. Sub-targets may also be reported in additional rows.
- If the target does not apply to the whole public authority, select the option that best describes the coverage of the target, and provide further details in the “Please explain target coverage and identify any exclusions” column. E.g. if your target applies only to your operations in a particular region, specify the region in the “Please explain target coverage and identify any exclusions” column.
Scope(s) (column 4)
- This refers to the Scope(s) of emissions to which the target relates. Note that the target does not have to comprise all emissions within a particular Scope.
Scope 2 accounting method (column 5)
- This column only appears if you select “Scope 2” in column 4 “Scope(s)”.
- Indicate whether the target relates to your location-based or market-based Scope 2 emissions.
Scope 3 category(ies) (column 6)
- This column only appears if you select “Scope 3” in column 4 “Scope(s)”.
- Select the Scope 3 emissions category(ies) that relate to this target.
- The categories of Scope 3 emissions have been taken from the Greenhouse Gas Protocol’s Corporate Value Chain (Scope 3) Accounting and Reporting Standard. Refer to the Standard for additional information on the sources that each category comprises and how to calculate these emissions. If you are specifying a Scope 3 source under “Other, please specify” please make it clear whether it is an upstream or downstream source.
Base year (column 7)
- The base year is the year against which you are comparing your emissions reduction target
- If you have a year-on-year rolling target, the base year will be the previous reporting year.
- If you have a target based on financial years, enter the year that applies to the end of your financial year and specify this in the “Please explain target coverage and identify any exclusions” column.
- If you have a target based on average emissions over a period of time (e.g. 5-year average), enter the year that applies to the end of the average period and specify this in the “Please explain target coverage and identify any exclusions” column.
- You cannot have a base year that is in the future.
Base year Scope 1 emissions covered by target (metric tons CO2e) (column 8)
- This column only appears if you select “Scope 1” in column 4 “Scope(s)”.
- Enter the base year Scope 1 emissions covered by the target in this column.
- If the target encompasses multiple Scopes, this figure should be based upon the Scope 1 proportion only.
- E.g. if your target is to reduce Scope 1+2 emissions arising from your European operations, enter the base year Scope 1 emissions for your European operations in this column.
Base year Scope 2 emissions covered by target (metric tons CO2e) (column 9)
- This column only appears if you select “Scope 2” in column 4 “Scope(s)”.
- Enter the base year Scope 2 emissions covered by the target in this column.
- If the target encompasses multiple Scopes, this figure should be based upon the Scope 2 proportion only.
- E.g. if your target relates to Scope 1+2+3 public authority-wide emissions, enter your Scope 2 public authority-wide base year emissions in this column.
Base year Scope 3 emissions covered by target (metric tons CO2e) (column 10)
- This column only appears if you select “Scope 3” in column 4 “Scope(s)”.
- This figure should be the total Scope 3 base year emissions covered by the target for the Scope 3 category(ies) selected in column 6.
- If the target encompasses multiple Scopes, this figure should be based upon the Scope 3 proportion only.
- E.g. if your target relates to Scope 1+2+3 emissions of a particular business activity (e.g. office-based operations, etc.), enter the base year Scope 3 emissions relating to that business activity for the Scope 3 category(ies) selected in column 6 in this column.
Total base year emissions covered by target in all selected Scopes (metric tons CO2e) (column 11)
- This figure should be the total base year emissions covered by the target in all Scopes selected in column 4.
- E.g. if your target relates to Scope 1+2+3 public authority-wide emissions, enter your Scope 1+2+3 public authority-wide base year emissions in this column.
- If the target relates to a single Scope, this figure will be the same as the figure reported in either column 8, column 9, or column 10.
- If the target encompasses multiple Scopes, this figure will be equal to the sum of the figures reported in columns 8, 9 and/or 10
Base year Scope 1 emissions covered by target as % of total base year emissions in Scope 1 (column 12)
- This column only appears if you select “Scope 1” in column 4 “Scope(s)”.
- Enter the base year Scope 1 emissions covered by the target (reported in column 8) as a percentage of your total public authority-wide base year emissions in Scope 1.
- If the target encompasses multiple Scopes, this percentage should be based upon the Scope 1 proportion only.
- E.g. if your target is to reduce Scope 1+2 emissions arising from your European operations, and the Scope 2 emissions from your European operations accounted for 80% of your total, public authority-wide Scope 1 emissions in the base year, then you should enter 80 into this column.
- Note that entering a value of 100% indicates that the target covers your public authority’s total, global gross emissions in the base year for Scope 1.
Base year Scope 2 emissions covered by target as % of total base year emissions in Scope 2 (column 13)
- This column only appears if you select “Scope 2” in column 4 “Scope(s)”.
- Enter the base year Scope 2 emissions covered by the target (reported in column 9) as a percentage of your total public authority-wide base year emissions in Scope 2.
- If the target encompasses multiple Scopes, this percentage should be based upon the Scope 2 proportion only.
- E.g. if your target relates to Scope 1+2+3 emissions of a particular business activity (e.g. office-based operations, etc.), and the Scope 2 emissions from that business activity accounted for 20% your total, public authority-wide Scope 2 emissions in the base year, then you should enter 20 into this column.
- Note that entering a value of 100% indicates that the target covers your public authority’s total, global gross emissions in the base year for Scope 2.
Base year Scope 3 emissions covered by target as % of total base year emissions in Scope 3 (in all Scope 3 categories) (column 14)
- This column only appears if you select “Scope 3” in column 4 “Scope(s)”.
- Enter the base year Scope 3 emissions covered by the target (reported in column 10) as a percentage of your total public authority-wide base year emissions for all Scope 3 categories calculated in the base year.
- E.g. If you have selected only one Scope 3 category in column 6 (e.g. “Business travel”), you should enter the base year emissions in that category covered by the target as a percentage of your total base year Scope 3 emissions as a whole.
- If the target encompasses multiple Scopes, this percentage should be based upon the Scope 3 proportion only.
- Note that entering a value of 100% indicates that the target covers your public authority’s total, global gross emissions in the base year for Scope 3.
Base year emissions covered by target in all selected Scopes as % of total base year emissions in all selected Scopes (column 15)
- Enter the total base year emissions covered by the target (reported in column 11) as a percentage of your total public authority-wide base year emissions in all Scopes selected in column 4.
- If the target encompasses multiple Scopes, note that you should not sum the percentages reported in columns 12, 13 and/or 14.
- E.g. if your target relates to Scope 1+2+3 emissions for your UK operations, and the Scope 1+2+3 emissions from your UK operations accounted for 10% your total, public authority-wide Scope 1+2+3 emissions in the base year, then you should enter 10 into this column.
- If the target relates to a single Scope, this figure will be the same as the figure reported in either column 12, column 13, or column 14.
- Note that entering a value of 100% indicates that the target covers your public authority’s total, global gross emissions in the base year for all Scopes selected in column 4.
Target year (column 16)
- If you have a year-on-year rolling target, the target year will be the reporting year.
- If you have a target based on financial years, enter the year that applies to the end of your financial year and specify in the “Please explain target coverage and identify any exclusions” column.
- If you have a target based on average emissions over a period of time (e.g. 5-year average), enter the year that applies to the end of the average period and specify this in the “Please explain target coverage and identify any exclusions” column.
Targeted reduction from base year (%) (column 17)
- Enter your targeted emissions reduction as a percentage reduction in emissions in all Scopes relevant to the target to be achieved in the target year, when compared to the base year.
- E.g. if your target is to reduce your Scope 1+2 emissions by 3000 metric tons CO2e and your base year Scope 1+2 emissions were 150,000 metric tons CO2e, you should enter 2 into this column (i.e. (3000/150000)=0.02; then multiply by 100 for percentage value).
- If your target is to stabilize emissions at the base year level, you should enter 0 in this column.
- Note that this column is intended to describe the targeted percentage reduction from the base year that is to be achieved in the target year, and not the percentage reduction from the base year observed in the reporting year.
Total emissions in target year covered by target in all selected Scopes (metric tons CO2e) [auto-calculated] (column 18)
- This column will be auto-calculated in the ORS.
- The total emissions in your target year covered by the target will be calculated from the “Total base year emissions covered by target in all selected Scopes” (column 11) and the “Targeted reduction from base year” (column 17) columns. Ensure that you have entered data into these columns.
- E.g. if your base year emissions were 150,000 metric tons CO2e, and your targeted reduction is 2%, this column will display 147,000.
Scope 1 emissions in reporting year covered by target (metric tons CO2e) (column 19)
- This column only appears if you select “Scope 1” in column 4 “Scope(s)”.
- Enter the Scope 1 emissions in the reporting year covered by the target in this column.
- If the target encompasses multiple Scopes, this figure should be based upon the Scope 1 proportion only.
- E.g. if your target is to reduce Scope 1+2 emissions arising from your European operations, enter the Scope 1 emissions in the reporting year for your European operations in this column.
Scope 2 emissions in reporting year covered by target (metric tons CO2e) (column 20)
- This column only appears if you select “Scope 2” in column 4 “Scope(s)”.
- Enter the Scope 2 emissions in the reporting year covered by the target in this column.
- If the target encompasses multiple Scopes, this figure should be based upon the Scope 2 proportion only.
- E.g. if your target relates to Scope 1+2+3 public authority-wide emissions, enter your Scope 2 public authority-wide emissions in the reporting year in this column.
Scope 3 emissions in reporting year covered by target (metric tons CO2e) (column 21)
- This column only appears if you select “Scope 3” in column 4 “Scope(s)”.
- This figure should be the total Scope 3 emissions in the reporting year covered by the target for the Scope 3 category(ies) selected in column 6.
- If the target encompasses multiple Scopes, this figure should be based upon the Scope 3 proportion only.
- E.g. if your target relates to Scope 1+2+3 emissions of a particular business activity (e.g. office-based operations, etc.), enter the Scope 3 emissions in the reporting year relating to that business activity for the Scope 3 category(ies) selected in column 6 in this column.
Total emissions in reporting year covered by target in all selected Scopes (metric tons CO2e) (column 22)
- This figure should be the total emissions in the reporting year covered by the target in all Scopes selected in column 4.
- E.g. if your target relates to Scope 1+2+3 public authority-wide emissions, enter your Scope 1+2+3 public authority-wide emissions in the reporting year in this column.
- If the target relates to a single Scope, this figure will be the same as the figure reported in either column 19, column 20, or column 21.
- If the target encompasses multiple Scopes, this figure will be equal to the sum of the figures reported in columns 19, 20 and/or 21.
% of target achieved relative to base year [auto-calculated] (column 23)
- This column will be auto-calculated in the ORS.
- The target’s percentage completion (in terms of emissions) relative to the base year will be calculated from the “Total base year emissions covered by target in all selected Scopes” (column 11), “Targeted reduction from base year” (column 17) and the “Total emissions in reporting year covered by target in all selected Scopes” (column 22) columns. Ensure that you have entered data into these columns.
- E.g. if your target is to reduce your Scope 1 emissions by 10% and in the reporting year your Scope 1 emissions had reduced by 3% compared to the base year, this column will display 30 as your target is 30% complete.
- Negative values indicate an increase in emissions relative to the base year.
- Values greater than 100 indicate that you have exceeded your target.
- This column will not appear if you set a target to stabilize your greenhouse gas emissions at the base year level, i.e. if you have entered 0 (zero) in column “Targeted reduction from base year (%)” (column 17).
Target status in reporting year (column 24)
- New - Select this option for targets that have been set in the reporting year and are still in progress.
- Underway - Select this option for targets that were set before the reporting year, with a target year in the future, that have not been achieved and continue to be pursued.
- Achieved - Select this option for targets that have been achieved or exceeded in the reporting year.
- Expired - Select this option for targets with a target year of the reporting year, that have not been achieved and have therefore expired in the reporting year.
- Revised - Select this option for targets that were set before the reporting year but a revision has been made to any of the elements in columns 2 to 22 in the reporting year, for example due to a recalculation of the base year emissions or a change to the target year.
- Replaced - Select this option for previously reported targets that have been replaced with another target in the reporting year, for example where a facility target has been incorporated into a public authority-wide target.
- Retired - Select this option for targets with a target year in the future, that have not been achieved, but will no longer be pursued. Provide more information as to why this target was retired in the “Please explain target coverage and identify any exclusions” column.
Is this a science-based target? (column 25)
- A brief description of science-based targets and why CDP is asking public authorities to set them is provided as additional information to this question.
- In addition, refer to the CDP Technical Note on Science-Based Targets for what qualifies as a science-based target and how to assess your target against the Science Based Targets initiative’s criteria.
- Yes, and this target has been approved by the Science Based Targets initiative – Companies are very strongly encouraged to have their targets officially evaluated by the Science Based Targets initiative (SBTi). CDP considers targets approved by the initiative to reflect best practice in science-based target setting. Select this option only if the target has been approved by the SBTi.
- Yes, we consider this a science-based target, and the target is currently being reviewed by the Science Based Targets initiative – If your public authority has set a target and has self-assessed it to be science-based, and it has been submitted to the SBTi for validation and is currently being reviewed by the SBTi, you should select this option. You should use the “Please explain target coverage and identify any exclusions” column to explain why you believe your target to be science-based.
- Yes, we consider this a science-based target, and we have committed to seek validation of this target by the Science Based Targets initiative in the next two years – Not all companies have had their target assessed by the SBTi. If your public authority has set a target and has self-assessed it to be science-based but has not yet submitted it to the SBTi for validation, you should select this option. You should use the “Please explain target coverage and identify any exclusions” column to explain why you believe your target to be science-based. If you are currently in the process of revising your target to meet SBTi criteria, indicate this by selecting “No, but we anticipate setting one in the next 2 years.
- No, but we are reporting another target that is science-based: Another target (absolute or intensity) disclosed is science-based, either in another row in this table, or in C4.1b.
- No, but we anticipate setting one in the next 2 years: While not necessary, it is recommended that the public authority publicly state this by submitting a Science Based Target initiative commitment letter.
- No, and we do not anticipate setting one in the next 2 years: No science-based targets have been set and there are no plans in place to set one in the next 2 years.
Target ambition (column 26)
- This column only appears if you select any “Yes” option in column 25 “Is this a science-based target?”.
- Select the level of ambition of your science-based target. Note that as of July 2022, the SBTi requires Scope 1 and 2 targets to be consistent with the level of decarbonization required to keep global temperature increase to 1.5°C compared to pre-industrial temperatures, and Scope 3 targets to be consistent with the level of decarbonization required to keep global temperature increase to well-below 2°C compared to pre-industrial temperatures.
Please explain target coverage and identify any exclusions (column 27)
- If the target is not public authority-wide (i.e. it does not apply to the whole public authority in line with your definition of the reporting boundary), provide further details of your target coverage in this column. E.g. if you have selected “Country/region” in column 3, please specify which countries/regions your target covers.
- If your target is science-based, please specify if CO2 emissions and/or removals from bioenergy are relevant for your public authority and, if so, how you have included them in your target boundary. Please refer to the “Additional Information” for more details.
- You can use this column to identify where you have a financial year or average year-based target.
- If your target was originally in a different format, you may wish to give the original target before it was converted into the format required for the purposes of this table.
- If your target is part of a wider carbon neutrality goal, a regulatory requirement, or a longer-term target, you can also explain this here.
Plan for achieving target, and progress made to the end of the reporting year (column 28)
- This column only appears if you select “Underway”, “Revised”, or “New” in column 24 “Target status in reporting year”.
- Describe how you plan to achieve the target, including any emissions reduction initiatives your public authority plans to implement.
- List the emissions reduction initiatives which have contributed most to any progress towards the target to the end of the reporting year (as indicated in column 23).
- If you are not on track to achieve the target, explain how you plan to get back on track.
- If possible, specify your anticipated and/or observed progress curve in this column, i.e.:
- Linear – the rate of progress towards the target is anticipated and/or observed to be steady over time
- Logarithmic – the rate of progress towards the target is anticipated and/or observed to be faster at the start
- Exponential – the rate of progress towards the target is anticipated and/or observed to be faster at the end
- Variable – the rate of progress towards the target is anticipated and/or observed to change from year to year
Additional information
Science-based targets
- Nearly 200 nations at COP21 wrote into the Paris Agreement that globally we will aim to limit warming to below 2°C and pursue efforts to limit warming to under 1.5°C. However, there is a large gap between the level of ambition of the country commitments and targeted temperatures.
- Science-based target setting methods enable public authorities to set emissions targets that are consistent with conserving the remaining global emissions budget. A number of factors are taken into consideration in order to determine what is most appropriate for a given public authority. Please see the Technical Note on Science Based Targets for information on best practices in target setting and what CDP considers a science-based target.
- Public authorities are very strongly encouraged to have their targets officially evaluated by the Science Based Targets initiative (SBTi). CDP considers targets approved by the initiative to reflect best practices in science-based target setting.
- Public authorities are very strongly encouraged to have their targets officially evaluated by the Science Based Targets initiative (SBTi). CDP considers targets approved by the initiative to reflect best practices in science-based target setting.
Science-based targets — bioenergy accounting
- As per the GHG Protocol Corporate Standard, CO2 emissions from the combustion, processing, and distribution of bioenergy and the land use emissions and removals associated with bioenergy feedstocks, should be reported alongside an organization's GHG inventory, separately from the Scopes. However, SBTi criterion 10 requires CO2 emissions from the combustion, processing and distribution of bioenergy and the land use emissions and removals associated with bioenergy feedstocks to be included in the target boundary when setting a science-based target (in Scopes 1, 2 and/or 3, as relevant) and when reporting progress against that target, even though such CO2 emissions and/or removals are reported separately in an organization's GHG inventory. Companies are expected to adhere to any additional GHG Protocol Guidance on bioenergy accounting when released in order to maintain compliance with criterion 10.
(PA4.1b) Provide details of your emissions intensity target(s) and progress made against those target(s).
Question dependencies
This question only appears if you select “Intensity target” in response to PA4.1.
Connection to other frameworks
TCFD
Metrics & Targets recommended disclosure c) Describe the targets used by the organization to manage climate related risks and opportunities and performance against targets.
SDG
Goal 7: Affordable and clean energy
Goal 12: Responsible consumption and production
Goal 13: Climate action
Response options
Please complete the following table. The table is displayed over several rows for readability. You are able to add rows by using the “Add Row” function at the bottom of the table.
| Target reference number | Year target was set | Target coverage | Scope(s) | Scope 2 accounting method | Scope 3 category(ies) | Intensity metric |
|---|---|---|---|---|---|---|
| Int1-Int100 | Numerical field [enter a number between 1900- 2022] | Select from:
|
Select all that apply:
|
Select from:
|
Select all that apply:
|
Select from drop-down options below |
| Base year | Intensity figure in base year for Scope 1 (metric tons CO2e per unit of activity) | Intensity figure in base year for Scope 2 (metric tons CO2e per unit of activity) | Intensity figure in base year for Scope 3 (metric tons CO2e per unit of activity) | Intensity figure in base year for all selected Scopes (metric tons CO2e per unit of activity) | % of total base year emissions in Scope 1 covered by this Scope 1 intensity figure | % of total base year emissions in Scope 2 covered by this Scope 2 intensity figure |
|---|---|---|---|---|---|---|
| Numerical field [enter a number between 1900- 2022] | Numerical field [enter a number from 0- 999,999,999,999 using a maximum of 10 decimal places and no commas] | Numerical field [enter a number from 0- 999,999,999,999 using a maximum of 10 decimal places and no commas] | Numerical field [enter a number from 0- 999,999,999,999 using a maximum of 10 decimal places and no commas] | Numerical field [enter a number from 0- 999,999,999,999 using a maximum of 10 decimal places and no commas] | Percentage field [enter a percentage from 0-100 using a maximum of 2 decimal places] | Percentage field [enter a percentage from 0-100 using a maximum of 2 decimal places] |
| % of total base year emissions in Scope 3 (in all Scope 3 categories) covered by this Scope 3 intensity figure | % of total base year emissions in all selected Scopes covered by this intensity figure | Target year |
Targeted reduction from base year (%) | Intensity figure in target year for all selected Scopes (metric tons CO2e per unit of activity)
[auto-calculated] |
% change anticipated in absolute Scope 1+2 emissions |
% change anticipated in absolute Scope 3 emissions |
|---|---|---|---|---|---|---|
| Percentage field [enter a percentage from 0-100 using a maximum of 2 decimal places] | Percentage field [enter a percentage from 0-100 using a maximum of 2 decimal places] |
Numerical field [enter a number between 2017- 2100] |
Percentage field [enter a percentage from 0-100 using a maximum of 2 decimal places] |
Numerical field [0-999,999,999,999] |
Percentage field [enter a percentage from -999-999 using a maximum of 2 decimal places] | Percentage field [enter a percentage from -999-999 using a maximum of 2 decimal places] |
| Intensity figure in reporting year for Scope 1 (metric tons CO2e per unit of activity) | Intensity figure in reporting year for Scope 2 (metric tons CO2e per unit of activity) | Intensity figure in reporting year for Scope 3 (metric tons CO2e per unit of activity) | Intensity figure in reporting year for all selected Scopes (metric tons CO2e per unit of activity) | % of target achieved relative to base year [auto-calculated] | Target status in reporting year | Is this a science-based target? |
|---|---|---|---|---|---|---|
| Numerical field [enter a number from 0-999,999,999,999 using a maximum of 10 decimal places and no commas] | Numerical field [enter a number from 0-999,999,999,999 using a maximum of 10 decimal places and no commas] | Numerical field [enter a number from 0-999,999,999,999 using a maximum of 10 decimal places and no commas] | Numerical field [enter a number from 0-999,999,999,999 using a maximum of 10 decimal places and no commas] | Percentage field | Select from:
|
Select from drop-down options below |
| Target ambition | Alignment with Nationally Determined Contribution | Please explain target coverage and identify any exclusions | Plan for achieving target, and progress made to the end of the reporting year | List the emissions reduction initiatives which contributed most to achieving this target |
|---|---|---|---|---|
Select from:
| Select from:
|
Text field [maximum 2,400 characters] | Text field [maximum 2,400 characters] | Text field [maximum 2,400 characters] |
[Add row]
Intensity metric drop-down options:
Select one of the following options:
- Grams CO2e per revenue passenger kilometer
- Metric tons CO2e per USD($) value-added
- Metric tons CO2e per square meter
- Metric tons CO2e per metric ton of aluminum
- Metric tons CO2e per metric ton of steel
- Metric tons CO2e per metric ton of cement
- Metric tons CO2e per metric ton of cardboard
- Grams CO2e per kilometer
- Metric tons CO2e per unit revenue
- Metric tons CO2e per unit FTE employee
- Metric tons CO2e per unit hour worked
- Metric tons CO2e per metric ton of product
- Metric tons of CO2e per liter of product
- Metric tons CO2e per unit of production
- Metric tons CO2e per unit of service provided
- Metric tons CO2e per square foot
- Metric tons CO2e per kilometer
- Metric tons CO2e per passenger kilometer
- Metric tons CO2e per megawatt hour (MWh)
- Metric tons CO2e per barrel of oil equivalent (BOE)
- Metric tons CO2e per vehicle produced
- Metric tons CO2e per metric ton of ore processed
- Metric tons CO2e per ounce of gold
- Metric tons CO2e per ounce of platinum
- Metric tons of CO2e per metric ton of aggregate
- Metric tons of CO2e per billion (currency) funds under management
- Other, please specify
Is this a science-based target? Drop-down options:
Select one of the following options:
- Yes, and this target has been approved by the Science Based Targets initiative
- Yes, we consider this a science-based target, and the target is currently being reviewed by the Science Based Targets initiative
- Yes, we consider this a science-based target, and we have committed to seek validation of this target by the Science Based Targets initiative in the next two years
- No, but we are reporting another target that is science-based
- No, but we anticipate setting one in the next 2 years
- No, and we do not anticipate setting one in the next 2 years
Requested content
General
- Note that CDP is requesting data on gross emissions targets. Gross means total emissions before any deductions or other adjustments are made to take account of offset credits, avoided emissions, and/or reductions attributable to the sequestration or transfer of GHGs (except in a specific case of bioenergy use for science-based targets – see “Additional information” for more details).
- If you have a target that will be met in part by offsetting (including carbon neutrality targets), or CO2 removals except for the bioenergy case specified in “Additional information”, only the proportion of the target that relates to emissions reductions (and not offset purchases or CO2 removals) should be reported here. If you are uncertain of the proportion that will be achieved through emissions reductions, make an estimation based on the initiatives that you have in place or planned.
- Targets to reduce emissions in the product use phase or to reduce emissions from the supply chain should be captured as Scope 3 targets.
Target reference number (column 1)
- Select a unique target reference from the drop-down menu provided to identify the target in subsequent questions and to track progress against the target in subsequent reporting years.
- If you reported a target to CDP last year and will be reporting progress against the same target this year, ensure you use the same target reference number as last year. For any new targets you are adding, always use a new reference number that you have not used previously.
Year target was set (column 2)
- Enter the year in which your public authority set the target.
- This must be either before or during the reporting year but cannot be after the reporting year. It also cannot be after the target year.
- If you have a year-on-year rolling target, enter the year you first set the target. This can be before the base year.
- If you set the target based on financial years, enter the year that applies to the end of your financial year and specify this in the “Please explain target coverage and identify any exclusions” column.
Target coverage (column 3)
- If the target applies to the whole public authority, select “Target covers all public authority divisions, activities and facilities.”
- Note that “public authority” refers collectively to all the companies, businesses, organizations, other entities or groups that fall within your definition of the reporting boundary.
- It is considered best practice to report one overarching target covering total public authority-wide Scope 1 and 2 emissions. Sub-targets may also be reported in additional rows.
- If the target does not apply to the whole public authority, select the option that best describes the coverage of the target, and provide further details in the “Please explain target coverage and identify any exclusions” column. E.g. if your target applies only to your operations within a state or province, select “Country/region” in this column and specify the country/region in the “Please explain target coverage and identify any exclusions” column.
Scope(s) (column 4)
- This refers to the Scope(s) of emissions to which the target relates. Note that the target does not have to comprise all emissions within a particular Scope.
Scope 2 accounting method (column 5)
- This column only appears if you select “Scope 2” in column 4 “Scope(s).”
- Indicate whether the target relates to your location-based or market-based Scope 2 emissions.
Scope 3 category(ies) (column 6)
- This column only appears if you select “Scope 3” in column “Scope(s)”.
- Select the Scope 3 emissions category(ies) that relate to this target.
- The categories of Scope 3 emissions have been taken from the Greenhouse Gas Protocol’s Corporate Value Chain (Scope 3) Accounting and Reporting Standard. Refer to the Standard for additional information on the sources that each category comprises and how to calculate these emissions. If you are specifying a Scope 3 source under “Other, please specify” please make clear whether it is an upstream or downstream source.
Intensity metric (column 7)
- If you select “Other, please specify,” provide a label for the metric.
- This should be in the format “mass CO2 per activity,” as in the drop-down options above.
Base year (column 8)
- The base year is the year against which you are comparing your emissions reduction target
- If you have a year-on-year rolling target, the base year will be the previous reporting year.
- If you have a target based on financial years, enter the year that applies to the end of your financial year and specify this in the “Please explain target coverage and identify any exclusions” column.
- If you have a target based on average emissions over a period of time (e.g. 5-year average), enter the year that applies to the end of the average period and specify this in the “Please explain target coverage and identify any exclusions” column.
- You cannot have a base year that is in the future.
Intensity figure in base year for Scope 1 (metric tons CO2e per unit of activity) (column 9)
- This column only appears if you select “Scope 1” in column 4 “Scope(s)”.
- Enter the Scope 1 emissions intensity figure in the base year covered by the target in this column.
- If the target encompasses multiple Scopes, this figure should be based upon the Scope 1 proportion only.
- Note that the base year Scope 1 emissions intensity figure should be calculated by dividing the base year Scope 1 emissions covered by the target by the intensity metric denominator (e.g. unit revenue, metric ton of product etc).
- E.g. if your target is to reduce your public authority-wide Scope 1+2 emissions per full time equivalent (FTE) employee by 22%, using 2015 as the base year and 2025 as the target year, calculate what your public authority-wide Scope 1 emissions were per FTE in 2015 and enter that figure in this column.
Intensity figure in base year for Scope 2 (metric tons CO2e per unit of activity) (column 10)
- This column only appears if you select “Scope 2” in column 4 “Scope(s)”.
- Enter the Scope 2 emissions intensity figure in the base year covered by the target in this column.
- If the target encompasses multiple Scopes, this figure should be based upon the Scope 2 proportion only.
- Note that the base year Scope 2 emissions intensity figure should be calculated by dividing the base year Scope 2 emissions covered by the target by the intensity metric denominator (e.g. unit revenue, metric ton of product etc).
- E.g. if your target is to reduce your public authority-wide Scope 1+2 emissions per full time equivalent (FTE) employee by 22%, using 2015 as the base year and 2025 as the target year, calculate what your public authority-wide Scope 2 emissions were per FTE in 2015 and enter that figure in this column.
Intensity figure in base year for Scope 3 (metric tons CO2e per unit of activity) (column 11)
- This column only appears if you select “Scope 3” in column 4 “Scope(s)”.
- Enter the Scope 3 emissions intensity figure in the base year covered by the target in this column.
- If the target encompasses multiple Scopes, this figure should be based upon the Scope 3 proportion only.
- Note that the base year Scope 3 emissions intensity figure should be calculated by dividing the base year Scope 3 emissions covered by the target for the Scope 3 category(ies) selected in column 6 by the intensity metric denominator (e.g. unit revenue, metric ton of product etc).
- E.g. if your target is to reduce your public authority-wide Scope 1+2+3 emissions per unit revenue by 46%, using 2018 as the base year and 2027 as the target year, calculate what your public authority-wide emissions per unit revenue were in 2018 for the Scope 3 category(ies) selected in column 6, and enter this figure in this column.
- If your target covers only certain activities within a Scope 3 category (as indicated in column 3 “Target coverage”), you should calculate the base year intensity figure using the base year emissions relating to those activities only, rather than the emissions for the Scope 3 category as a whole.
Intensity figure in base year for all selected Scopes (metric tons CO2e per unit of activity) (column 12)
- Enter the emissions intensity figure in the base year covered by the target for all Scopes selected in column 4 in this column.
- Note that this figure should be calculated by dividing the total base year emissions covered by the target in all Scopes selected in column 4 by the intensity metric denominator (e.g. unit revenue, metric ton of product etc).
- E.g. if your target is to reduce your public authority-wide Scope 1+2 emissions per full time equivalent (FTE) employee by 22%, using 2015 as the base year and 2025 as the target year, calculate what your public authority-wide Scope 1+2 emissions were per FTE in 2015 and enter this figure in this column
- If the target relates to a single Scope, this figure will be the same as the figure reported in either column 9, column 10, or column 11.
% of total base year emissions in Scope 1 covered by this Scope 1 intensity figure (column 13)
- This column only appears if you select “Scope 1” in column 4 “Scope(s)”.
- Enter the base year Scope 1 emissions covered by the target as a percentage of your total public authority-wide base year emissions in Scope 1.
- If the target encompasses multiple Scopes, the percentage should be based upon the Scope 1 proportion only.
- Note that for this calculation you should use the absolute base year Scope 1 emissions covered by the target (i.e. metric tons CO2e), not the Scope 1 intensity figure you reported in column 9 (i.e. metric tons CO2e per unit activity).
- E.g. if your target is to reduce your Scope 1+2 emissions per FTE employee in your European operations only, and the Scope 1 emissions from your European operations accounted for 80% of your total Scope 1 emissions in the base year, then you should enter 80 into this column.
- Note that entering a value of 100% indicates that the target covers your public authority’s total, global gross emissions in the base year for Scope 1.
% of total base year emissions in Scope 2 covered by this Scope 2 intensity figure (column 14)
- This column only appears if you select “Scope 2” in column 4 “Scope(s)”.
- Enter the base year Scope 2 emissions covered by the target as a percentage of your total public authority-wide base year emissions in the Scope 2.
- If the target encompasses multiple Scopes, the percentage should be based upon the Scope 2 proportion only.
- Note that for this calculation you should use the absolute base year Scope 2 emissions covered by the target (i.e. metric tons CO2e), not the Scope 2 intensity figure you reported in column 10 (i.e. metric tons CO2e per unit activity).
- E.g. if your target is to reduce your Scope 1+2 emissions per FTE employee in your European operations only, and the Scope 2 emissions from your European operations accounted for 30% of your total Scope 2 emissions in the base year, then you should enter 30 into this column.
- Note that entering a value of 100% indicates that the target covers your public authority’s total, global gross emissions in the base year for Scope 2.
% of total base year emissions in Scope 3 (in all Scope 3 categories) covered by this Scope 3 intensity figure (column 15)
- This column only appears if you select “Scope 3” in column 4 “Scope(s)”.
- Enter the base year Scope 3 emissions covered by the target as a percentage of your total public authority-wide base year emissions for all Scope 3 categories calculated in the base year.
- E.g. if you have selected only one Scope 3 category (e.g. Business travel), you should enter the base year emissions in that category as a percentage of your total base year Scope 3 emissions as a whole.
- If the target encompasses multiple Scopes, the percentage should be based upon the Scope 3 proportion only.
- Note that for this calculation you should use the absolute base year Scope 3 emissions covered by the target (i.e. metric tons CO2e), not the Scope 3 intensity figure you reported in column 11 (i.e. metric tons CO2e per unit activity).
- E.g. if your target is to reduce your Scope 1+2+3 emissions per unit revenue for a particular business activity only (e.g. office-based operations, etc.), and the Scope 3 emissions from that business activity accounted for 20% your total Scope 3 emissions in the base year, then you should enter 20 into this column.
- Note that entering a value of 100% indicates that the target covers your public authority’s total, global gross emissions in the base year for Scope 3.
% of total base year emissions in all selected Scopes covered by this intensity figure (column 16)
- Enter the total base year emissions covered by the target as a percentage of your total public authority-wide base year emissions in all Scopes selected in column 4.
- Note that for this calculation you should use the absolute base year emissions covered by the target in all selected Scopes (i.e. metric tons CO2e), not the intensity figure you reported in column 12 (i.e. metric tons CO2e per unit activity).
- E.g. if your target is to reduce your Scope 1+2+3 emissions per FTE employee for your UK operations, and the Scope 1+2+3 emissions from your UK operations accounted for 10% your total, public authority-wide Scope 1+2+3 emissions, then you should enter 10 into this column.
- Note that entering a value of 100% indicates that the target covers your public authority’s total, global gross emissions in the base year for all Scopes selected in column 4.
Target year (column 17)
- If you have a year-on-year rolling target, the target year will be the reporting year.
- If you have a target based on financial years, enter the year that applies to the end of your financial year and specify this in the “Please explain target coverage and identify any exclusions” column.
- If you have a target based on average emissions over a period of time (e.g. 5-year average), enter the year that applies to the end of the average period and specify this in the “Please explain target coverage and identify any exclusions” column.
Targeted reduction from base year (%) (column 18)
- Enter your targeted emissions intensity reduction as a percentage reduction of the emissions intensity figure in all Scopes relevant to the target to be achieved in the target year, when compared to the base year.
- E.g. if your target is to reduce your Scope 1+2 emissions per FTE employee to 7 metric tons CO2e per FTE employee and your base year Scope 1+2 intensity figure was 9 metric tons CO2e per FTE employee, you should enter 22 into this column (i.e. ((9-7)/9)=0.22; then multiply by 100 for percentage value).
- If your target is to stabilize your emissions intensity at the base year level, you should enter 0 in this column.
- Note that this column is intended to describe the targeted percentage reduction from the base year that is to be achieved in the target year, not the percentage reduction from the base year observed in the reporting year.
Intensity figure in target year for all selected Scopes (metric tons CO2e per unit of activity) [auto-calculated] (column 19)
- This column will be auto-calculated in the ORS.
- The intensity figure in your target year covered by the target will be calculated from the “Intensity figure in base year for all selected Scopes” (column 12) and the “Targeted reduction from base year” (column 18) columns. Ensure that you have entered data into these columns.
- E.g. if your base year Scope 1+2 intensity figure was 9 metric tons CO2e per FTE employee, and your targeted reduction is 22%, this column will display 7.
% change anticipated in absolute Scope 1+2 emissions (column 20)
- Complete this column if your target relates to Scope 1 and/or Scope 2 emissions. If your target does not relate to Scope 1 and/or Scope 2 emissions, enter 0 (zero) in this column.
- Enter the percentage change in your total absolute gross global Scope 1+2 emissions anticipated, based on the information provided in the previous columns. A positive figure indicates that you anticipate an increase in emissions.
- Note that even if your target only relates to one Scope (i.e. Scope 1 or 2), enter the change anticipated in your Scope 1+2 emissions.
% change anticipated in absolute Scope 3 emissions (column 21)
- Complete this column if your target relates to Scope 3 emissions. If your target does not include Scope 3 emissions, enter 0 (zero) in this column.
- Enter the percentage change in your total absolute global Scope 3 emissions (in all Scope 3 categories) expected, based on the information provided in the previous columns. A positive figure indicates that you anticipate an increase in emissions.
Intensity figure in reporting year for Scope 1 (metric tons CO2e per unit of activity) (column 22)
- This column only appears if you select “Scope 1” in column 4 “Scope(s)”.
- Enter the Scope 1 emissions intensity figure in the reporting year covered by the target in this column.
- If the target encompasses multiple Scopes, this figure should be based upon the Scope 1 proportion only.
- Note that the Scope 1 emissions intensity figure in the reporting year should be calculated by dividing your reporting year Scope 1 emissions covered by the target by the intensity metric denominator (e.g. unit revenue, metric ton of product etc).
- E.g. if your target is to reduce your Scope 1+2 emissions per full time equivalent (FTE) employee from 9 metric tons CO2e to 7 metric tons CO2e and in the reporting year your Scope 1 emissions per FTE employee were 5 metric tons CO2e, enter 5 in this column.
Intensity figure in reporting year for Scope 2 (metric tons CO2e per unit of activity) (column 23)
- This column only appears if you select “Scope 2” in column 4 “Scope(s).”
- Enter the Scope 2 emissions intensity figure in the reporting year covered by the target in this column.
- If the target encompasses multiple Scopes, the percentage should be based upon the Scope 2 proportion only.
- Note that the Scope 2 emissions intensity figure in the reporting year should be calculated by dividing your reporting year Scope 2 emissions covered by the target by the intensity metric denominator (e.g. unit revenue, metric ton of product etc).
- E.g. if your target is to reduce your Scope 1+2 emissions per full time equivalent (FTE) employee from 9 metric tons CO2e to 7 metric tons CO2e and in the reporting year your Scope 2 emissions per FTE employee were 3 metric tons CO2e, enter 3 in this column.
Intensity figure in reporting year for Scope 3 (metric tons CO2e per unit of activity) (column 24)
- This column only appears if you select “Scope 3” in column 4 “Scope(s)”.
- Enter the Scope 3 emissions intensity figure in the reporting year covered by the target in this column.
- If the target encompasses multiple Scopes, the percentage should be based upon the Scope 3 proportion only.
- Note that the Scope 3 emissions intensity figure in the reporting year should be calculated by dividing your total reporting year Scope 3 emissions covered by the target for the Scope 3 category(ies) selected in column 6 by the intensity metric denominator (e.g. unit revenue, metric ton of product etc).
- E.g. if your target is to reduce your public authority-wide Scope 1+2+3 emissions per unit revenue from from 16 metric tons CO2e to 5 metric tons CO2e and in the reporting year your Scope 3 emissions per unit revenue for the Scope 3 category(ies) selected in column 6 were 2 metric tons CO2e, enter 2 in this column.
- If your target covers only certain activities within a Scope 3 category (as indicated in column 3 “Target coverage”), you should calculate the intensity figure in the reporting year using the reporting year emissions relating to those activities only, rather than the emissions for the Scope 3 category as a whole.
Intensity figure in reporting year for all selected Scopes (metric tons CO2e per unit of activity) (column 25)
- Enter the emissions intensity figure in the reporting year covered by the target for all Scopes selected in column 4 in this column.
- Note that this intensity figure should be calculated by dividing your total reporting year emissions covered by the target in all Scopes selected in column 4 by the intensity metric denominator (e.g. unit revenue, metric ton of product etc).
- E.g. if your target is to reduce your public authority-wide Scope 1+2 emissions per full time equivalent (FTE) employee from 9 metric tons CO2e to 7 metric tons CO2e and in the reporting year your Scope 1+2 emissions per FTE employee were 8 metric tons CO2e, enter 8 in this field.
- If the target relates to a single Scope, this figure will be the same as the figure reported in either column 22, column 23, or column 24.
% of target achieved relative to base year [auto-calculated] (column 26)
- This column will be auto-calculated in the ORS.
- The target’s percentage completion (in terms of emissions) relative to the base year will be calculated from the “Intensity figure in base year for all selected Scopes” (column 12), “Targeted reduction from base year” (column 18), and the “Intensity figure in reporting year for all selected Scopes” (column 25) columns. Ensure you have entered data into these columns.
- E.g. if your target is to reduce your Scope 1+2 emissions per FTE employee by 22% and in the reporting year your Scope 1+2 emissions per FTE employee had reduced by 11% compared to the base year, this column will display 50 as your target is 50% complete.
- Negative values indicate an increase in the emissions intensity figure compared to the base year.
- Values greater than 100 incidate that you have exceeded your target.
- This column will not appear if you set a target to stabilize your emissions intensity at the base year level, i.e. if you have entered 0 (zero) in column “Targeted reduction from base year (%)” (column 18).
Target status in reporting year (column 27)
- New – Select this option for targets that have been set in the reporting year and are still in progress.
- Underway – Select this option for targets that were set before the reporting year, with a target year in the future, that have not been achieved and continue to be pursued.
- Achieved – Select this option for targets that have been achieved or exceeded in the reporting year.
- Expired – Select this option for targets with a target year of the reporting year, that have not been achieved and have therefore expired in the reporting year.
- Revised – Select this option for targets that were set before the reporting year but a revision has been made to any of the elements in columns 2 to 25 in the reporting year, for example due to a recalculation of the base year emissions intensity or a change to the target year.
- Replaced – Select this option for previously reported targets that have been replaced with another target in the reporting year, for example where a facility target has been incorporated into a public authority-wide target.
- Retired – Select this option for targets with a target year in the future, that have not been achieved, but will no longer be pursued. Provide more information as to why this target was retired in the “Please explain target coverage and identify any exclusions” column.
Is this a science-based target? (column 28)
- A brief description of science-based targets and why CDP is asking companies to set them is provided as additional information to this question.
- In addition, see the Technical Note on Science-Based Targets for what qualifies as a science-based target and how to assess your target against the Science Based Targets initiative’s criteria.
- Yes, and this target has been approved by the Science Based Targets initiative – Companies are very strongly encouraged to have their targets officially evaluated by the Science Based Targets initiative (SBTi). CDP considers targets approved by the initiative to reflect best practice in science-based target setting. Select this option only if the target has been approved by the SBTi.
- Yes, we consider this a science-based target, and the target is currently being reviewed by the Science Based Targets initiative – If your public authority has set a target and has self-assessed it to be science-based, and it has been submitted to the SBTi for validation and is currently being reviewed by the SBTi, you should select this option. You should use the “Please explain target coverage and identify any exclusions” column to explain why you believe your target to be science-based.
- Yes, we consider this a science-based target, and we have committed to seek validation of this target by the Science Bases Targets initiative in the next two years – Not all companies have had their target assessed by the SBTi. If your public authority has set a target and has self-assessed it to be science-based but has not yet submitted it to the SBTi for validation, you should select this option. You should use the “Please explain target coverage and identify any exclusions” column to explain why you believe your target to be science-based. If you are currently in the process of revising your target to meet SBTi criteria, indicate this by selecting “No, but we anticipate setting one in the next 2 years.
- No, but we are reporting another target that is science-based – Another target (absolute or intensity) disclosed is science-based, either in another row in this table, or in C4.1a.
- No, but we anticipate setting one in the next 2 years – While not necessary, it is recommended that the public authority publicly state this by submitting a Science Based Target initiative commitment letter.
- No, and we do not anticipate setting one in the next 2 years – No science-based targets have been set and there are no plans in place to set one in the next 2 years.
Target ambition (column 29)
- This column only appears if you select any “Yes” option in “Is this a science-based target” (column 28).
- Select the level of ambition of your science-based target. Note that as of July 2022, the SBTi requires Scope 1 and 2 targets to be consistent with the level of decarbonization required to keep global temperature increase to 1.5°C compared with pre-industrial temperatures, and Scope 3 targets to be consistent with the level of decarbonization required to keep global temperature increase to well-below 2°C compared to pre-industrial temperatures.
Please explain target coverage and identify any exclusions (column 30)
- If the target is not public authority-wide (i.e. it does not apply to the whole public authority in line with your definition of the reporting boundary) provide further details of your target coverage in this column. E.g. if you have selected “Country/region” in column 3, please specify which countries/regions your target covers.
- If your target is science-based, please specify if CO2 emissions and/or removals from bioenergy are relevant for your public authority and, if so, how you have included them in your target boundary. Please refer to the “Additional information” for more details.
- You can use this column to identify where you have a financial year or average year-based target.
- If your target was originally in a different format, you may wish to give the original target before it was converted into the format required for the purposes of this table.
- If your target is part of a wider carbon neutrality goal, a regulatory requirement, or a longer-term target, you can also explain this here.
Plan for achieving target, and progress made to the end of the reporting year (column 31)
- This column only appears if you select “Underway”, “Revised”, or “New” in column 27 “Target status in reporting year”.
- Describe how you plan to achieve the target, including any emissions reduction initiatives your public authority plans to implement.
- List the emissions reduction initiatives which have contributed most to any progress towards the target to the end of the reporting year (as indicated in column 26).
- If you are not on track to achieve the target, explain how you plan to get back on track.
- If possible, specify your anticipated and/or observed progress curve in this column, i.e.:
- Linear – the rate of progress towards the target is anticipated and/or observed to be steady over time
- Logarithmic – the rate of progress towards the target is anticipated and/or observed to be faster at the start
- Exponential – the rate of progress towards the target is anticipated and/or observed to be faster at the end
- Variable – the rate of progress towards the target is anticipated and/or observed to change from year to year
Additional information
Science-based targets
- Nearly 200 nations at COP21 wrote into the Paris Agreement that globally we will aim to limit warming to below 2°C and pursue efforts to limit warming to under 1.5°C. However, there is a large gap between the level of ambition of the country commitments and targeted temperatures. Companies, which are responsible for a vast majority of the world’s emissions, must play a critical role in filling the gap left by country commitments by raising the level of ambition in their target setting and reducing their emissions in line with climate science.
- Science-based target setting methods enable companies to set emissions targets that are consistent with conserving the remaining global emissions budget. A number of factors are taken into consideration in order to determine what is most appropriate for a given public authority. Please see the Technical Note on Science Based Targets and the 2022 climate change scoring methodology for information on best practices in target setting and what CDP considers a science-based target.
- Companies are very strongly encouraged to have their targets officially evaluated by the Science Based Targets initiative (SBTi). CDP considers targets approved by the initiative to reflect best practices in science-based target setting. Targets submitted to the SBTi for an official evaluation by the deadline (tbc), with all information needed to assess the target, will be used for scoring in CDP’s 2022 climate change questionnaire.
- Public authorities are very strongly encouraged to have their targets officially evaluated by the Science Based Targets initiative (SBTi). CDP considers targets approved by the initiative to reflect best practices in science-based target setting.
Science-based targets — bioenergy accounting
- As per the GHG Protocol Corporate Standard, CO2 emissions from the combustion, processing, and distribution of bioenergy and the land use emissions and removals associated with bioenergy feedstocks, should be reported alongside an organization's GHG inventory, separately from the Scopes. However, SBTi criterion 10 requires CO2 emissions from the combustion, processing and distribution of bioenergy and the land use emissions and removals associated with bioenergy feedstocks to be included in the target boundary when setting a science-based target (in Scopes 1, 2 and/or 3, as relevant) and when reporting progress against that target, even though such CO2 emissions and/or removals are reported separately in an organization's GHG inventory. Companies are expected to adhere to any additional GHG Protocol Guidance on bioenergy accounting when released in order to maintain compliance with criterion 10.
(PA4.1c) Explain why your public authority does not have an emissions target and forecast how your emissions will change over the next five years.
Question dependencies
This question only appears if you select “No target” in response to PA4.1.
Response options
Please complete the following table:
| Primary reason | Five-year forecast | Please explain |
|---|---|---|
Select from:
|
Text field [maximum 2,400 characters] | Text field [maximum 2,400 characters] |
Requested content
General
- If you select “Other, please specify,” provide a label for the "Primary reason".
Five-year forecast (column 2)
- Provide a qualitative and quantitative description of how you forecast your emissions will change over the next five years.
- It is acknowledged that this forecast will be an estimate, but it is expected that companies will:
- forecast the expected direction of change (e.g. whether their emissions will increase, decrease or experience no change overall over the next five years).
- provide a quantitative description of the forecasted change in emissions (e.g. Scope 1 emissions forecasted to decrease by 30 metric tons CO2e/ Scope 1 and Scope 2 emissions forecasted to increase by 10%/ Scope 3 emissions forecasted to decrease by 20%).
- provide a brief description of the reasons you forecast this change, or in the unlikely event no change, in emissions over the next five years. For example, this could be due to forecasted changes in output or expected emissions reduction activities.
Please explain (column 3)
- Provide an explanation of why you do not have a target and the timeline to implement one, if applicable.
Other climate-related targets
(PA4.2) Does your public authority have any other climate-related targets?
Rationale
Emissions reduction targets are not the only type of relevant targets that public authorities use to drive change. CDP asks this question to allow public authorities to report climate goals separate from emissions reductions, recognizing that there are multiple types of targets.
Connection to frameworks
TCFD
Metrics & Targets recommended disclosure a) Disclose the metrics used by the organization to assess climate-related risks and opportunities in line with its strategy and risk management process.
Metrics & Targets recommended disclosure c) Describe the targets used by the organization to manage climate related risks and opportunities and performance against targets.
SDG
Goal 7: Affordable and clean energy
Goal 12: Responsible consumption and production
Goal 13: Climate action
Response options
Select all that apply from the following options:
- Target(s) to increase low-carbon energy consumption or production
- Target(s) to reduce methane emissions
- Other climate-related target(s)
- No other climate-related targets
Requested content
Note for utilities:
- If you have a methane-specific emissions reduction target that was not reported in PA4.1a/b, select “Other climate-related target(s).”
- If methane emissions are not applicable to your public authority, you will be given the opportunity to explain this in PA4.2b.
Explanation of terms
- Net-zero target: the SBTi Net-Zero Standard defines corporate net-zero as:
- reducing Scope 1, 2 and 3 emissions to zero or to a residual level that is consistent with reaching net-zero emissions at the global or sector level in eligible 1.5°C scenarios or sector pathways and;
- neutralizing any residual emissions at the net-zero target date and any GHG emissions released into the atmosphere thereafter.
(PA4.2a) Provide details of your target(s) to increase low-carbon energy consumption or production.
Question dependencies
This question only appears if you select “Target(s) to increase low-carbon energy consumption or production” in response to PA4.2.
Rationale
Targets related to increasing low-carbon energy consumption or production can be an important element of public authorities’ strategy to reduce their emissions.
Connection to other frameworks
TCFD
Metrics & Targets recommended disclosure a) Disclose the metrics used by the organization to assess climate-related risks and opportunities in line with its strategy and risk management process.
Metrics & Targets recommended disclosure c) Describe the targets used by the organization to manage climate related risks and opportunities and performance against targets.
SDG
Goal 7: Affordable and clean energy
Goal 12: Responsible consumption and production
Goal 13: Climate action
Response options
Please complete the following table. The table is displayed over several rows for readability. You are able to add rows by using the “Add Row” button at the bottom of the table.
| Target reference number | Year target was set | Target coverage | Target type: energy carrier | Target type: activity | Target type: energy source |
|---|---|---|---|---|---|
| Low1 – Low100 | Numerical field [enter a number between 1900- 2022] | Select from:
|
Select from:
|
Select from:
|
Select from:
|
| Base year | Consumption or production of selected energy carrier in base year (MWh) | % share of low-carbon or renewable energy in base year | Target year | % share of low-carbon or renewable energy in target year | % share of low-carbon or renewable energy in reporting year | % of target achieved relative to base year [auto-calculated] |
|---|---|---|---|---|---|---|
| Numerical field [enter a number between 1900- 2022] | Numerical field [enter a number from 0- 999,999,999,999 using a maximum of 10 decimal places and no commas] | Percentage field [enter a percentage from 0-100 using a maximum of 2 decimal places] | Numerical field [enter a number between 2017- 2100] | Percentage field [enter a percentage from 0-100 using a maximum of 2 decimal places] | Percentage field [enter a percentage from 0-100 using a maximum of 2 decimal places] | Percentage field |
| Target status in reporting year | Is this target part of an emissions target? | Is this target part of an overarching initiative? | Please explain target coverage and identify any exclusions | Plan for achieving target, and progress made to the end of the reporting year |
|---|---|---|---|---|
Select from:
|
Text field [maximum 2,400 characters] [Emissions reduction target ID] |
Select all that apply:
|
Text field [maximum 2,400 characters] | Text field [maximum 2,500 characters] |
[Add Row]
Requested content
Target reference number (column 1)
- Select a unique target reference from the drop-down menu provided to track progress against this target in subsequent reporting years.
Year target was set (column 2)
- Enter the year in which your public authority set the target.
- This must be either before or during the reporting year but cannot be after the reporting year. It also cannot be after the target year.
- For year-on-year rolling targets, enter the year that you first set the target. This can be before the base year.
- If the target was set based on financial years, enter the year that applies to the end of your financial year and specify this in the “Please explain target coverage and identify any exclusions” column.
Target coverage (column 3)
- If the target applies to the whole public authority, select “Target covers all public authority divisions, activities and facilities.”
- Note that “public authority” refers collectively to all the companies, businesses, organizations, other entities or groups that fall within your definition of the reporting boundary.
- It is considered best practice to report one overarching target covering total public authority-wide Scope 1 and 2 emissions. Sub-targets may also be reported in additional rows.
- If the target does not apply to the whole public authority, select the option that best describes the coverage of the target, and provide further details in the “Please explain target coverage and identify any exclusions” column. E.g. if your target applies only to your operations within a state or province, select “Country/region” in this column and specify the country/region in the “Please explain target coverage and identify any exclusions” column.
Target type: energy carrier (column 4)
- Select the energy carrier to which your target relates.
- If your target relates to electricity, heat, steam and cooling combined, select “All energy carriers”
- If your target relates to multiple, but not all, energy carriers, select “Other, please specify” and indicate the energy carriers your target relates to.
Target type: activity (column 5)
- Select the activity to which your target relates.
Target type: energy source (column 6)
- Select whether the target relates to increasing consumption or production of low-carbon energy, or of renewable energy specifically. Definitions are provided in the explanation of terms below.
Base year (column 7)
- The base year is the year against which you are comparing your target.
- If you have a year-on-year rolling target, the base year will be the previous reporting year.
- If you have a target based on financial years, enter the year that applies to the end of your financial year and specify this in the “Please explain target coverage and identify any exclusions” column.
- If you have a target based on an average over a period of time (e.g. 5-year average), enter the year that applies to the end of the average period and specify this in the “Please explain target coverage and identify any exclusions” column.
- You cannot have a base year that is in the future.
MWh of low-carbon or renewable energy in base year (column 8)
- Enter the absolute base year value for the target in megawatt hours (MWh). Note that this figure should be consistent with your selections in columns 3-6.
- E.g. if your target is to achieve 100% renewable electricity consumption in your European operations by a target year of 2025 compared with a base year of 2015, enter in MWh the absolute renewable electricity consumed by your European operations in 2015 in this column.
- If your target relates to multiple energy carriers, enter the total MWh in the base year for all energy carriers.
% share of low-carbon or renewable energy in base year (column 9)
- Enter percentage share of low-carbon or renewable energy in the base year covered by the target.
- This is the low-carbon or renewable energy in the base year covered by the target (reported in column 8) as a percentage of the total energy in the base year covered by the target.
- E.g. if your target is to achieve 100% renewable electricity consumption in your European operations by a target year of 2025 compared with a base year of 2015, and in 2015 the renewable proportion of the total electricity consumed by your European operations was 40%, you should enter 40 in this column.
Target year (column 10)
- If you have a year-on-year rolling target, the target year will be the reporting year.
- If you have a target based on financial years, enter the year that applies to the end of your financial year and specify in the “Please explain target coverage and identify any exclusions” column.
- If you have a target based on an average over a period of time (e.g. 5-year average), enter the year that applies to the end of the average period and specify this in the “Please explain target coverage and identify any exclusions” column.
% share of low-carbon or renewable energy in target year (column 11)
- Enter the percentage share of low-carbon or renewable energy covered by the target to be achieved in the target year. This indicates your target ambition.
- E.g. if your target is to achieve 100% renewable electricity consumption in your European operations by a target year of 2025 compared with a base year of 2015, enter 100 in this column.
% share of low-carbon or renewable energy in reporting year (column 12)
- Enter the percentage share of low-carbon or renewable energy covered by the target in the reporting year.
- E.g. if your target is to achieve 100% renewable electricity consumption in your European operations by a target year of 2025 compared with a base year of 2015, and in the reporting year the renewable proportion of the total electricity consumed by your European operations was 80%, you should enter 80 in this column.
% of target achieved relative to base year [auto-calculated] (column 13)
- This column will be auto-calculated in the ORS.
- The target’s percentage completion compared with the base year will be calculated from the “% share of low-carbon or renewable energy in base year” (column 9), ‘% share of low-carbon or renewable energy in target year” (column 11), and “% share of low-carbon or renewable energy in reporting year” (column 12) columns. Ensure you have entered data into these columns.

- E.g. if your target is to achieve 100% renewable electrictiy consumption in your European operations by 2025 compared with 40% renewable electricity consumption in a base year of 2015, and in the reporting year you achieved 80% renewable electricity consumption, this column will display 66 as you have achieved 66% of your targeted increase in renewable electricity compared with the base year.
- Negative values indicate a decrease in low carbon or renewable energy consumption or production compared to the base year.
- Values greater than 100 indicate that you have exceeded your target.
Target status in reporting year (column 14)
- New - Select this option for targets that have been set in the reporting year and are still in progress.
- Underway - Select this option for targets that were set before the reporting year, with a target year in the future, that have not been achieved and continue to be pursued.
- Achieved - Select this option for targets that have been achieved or exceeded in the reporting year.
- Expired - Select this option for targets with a target year of the reporting year, that have not been achieved and have therefore expired in the reporting year.
- Revised - Select this option for targets that were set before the reporting year but a revision has been made to any of the elements in columns 2 to 12 in the reporting year, for example due to a recalculation or a change to the target year.
- Replaced - Select this option for previously reported targets that have been replaced with another target in the reporting year, for example where a facility target has been incorporated into a public authority -wide target.
- Retired - Select this option for targets with a target year in the future, that have not been achieved, but will no longer be pursued. Provide more information as to why this target was retired in the “Please explain target coverage and identify any exclusions” column.
Is this target part of an emissions target? (column 15)
- If the target is part of an emissions reduction target reported in C4.1a or C4.1b, enter the emissions reduction target reference number here.
Is this target part of an overarching initiative? (column 16)
- If the target is part of an overarching initiative, select the initiative or select “Other, please specify” to outline the initiative, please ensure you do not select 'No, it's not part of an overarching initiative' if any other option is selected.
Please explain target coverage and identify any exclusions (column 17)
- If the target does not apply to the whole public authority (i.e. the target coverage is not “public authority-wide”), provide further details of your target coverage in this column. E.g. if you have selected “Other” in column 3, please specify your target coverage.
- If you reported a renewable energy consumption or production target in C4.2 last year and are reporting progress against the same target this year, indicate this in this column.
- You can use this column to identify where you have a financial year or average year-based target.
- If your target was originally in a different format, you may wish to give the original target before it was converted into the format required for the purposes of this table.
- If your target is part of a wider carbon neutrality goal, a regulatory requirement, or a longer-term target, you can also explain this here.
Plan for achieving target, and progress made to the end of the reporting year (column 18)
- This column is only presented if “Underway,” Revised,” or “New” is selected in column 14 “Target status in reporting year.”
- Describe how you plan to achieve the target and list the actions which have contributed most to any progress towards the target.
- If you are not on track to achieve the target, explain how you plan to get back on track.
Explanation of terms
- Low-carbon energy: In line with the IEA definition, low-carbon technologies are technologies that produce low – or zero – greenhouse-gas emissions while operating. In the power sector this includes fossil-fuel plants fitted with carbon capture and storage, nuclear plants and renewable-based generation technologies. Natural gas, combined cycle gas turbine and fossil fuel-based combined heat and power (cogeneration), despite being less carbon intensive than other means of electricity production like coal, are not considered low-carbon.
- Renewable energy: CDP follows the definition of renewable energy given in the GHG Protocol, i.e. “energy taken from sources that are inexhaustible, e.g. wind, water, solar, geothermal energy and biofuels”.
(PA4.2b) Provide details of any other climate-related targets, including methane reduction targets.
Question dependencies
This question only appears if you select “Other climate-related target(s)” in response to PA4.2.
Rationale
Other climate-related targets can be an important element of public authorities’ strategy to reduce their emissions. This question increases transparency of corporate environmental commitments.
Connection to frameworks
TCFD
Metrics & Targets recommended disclosure a) Disclose the metrics used by the organization to assess climate-related risks and opportunities in line with its strategy and risk management process.
Metrics & Targets recommended disclosure c) Describe the targets used by the organization to manage climate related risks and opportunities and performance against targets.
SDG
Goal 7: Affordable and clean energy
Goal 12: Responsible consumption and production
Goal 13: Climate action
Response options
Please complete the following table. The table is displayed over several rows for readability. You are able to add rows by using the “Add Row” button at the bottom of the table.
| Target reference number | Year target was set | Target coverage | Target type: absolute or intensity | Target type: category | Metric (target numerator if reporting an intensity target) | Target denominator (intensity targets only) |
|---|---|---|---|---|---|---|
| Oth1 – Oth100 | Numerical field [enter a number between 1900- 2022] | Select from:
|
Select from:
|
Select from:
|
Select from drop-down options below | Select from drop-down options below |
| Base year | Figure or percentage in base year | Target year | Figure or percentage in target year | Figure or percentage in reporting year | % of target achieved relative to base year
[auto-calculated] |
|---|---|---|---|---|---|
| Numerical field [enter a number between 1900- 2022] | Numerical field [enter a number from 0- 999,999,999,999 using a maximum of 10 decimal places and no commas] | Numerical field [enter a number between 2017- 2100] | Numerical field [enter a number from 0- 999,999,999,999 using a maximum of 10 decimal places and no commas] | Numerical field [enter a number from 0- 999,999,999,999 using a maximum of 10 decimal places and no commas] | Percentage field |
| Target status in reporting year | Is this target part of an emissions target? | Is this target part of an overarching initiative? | Please explain target coverage and identify any exclusions | Plan for achieving target, and progress made to the end of the reporting year | List the actions which contributed most to achieving this target |
|---|---|---|---|---|---|
Select from:
|
Text field [maximum 2,400 characters [Emissions reduction target ID] |
Select all that apply:
|
Text field [maximum 2,400 characters] | Text field [maximum 2,500 characters] | Text field [maximum 2,500 characters] |
[Add Row]
Metric (target numerator if reporting an intensity target) drop-down options:
Select one of the following options:
Energy productivity
Energy consumption or efficiency
Renewable fuel production
Renewable fuel consumption
Waste management
Resource consumption or efficiency
Low-carbon vehicles
|
Low-carbon buildings
Land use change
Methane reduction target
Fossil fuel reduction target
Engagement with suppliers
Engagement with customers
R&D investments
Green finance
|
Target denominator (intensity targets only) drop-down options:
Select one of the following options:
- KWh
- MWh
- GJ
- Btu
- boe
- toe
- tce
- Gcal
- revenue passenger kilometer
- USD($) value-added
- square meter
- metric ton of aluminum
- metric ton of steel
- metric ton of cement
- metric ton of cardboard
- unit revenue
- unit FTE employee
- unit hour worked
- metric ton of product
- liter of product
- unit of production
- unit of service provided
- square foot
- kilometer
- passenger kilometer
- megawatt hour (MWh)
- barrel of oil equivalent (BOE)
- vehicle produced
- metric ton of ore processed
- ounce of gold
- ounce of platinum
- metric ton of aggregate
- billion (currency) funds under management
- hectare
- metric ton of waste
- liter of fuel
- year
- total amount of bonds outstanding at the end of the reporting period
- total amount of debt outstanding at the end of the reporting period
- Other, please specify
Requested content
General
- If you are a member of the EP100 and/or EV100 initiative, you can use this question to report on your progress towards achieving your target.
- To correctly report the progress against a stabilization target, i.e. a target to maintain a certain level of performance (e.g. to maintain a zero waste to landfill target for 100% of sites), you should treat it as a target that is reset every year. In this case, “base year” corresponds to the beginning of the reporting year where your indicator is reset to zero for that year, and “target year” corresponds to the end of the reporting year where you report the performance achieved in the reporting year.
Target reference number (column 1)
- Select a unique target reference from the drop-down menu provided to identify this target in subsequent questions and to track progress against this target in subsequent reporting years.
Year target was set (column 2)
- Enter the year in which your public authority has set the target.
- This must be either before or during the reporting year but cannot be after the reporting year. It also cannot be after the target year.
- For year-on-year rolling targets, enter the year that you first set the target. This can be before the base year.
- If the target was set based on financial years, enter the year that applies to the end of your financial year and specify this in the “Please explain target coverage and identify any exclusions” column.
Target coverage (column 3)
- If the target applies to the whole public authority, select “Target covers all public authority divisions, activities and facilities.”
- Note that “public authority” refers collectively to all the companies, businesses, organizations, other entities or groups that fall within your definition of the reporting boundary.
- It is considered best practice to report one overarching target covering total public authority-wide Scope 1 and 2 emissions. Sub-targets may also be reported in additional rows.
- If the target does not apply to the whole public authority, select the option that best describes the coverage of the target, and provide further details in the “Please explain target coverage and identify any exclusions” column. E.g. if your target applies only to your operations within a state or province, select “Country/region” in this column and specify the country/region in the “Please explain target coverage and identify any exclusions” column.
Target type: absolute or intensity (column 4)
- Select whether the target is an absolute or an intensity target, regardless of whether you measure it in absolute (e.g. MWh) or relative (%) values. E.g. if your target is to increase the percentage of low-carbon vehicles in the public authority fleet, select “absolute”.
Target type: category (column 5)
- Note that a selection must be made for both column 5 and column 6. Your data will not be saved if either column is left blank.
Metric (target numerator if reporting an intensity target) (column 6)
- Select the metric relevant to the target – for intensity targets this will be the target numerator.
- Note that only the options relative to the target category selected in column 5 will be displayed in the ORS.
- Note that a selection must be made for both column 5 and column 6. Your data will not be saved if either column is left blank.
Target denominator (intensity targets only) (column 7)
- Select the metric denominator of your climate-related intensity target. This column will only appear if you selected “Intensity” in column 4.
Base year (column 8)
- The base year is the year against which you are comparing your target
- If you have a year-on-year rolling target, your base year will be the previous reporting year.
- If you have a stabilization target, i.e. a target to maintain a certain level of performance (e.g. to maintain a zero waste to landfill target for 100% of sites), your base year will be the current reporting year.
- If you have a target based on financial years, enter the year that applies to the end of your financial year and specify this in the “Please explain target coverage and identify any exclusions” column.
- If you have a target based on average emissions over a period of time (e.g. 5-year average), enter the year that applies to the end of the average period and specify this in the “Please explain target coverage and identify any exclusions” column.
- You cannot have a base year that is in the future.
Figure or percentage in base year (column 9)
- Enter the base year value for your target. Note that this will be a percentage if you have selected any percentage option as your metric in column 6.
- E.g. if your target is to increase the percentage of low-carbon vehicles in the public authority fleet to 60% by a target year of 2021, compared with 40% low-carbon vehicles in the public authority fleet in a base year of 2016, enter 40 in this column.
- If you have a stabilization target i.e. a target to maintain a certain level of performance (e.g. to maintain a zero waste to landfill target for 100% of sites), enter 0 (or 0%), as your performance for this target is reset at the beginning of every reporting year.
Target year (column 10)
- If you have a year-on-year rolling target or stabilization target, your target year will be the reporting year.
- If you have a target based on financial years, enter the year that applies to the end of your financial year and specify in the “Please explain target coverage and identify any exclusions” column.
- If you have a target based on an average over a period of time (e.g. 5-year average), enter the year that applies to the end of the average period and specify in the “Please explain target coverage and identify any exclusions” column.
Figure or percentage in target year (column 11)
- Enter the target year value for your target.
- E.g. if your target is to increase the percentage of low-carbon vehicles in your public authority fleet to 60% by a target year of 2021, compared with 40% low-carbon vehicles in the public authority fleet in a base year of 2016, enter 60 in this column.
Figure or percentage in reporting year (column 12)
- Enter the reporting year value for your target.
- E.g. if your target is to increase the percentage of low-carbon vehicles in your public authority fleet to 60% by a target year of 2021, compared with 40% low-carbon vehicles in the public authority fleet a base year of 2016, and in the reporting year you have achieved 55% low-carbon vehicles in the public authority fleet, enter 55 in this column.
- If you are reporting a stabilization target i.e. a target to maintain a certain level of performance (e.g. to maintain a zero waste to landfill target for 100% of sites), enter the value achieved at the end of the reporting year (e.g. 100% if you managed to maintain your target for the share of zero waste to landfill sites).
% of target achieved relative to base year [auto-calculated] (column 13)
- This column will be auto-calculated in the ORS.
- The target’s percentage completion compared with the base year will be calculated from the “Figure or percentage in base year” (column 9), “Figure or percentage in target year” (column 11), and the “Figure or percentage in reporting year” (column 12) columns. Ensure you have entered data into these columns.
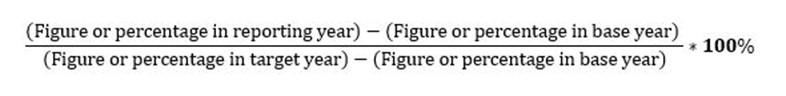
- E.g. if your target is to increase the percentage of low-carbon vehicles in your public authority fleet to 60% by a target year of 2021, compared with 40% low-carbon vehicles in the public authority fleet in a base year of 2016, and in the reporting year you have achieved 55% low-carbon vehicles in the public authority fleet, this column will display 75, as you have achieved 75% of your targeted % increase in low-carbon vehicles compared with the base year
- Negative values indicate that you have made negative progress towards your target. E.g. in the above example, that you have reduced the percentage of low-carbon vehicles in the public authority fleet, when compared with the base year.
- Values greater than 100% indicate that you have exceeded your target.
Target status in reporting year (column 14)
- New - Select this option for targets that have been set in the reporting year and are still in progress.
- Underway - Select this option for targets that were set before the reporting year, with a target year in the future, that have not been achieved and continue to be pursued.
- Achieved - Select this option for targets which have been achieved or exceeded in the reporting year.
- Expired - Select this option for targets with a target year of the reporting year, that have not been achieved and have therefore expired in the reporting year.
- Revised - Select this option for targets that were set before the reporting year, but a revision has been made in the reporting year, for example due to a recalculation or a change to the target year.
- Replaced - Select this option for previously reported targets that have been replaced with another target in the reporting year, for example where a facility target has been incorporated into a public authority-wide target.
- Retired - Select this option for targets with a target year in the future, that have not been achieved, but will no longer be pursued. Provide more information as to why this target was retired in the “Please explain target coverage and identify any exclusions” column.
Is this part of emissions target? (column 15)
- If the target is part of an emissions reduction target reported in PA4.1a or PA4.1b, please enter the emissions reduction target reference number here.
Is this target part of an overarching initiative? (column 16)
- If the climate-related target is part of an overarching initiative, select the initiative or select “Other, please specify” to outline the initiative, please ensure you do not select 'No, it's not part of an overarching initiative' if any other option is selected.
Please explain target coverage and identify any exclusions (column 17)
- If the target does not apply to the whole public authority (i.e. the target coverage is not “public authority-wide”, provide further details of your target coverage in this column. E.g. if you have selected “Country/region” in column 3, please specify which countries/regions your target covers.
- You can use this column to identify where you have a financial year or average year-based target.
- If your target is part of a wider carbon neutrality goal, a regulatory requirement, or a longer-term target, you can also explain this here.
Plan for achieving target, and progress made to the end of the reporting year (column 18)
- This column is only presented if “Underway,” “Revised,” or “New” is selected in column 14 “Target status in reporting year.”
- Describe how you plan to achieve the target and list the actions which have contributed most to any progress towards the target.
- If you are not on track to achieve the target, explain how you plan to get back on track.
List the actions which contributed most to achieving this target (column 19)
- This column is only presented if “Achieved” is selected in column 14 “Target status in reporting year”.
Note for utilities:
- If you have a methane-specific emissions reduction target that was not reported in PA4.1a/b, provide details of your methane-specific emissions reduction target in this question by selecting “Methane reduction target” in column 5.
PA5 Actions
Climate actions
(PA5.1) Provide details of your public authority's most significant emissions reduction actions.
Connection to other frameworks
TCFD
Metrics & Targets recommended disclosure a) Disclose the metrics used by the organization to assess climate-related risks and opportunities in line with its strategy and risk management process.
SDG
Goal 11: Sustainable cities and communities
Goal 13: Climate action
Response Options
Please complete the following table. You are able to add rows by using the “Add Row” button at the bottom of the table.
(*Column appearance is dependent on selections in this question.)
| Action name | Action category | Action type | Estimated annual emissions reductions (metric tons CO2e/year) | Start year of action | Estimated lifetime of action | Co-benefits realised | Comment |
|---|---|---|---|---|---|---|---|
| Text field |
Select from:
|
Select from drop-down options below | Numeric field | Numeric field |
Select from:
|
Select all that apply from drop-down options below |
Text field |
[Add Row]
Action type drop-down options:
Select one of the following options
Energy efficiency in buildings
|
Low-carbon energy consumption
|
Co-benefit drop-down options:
Select all that apply
Economic
Social
|
Public Health
|
Requested Content
General
- Report the outcomes of the most significant adaptation actions your public authority is currently undertaking.
Action name (column 1)
- Please provide a short title or name for the activity.
Action category (column 2)
- Select the option from the drop-down list that best describes the initiative. Note that these are broad categories only, with more detailed options provided in the “Initiative type” column.
- Energy efficiency in buildings – Select this option for all energy efficiency initiatives relating to buildings, including those relating to the building fabric (e.g. insulation, draught-proofing, etc.) and those relating to building services (e.g. HVAC, BEMS etc.)
- Energy efficiency in production processes – Select this option for all energy efficiency initiatives relating to processes (e.g. waste heat recovery, process optimization, compressed air, combined heat and power, automation, smart control systems, product/service design to improve energy efficiency etc.)
- Waste reduction and material circularity – Select this option for circular economy and waste reduction initiatives (e.g. reuse, recycling, remanufacturing, product/service design to reduce waste etc.).
- Fugitive emissions reductions – Select this option for initiatives to reduce fugitive emissions (e.g. methane capture, agricultural nitrous oxide reductions, refrigerant leakage reduction etc.)
- Low-carbon energy consumption – Select this option for emissions reduction initiatives relating to increasing low-carbon energy consumption i.e. energy from renewable sources, nuclear plants and fossil-fuel plants fitted with carbon capture and storage. Note that if increasing low carbon energy consumption has been a component of your emissions reduction initiatives please also report the other accompanying information in C6.2, C6.3, C7.5, and Module C8. If you select “solid biofuels” or “liquid biofuels”, you should specify whether any of the biofuels are derived from sustainable biomass in the “Comment” column (column 10). Refer to CDP’s Technical note on Biofuels for more information. Members of the RE100 initiative selecting this option should ensure to enter a figure in column 6 “Annual monetary savings”.
- Low-carbon energy generation – Select this option for initiatives relating to the installation of low-carbon energy generating facilities (renewable, nuclear or fossil-fuel plants fitted with carbon capture and storage) at your own site or at others on behalf of your clients. If you select “solid biofuels” or “liquid biofuels”, you should specify whether any of the biofuels are derived from sustainable biomass in the “Comment” column (column 10). Refer to CDP’s Technical note on Biofuels for more information. Members of the RE100 initiative selecting this option should ensure to enter a figure in column 6 “Annual monetary savings”.
- Non-energy industrial process emissions reductions – Select this option only for initiatives to reduce emissions from industrial production processes which chemically or physically transform materials (e.g. CO2 from the calcinations step in cement manufacturing, CO2 from catalytic cracking in petrochemical processing, PFC emissions from aluminum smelting etc.)
- Company policy or behavioral change – Select this option for initiatives relating to a change in company policy (e.g. value chain engagement, a new procurement policy) or an organizational behavioral change (e.g. resource efficiency improvements such as reducing paper use, waste management improvements such as reducing food waste etc.). Note that changes in company transportation policies should not be reported here but under the initiative category “Transportation”
- Transportation – Select this option for initiatives relating to employee travel and commuting and the company fleet.
- Other, please specify – If none of the listed categories are applicable to your initiative, select this option and specify the initiative.
Action type (column 3)
- Select the type of action you have undertaken from the drop-down options provided. Note that only action types relative to the action category selected in the previous column will be displayed in the ORS.
- If none of the provided options are applicable to your action, select “Other, please specify” and provide details of the action type.
Estimated annual emissions reductions (metric tons CO2e) (column 4)
- Enter the expected annual CO2e savings in all emission Scopes, in metric tons, occurring with the initiative in place. It is acknowledged that this figure is likely to be an estimate.
- Where savings occur on a non-annual basis, average the savings so that an annual figure can be provided.
- Where the initiative has not been in place for the entire reporting period, estimate and report the emissions that would be saved in a 12-month period, so that an annual figure can be provided.
Estimated lifetime of action (column 5)
- Indicate the timescale for which the emissions mitigation, energy savings and/or renewable energy generation associated with the action will last. For example, if the action being reported is the installation of solar panels on public authority owned facilities, the start year is the year from which the solar system is functioning while the end year is the expected year by when the system will stop producing power.
Co-benefits realized (column 6)
- Actions taken to adapt to climate change can also provide additional areas of benefit for the public authority. Please select which areas other than creating resilience are also improved as a result of the action.
- Evaluating the impacts of wider opportunities/benefits can help build a strong case for climate actions, create buy-in from decision-makers and help prioritize those actions that will deliver the most benefits (The co-benefits of climate action: Accelerating City-Level Ambition).
- The Urban Climate Action Impacts Framework suggests indicators that can be used to measure co-benefits.
- Tools that can enable your public authority to quantify co-benefits include: C40 Benefits toolkit and Siemens City Performance Tool.
Comment (column 7)
- Use this field to describe additional details of the action. Detail could include context about the project such as how your public authority identified and prioritized the action, whether your public authority tested the actions through pilot/demonstration projects. Where possible, outline the tools and mechanisms for measuring the impact of the adaptation action and number of people impacted by adaptation action. If available, please include a weblink which provides further information on the action.
Explanation of terms
- Sustainable, healthy diet: While the exact definition of what constitutes a sustainable, healthy diet is subjective and may vary by city, the general principles are at a diet that prioritizes low-carbon, sustainably sourced health-positive foods, usually largely plant-based and with a reduction in meat consumption. Several frameworks define diets in this vein:
- WRI's Cool Food initiative emphasize low-carbon footprint meals that meat nutritional safeguards
- EAT, a partner of the Cool Food initiative, utilizes the "Planetary Healthy diet," a flexible set of guidelines for food groups that constitute an optimal diet for human health and environmental sustainability. It emphasizes a plant-forward diet where whole grains, fruits, vegetables, nuts and legumes comprise a greater proportion of foods consumed. Meat and dairy constitute important parts of the diet but in significantly smaller proportions than whole grains, fruits, vegetables, nuts and legumes.
- The Milan Urban Food Pact defines a sustainable diet as one that is "healthy, safe, culturally appropriate, environmentally friendly, and rights-based."
- Sustainable food production practices: the list below are some examples and is not exhaustive:
- Regenerative agriculture: an inclusive agroecosystems approach for conserving land and soil, biodiversity, and improving ecosystem services within farming systems. It focuses on the regeneration of living soil, improved micro hydrology, and conserving biodiversity at all levels while enhancing inputs use efficiency and ecosystem system services (FAO 2021). Practices include cover crops, reducing tilling, crop rotation, composting, organic farming, and natural fertilizer use in place of chemicals and herbicides.
- Nature-based solutions: a suite of actions or policies that harness the power of nature to address some of our most pressing societal challenges, such as threats to water security, rising risk of natural disasters, or climate change. These solutions involve protecting, restoring, and sustainably managing ecosystems in ways that increase their resiliency and ability to address those societal challenges, while also safeguarding biodiversity and improving human well-being (WWF)
- Nature-positive production: Food production systems that provide beneficial impacts to nature (e.g. pollinator support, reforestation, improved biodiversity, etc) and avoid typical impacts to the environment such as deforestation (UNEP).
(PA5.2) Report how your public authority ensures that implemented climate actions are inclusive and equitable.
Connection to other frameworks
TCFD
Strategy recommended disclosure a) Describe the climate-related risks and opportunities the organization has identified over the short, medium, and long term.
SDG
Goal 1: No poverty
Goal 10: Reduced inequalities
Response Options
Please complete the following table.
| Measures to ensure inclusive and equitable climate action | Please provide evidence and/or more details of how your public authority is ensuring inclusive and equitable climate action |
|---|---|
Select all that apply:
|
[Text field & attachment] |
- Requested Content
General
- Public authorities should be considering and evaluating the positive or negative impacts of climate action on stakeholders. The evaluation results can be qualitative or quantitative and the findings will differ depending on the type of climate action that is being implemented. These results can help inform and develop targeted policies that help remedy pre-existing injustices and avoid an inequitable distribution of benefits from climate actions.
- Find out how to do an equity assessment in C40’s Inclusive Planning Roadmap published on the C40 Knowledge Hub.
- Find out more about analyzing the equity and inclusion aspects of your actions and measuring their equitable impacts via the Actions Analysis tool and equitable impacts guidance and tools on the C40 Knowledge Hub.
- Climate actions should be designed to ensure that their benefits are equitably distributed across the population (C40).
Outline if and how your public authority is ensuring inclusive and equitable climate action (column 1)
- If your organization is ensuring equitable distribution of climate action impacts, select the measures your public authority is taking. If your public authority is not yet taking measures to ensure equitable distribution of climate action impacts, select whether they are in progress, intending to or not intending to do so.
Please provide evidence and/or more details of how your public authority is ensuring inclusive and equitable climate action (column 2)
- Provide evidence and/or more details that your public authority is ensuring inclusivity/equity impacts of climate action.
- Include any relevant attachments or links to support your inclusive and equitable climate action referenced in column 1.
Investment in climate actions
(PA5.3) Provide details of the factors driving your public authority to invest in climate action
Rationale
This question provides data users with more transparency into your organization’s approach to realizing emissions reductions and progress towards targets.
Connection to other frameworks
SDG
Goal 7: Affordable and clean energy
Goal 13: Climate action
Response options
Please complete the following table. You are able to add rows by using the “Add Row” button at the bottom of the table.
| Factors | Please explain |
|---|---|
Select from:
|
Text field [maximum 2,400 characters] |
[Add Row]
Requested content
General
- This question is intended to gather information on the ways in which capital is directed towards emissions reduction activities within your pubilc authority, and/or the way in which initiatives are identified. If your public authority uses an internal carbon price you are encouraged to report this here.
Method (column 1)
- Select the types of methods that you employ to help to channel funds towards emissions reduction initiatives.
Comment (column 2)
- Provide additional details or examples as necessary.
Additional information
Marginal Abatement Cost Curves
- Marginal Abatement Cost Curves, or MACCs, provide a method of evaluating potential emissions reduction activities. They provide a visual comparison of the marginal abatement costs for different projects.
- MACCs can be generated to evaluate options at any level of organization – from individual business divisions, to the overall business and to sectors and countries, evaluating individual projects, programs or policies.
- Marginal abatement costs are calculated by dividing the costs of the project (calculated from the initial cost minus any savings made as a result of the project) by the greenhouse gas emissions saved over a specified investment timeframe.
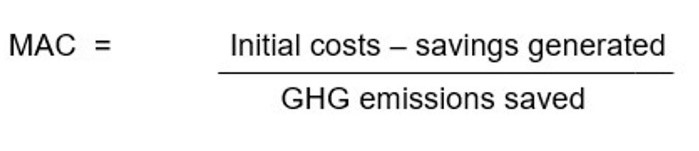
- These are then arranged with the lowest costs (sometime negative cost) on the left, increasing in cost to the right, creating the curve. An example taken from McKinsey & Company “Impact of the financial crisis on carbon economics: Version 2.1 of the global greenhouse gas abatement cost curve"
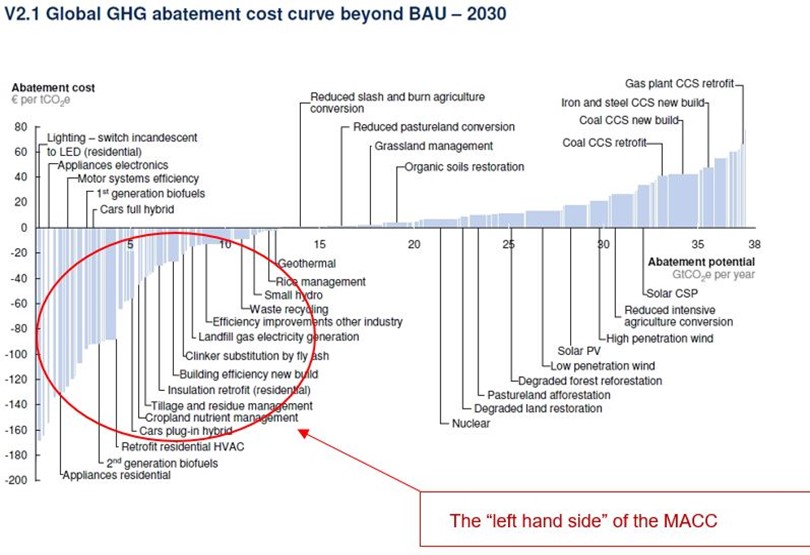
- Those projects/initiatives on the “left hand side” of the MACC are those where there are cost savings to be made over the lifetime of the project as a result of the emissions savings made, and therefore, even without a commitment to carbon reduction investment, should be implemented from a cost saving point of view. Where the bars extend above the line, positive costs are associated with the proposals. Here the MACC curve can be used to suggest the lowest cost options for achieving a particular target. Using the example above, savings of 9.5MtCO 2 can be made at costs of less than €40/tonCO2.
- As with all evaluation methods, the accuracy of the MACC will depend on that of the input data.
(PA5.4) Describe any planned climate-related projects within your public authority for which you hope to attract financing.
Response Options
Please complete the following table. You are able to add rows by using the “Add Row” button at the bottom of the table.
(*column/row appearance is dependent on selections in this question)
| Project area | Project title* | Stage of project development* | Status of financing* |
|---|---|---|---|
|
Select from:
|
Text field |
Select from:
|
Select from:
|
| Identified financing model* | Project description and attach project proposal* | Total cost of project | Total investment cost needed if relevant |
|---|---|---|---|
Select all that apply:
|
Text field and attachment function |
Numeric field |
Numeric field |
Reporting guidance
- The goal of this question is to understand what climate change related projects your public authority is currently seeking external financing for from public or private institutions. These may be projects relating to renewable energy, sustainable transport, building or energy efficiency, waste, water, or other climate-related areas.
- Use the table in this question to list the different projects your public authority is looking to attract public or private sector finance for – you can add multiple projects by clicking “Add row.” If your public authority is not currently seeking financing on any relevant projects, please select “No relevant projects” in the first field.
PA6 Emissions
Reporting boundary
(PA6.1) State the reporting boundary for consolidating your GHG inventory and report details on excluded emissions sources.
Rationale
This will help data users interpret your responses. In some cases, it can be difficult to gather data for all sources. Circumstances where this might be the case include sources in countries or small facilities where data acquisition is difficult or unreliable. Structural changes to the organization including mergers, acquisitions and divestments can also be reasons where emissions data are not included in your disclosure. This question enables companies to report where these sources are not included in the disclosure and thus provides data users transparency into reported emissions inventories.
Response options
Please complete the following table.
(*column appearance is dependent on selections in this question)
| Reporting boundary | Are there any sources (e.g. facilities, specific GHGs, activities, geographies, etc.) of emissions that are within your selected reporting boundary which are not included in your disclosure? | Provide details of the sources of emissions that are within your selected reporting boundary which are not included in your disclosure. * |
|---|---|---|
Select from:
|
Select from:
|
[Text field] |
Requested content
General
- Use a consolidated approach when determining reporting boundaries. CDP recommends that you consult your legal or accounting advisors when doing so.
- The “consolidated approach” identifies which entities are included within the reporting boundary. Unless stated otherwise, the information you provide in response to the CDP climate change questionnaire should be presented as one “consolidated” result covering all of the companies, entities, businesses, etc., within your reporting boundary.
- To support the use, tracking, and comparability of reported GHG information, respondents are encouraged to adopt the consolidation approaches based on the GHG Protocol Corporate Standard, outlined in more detail in Chapter 3 of the Standard.
- If you have previously disclosed emissions data to CDP and your consolidation approach has changed in the current reporting year, select your new approach here and provide details of the change in C5.1b.
Reporting boundary (column 1)
- The options in the drop-down for this question are based on the GHG Protocol Corporate Standard, and are described in more detail below (text adapted from the GHG Protocol Corporate Standard):
- Financial control: An organization has financial control over an operation if it has the ability to direct the financial and operating policies of the operation with a view to gaining economic benefits from its activities. Generally, an organization has financial control over an operation for GHG accounting purposes if the operation is treated as a group company or subsidiary for the purposes of financial consolidation.
- Companies using the CDSB framework should select this option.
- Operational control: An organization has operational control over an operation if it or one of its subsidiaries has the full authority to introduce and implement its operating policies at the operation.
- Most SMEs select this option.
- Equity share: Under the equity share approach, an organization accounts for GHG emissions from operations according to its share of equity in the operation. The equity share reflects the economic interest, which is the extent of rights an organization has to the risks and rewards flowing from an operation. Typically, the share of economic risks and rewards in an operation is aligned with the organization's percentage ownership of that operation, and equity share will normally be the same as the ownership percentage. Where this is not the case, the economic substance of the relationship the organization has with the operation always overrides the legal ownership form to ensure the equity share reflects the percentage of economic interest. The principle of economic substance taking precedence over legal form is consistent with international financial reporting standards.
- In the case of leasing arrangements, please see the GHG Appendix: Categorizing GHG Emissions from Leased Assets and the International Accounting Standard (IAS) 17 on Leases, published by the International Financial Reporting Standards (IFRS) to determine the appropriate scope for those emissions.
Are there any sources (e.g. facilities, specific GHGs, activities, geographies, etc.) of emissions that are within your selected reporting boundary which are not included in your disclosure? (column 2)
- Identify sources that would normally be within the consolidation boundary you have identified for your disclosure in column 1 but for which greenhouse gases are not reported in this disclosure. Excluded sources may be in a particular country or represent a number of very small facilities making it difficult to gather data.
- Common reasons for exclusions, both relevant or not relevant, can include the following:
- Incomplete information for the period in question;
- Structural changes to the organization including mergers, acquisitions and divestments;
- Outsourcing and/or insourcing of activities; and
- Unreliable information.
- The GHG Protocol’s Corporate Accounting and Reporting Standard notes on the reporting of exclusions (page 9) that “Specific exclusions…need to be clearly identified and justified, assumptions disclosed, and appropriate references provided for the methodologies applied and the data sources used. The information should be sufficient to enable a third party to derive the same results if provided with the same source data.”
Provide details of the sources of emissions that are within your selected reporting boundary which are not included in your disclosure. (column 3)
This column is only presented if the “Yes” option is selected in column 2.
Explanation of terms
- Public authority: Throughout this questionnaire, “your public authority” refers collectively to all the companies, businesses, organizations, other entities or groups that fall within your definition of the reporting boundary. This term is used interchangeably with “your organization”, but CDP recognizes that some disclosing organizations may not consider themselves to be, or be formally classified, as “companies”.
- Consolidation approach: The identification of companies, businesses, organizations etc. for inclusion within the reporting boundary of the responding organization. The way in which you report information for the companies that are included within the reporting boundary is known as the “consolidation approach” because, unless stated otherwise, the information you provide in response to the questionnaire should be presented as one “consolidated” result covering all of the companies, entities, businesses etc within your reporting boundary. The GHG Protocol states that two distinct approaches may be used to consolidate GHG emissions; the equity share and the control approaches. Control can be defined in either financial (financial control) or operational (operational control) terms. This term is used interchangeably with “your organization”, but CDP recognizes that some disclosing organizations may not consider themselves to be, or be formally classified, as “companies”.
- GHG inventory: a quantified list of an organization’s greenhouse gas emissions and sources.
- Organization: Throughout this questionnaire, “your organization” refers collectively to all the companies, businesses, other entities or groups that fall within the definition of your reporting boundary (provided in C0.5). This term is used interchangeably with “your public authority”, but CDP recognizes that some disclosing organizations may not consider themselves to be, or be formally classified, as “companies”.
- Reporting boundary: This determines which organizational entities, such as groups, businesses and companies, are included in or excluded from your disclosure. These may be included according to your financial control, operational control, equity share or another measure. Please consistently apply this organizational boundary when responding to questions unless you are specifically asked for data about another category of activities.
Base year emissions
(PA6.2) Provide your base year and base year emissions.
Rationale
Reporting emissions is best practice and a prerequisite to understanding and reducing negative environmental impacts. CDP asks this question to ensure public authorities are measuring their carbon footprints from direct emissions. A meaningful and consistent comparison of emissions over time requires that companies set a performance datum with which to compare current emissions.
Connection to other frameworks
TCFD
Metrics & Targets recommended disclosure b) Disclose Scope 1, Scope 2, and, if appropriate, Scope 3 greenhouse gas (GHG) emissions, and the related risks.
SDG
Goal 13: Climate action
Response options
Please complete the following table:
| Scope | Base year end date | Base year emissions (metric tons CO2e) | Comment |
|---|---|---|---|
|
Scope 1 |
Use the calendar button or enter dates manually in the format DD/MM/YYYY |
Numerical field [enter a number from 0-999,999,999,999 using a maximum of 3 decimal places and no commas] |
Text field [maximum 2,400 characters] |
|
Scope 2 (location-based) |
|||
|
Scope 2 (market-based) |
|||
| Scope 3 category 1: Purchased goods and services | |||
| Scope 3 category 2: Capital goods | |||
| Scope 3 category 3: Fuel-and-energy-related activities (not included in Scope 1 or 2) | |||
| Scope 3 category 4: Upstream transportation and distribution | |||
| Scope 3 category 5: Waste generated in operations | |||
| Scope 3 category 6: Business travel | |||
| Scope 3 category 7: Employee commuting | |||
| Scope 3 category 8: Upstream leased assets | |||
| Scope 3 category 9: Downstream transportation and distribution | |||
| Scope 3 category 10: Processing of sold products | |||
| Scope 3 category 11: Use of sold products | |||
| Scope 3 category 12: End of life treatment of sold products | |||
| Scope 3 category 13: Downstream leased assets | |||
| Scope 3 category 14: Franchises | |||
| Scope 3 category 15: Investments | |||
| Scope 3: Other (upstream) | |||
| Scope 3: Other (downstream) |
Requested Content
General
- This question requests a base year for your greenhouse gas inventory. This may be the same as the base year for your targets, but not necessarily.
- If your public authority has measured its emissions in the past, you can use the oldest year for which it has emissions information available – preferably verified or assured – as your base year. If your public authority is measuring its emissions for the first time, you may choose the current reporting year as the base year.
- Public authorities should ensure that the base year inventory includes both a location-based and market-based Scope 2 total, if applicable and feasible. This ensures “like with like” comparisons over time. If the Scope 2 base year chosen was calculated only according to the location-based method, you should also recalculate and report a market-based total if contractual information or residual mix totals are available for the base year. If not, you should state in the comment field that the location-based result has been used as a proxy since a market-based figure cannot be calculated.
- As per the GHG Protocol Corporate Value Chain (Scope 3) Accounting and Reporting Standard, public authorities should use a single base year for Scope 1, Scope 2, and Scope 3 emissions (for all calculated Scope 3 categories). This is to enable comprehensive and consistent tracking of total emissions across all three Scopes over time. However, companies with already established base years for Scope 1 and Scope 2 emissions may use a more recent year for the Scope 3 base year (e.g., the first year for which you have complete and reliable Scope 3 emissions data).
- Establishing a single base year for all Scope 3 categories simplifies Scope 3 emissions tracking and allows clearer communication of GHG emissions to data users.
- If you are using an average of annual emissions over several consecutive years for your base year emissions, enter the last year in the period (e.g. 01/01/2019 – 31/12/2019), then provide the time period over which the average was calculated in the comment column and explain that the emissions figure reported is an average.
- If you have not calculated base year emissions for a particular Scope 3 category, you may leave the respective row blank.
- If you are using the Export/Import functionality, please check that the imported date is correct.
Additional information
- Setting a base year: Setting a base year is an essential GHG accounting step that an organization must take to be able to observe trends in its emissions information. According to the GHG Protocol Corporate Standard, a base year is “a historic datum (a specific year or an average over multiple years) against which a company’s emissions are tracked over time.” See Chapter 5 of the GHG Protocol Corporate Standard for more information on setting and recalculating a base year.
- Recalculation criteria for Scope 3 emissions base year: The table below from the Corporate Value Chain (Scope 3) Accounting and Reporting Standard provides additional guidance for determining the need for Scope 3 base year recalculation due to changes in insourcing/outsourcing.
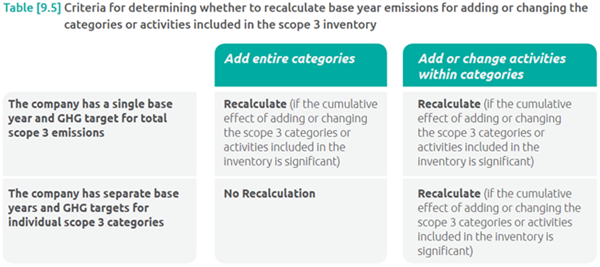
Emissions methodology
(PA6.3) Select the name of the standard, protocol, or methodology you have used to collect activity data and calculate emissions.
Rationale
CDP data users need to understand what methods have been used to calculate emissions.
Response options
Select all that apply from the following options:
- American Petroleum Institute Compendium of Greenhouse Gas Emissions Methodologies for the Oil and Natural Gas Industry, 2009
- Canadian Association of Petroleum Producers, Calculating Greenhouse Gas Emissions, 2003
- Energy Information Administration 1605(b)
- Environment Canada, Sulphur hexafluoride (SF6) Emission Estimation and Reporting Protocol for Electric Utilities
- Environment Canada, Aluminum Production, Guidance Manual for Estimating Greenhouse Gas Emissions
- Environment Canada, Base Metals Smelting/Refining, Guidance Manual for Estimating Greenhouse Gas Emissions
- Environment Canada, Cement Production, Guidance Manual for Estimating Greenhouse Gas Emissions
- Environment Canada, Primary Iron and Steel Production, Guidance Manual for Estimating Greenhouse Gas Emissions
- Environment Canada, Lime Production, Guidance Manual for Estimating Greenhouse Gas Emissions
- Environment Canada, Primary Magnesium Production and Casting, Guidance Manual for Estimating Greenhouse Gas Emissions
- Environment Canada, Metal Mining, Guidance Manual for Estimating Greenhouse Gas Emissions
- ICLEI Local Government GHG Protocol
- IEA CO2 Emissions from Fuel Combustion
- IPCC Guidelines for National Greenhouse Gas Inventories, 2006
- IPIECA's Petroleum Industry Guidelines for reporting GHG emissions, 2003
- IPIECA’s Petroleum Industry Guidelines for reporting GHG emissions, 2nd edition, 2011
- ISO 14064-1
- Regional Greenhouse Gas Initiative (RGGI) Model Rule
- Smart Freight Centre: GLEC Framework for Logistics Emissions Methodologies
- The Climate Registry: Electric Power Sector (EPS) Protocol
- The Climate Registry: General Reporting Protocol
- The Climate Registry: Local Government Operations (LGO) Protocol
- The Climate Registry: Oil & Gas Protocol
- The Cool Farm Tool
- The GHG Indicator: UNEP Guidelines for Calculating Greenhouse Gas Emissions for Businesses and Non-Commercial Organizations
- The Greenhouse Gas Protocol: A Corporate Accounting and Reporting Standard (Revised Edition)
- The Greenhouse Gas Protocol Agricultural Guidance: Interpreting the Corporate Accounting and Reporting Standard for the Agricultural Sector
- The Greenhouse Gas Protocol: Public Sector Standard
- The Greenhouse Gas Protocol: Scope 2 Guidance
- US EPA Center for Corporate Climate Leadership: Direct Fugitive Emissions from Refrigeration, Air Conditioning, Fire Suppression, and Industrial Gases
- US EPA Center for Corporate Climate Leadership: Indirect Emissions From Events and Conferences
- US EPA Center for Corporate Climate Leadership: Indirect Emissions From Purchased Electricity
- US EPA Center for Corporate Climate Leadership: Direct Emissions from Stationary Combustion Sources
- US EPA Center for Corporate Climate Leadership: Direct Emissions from Mobile Combustion Sources
- US EPA Mandatory Greenhouse Gas Reporting Rule
- US EPA Emissions & Generation Resource Integrated Database (eGRID)
- WBCSD: The Cement CO2 and Energy Protocol
- Other, please specify
Requested content
General
- There are a variety of standards, methodologies, and protocols available for collecting and reporting GHG data.
- The appropriateness of an emissions calculation methodology should be determined on a case-by-case basis, and it is good practice for the methods used to estimate emissions and the underlying data to be externally verified.
- CDP makes no judgments on standards or methodologies applied by public authorities to produce their inventories. However, we expect that any tool used will follow the best practice and observe important aspects such as the accuracy and completeness principles of standards similar to the GHG Protocol.
- If the metholology(ies) you have used is not listed, select “Other, please specify;” and indicate the methodology(ies) used.
(PA6.4) State the start and end date of the year for which you are reporting your public authority’s latest emissions data.
Rationale
This will help data users interpret your responses.
Response options
Please complete the following table.
| Start date |
End date |
|---|---|
| From: [DD/MM/YYYY] | To: [DD/MM/YYYY] |
Requested content
General
- Apply this reporting year to your answers for the entire questionnaire unless the ability is provided to specify other reporting periods.
- Please ensure that the reporting period represents only one full year that has already passed. Reporting periods should not be in the future. This information is important for others to understand the time dimension of your disclosure.
- This reporting period applies to all answers except where other reporting periods can be disclosed. CDP does not require public authorities to align their reporting year with their fiscal year. However, when organizations report emissions intensity using a financial metric, both emissions and financial information provided should align with the reporting year reported here.
- Note that the investment community generally prefers that the disclosure period match the fiscal year for their financial jurisdiction. This facilitates the assessment of environmental performance data in alignment with financial performance data.
- CDP recommends that public authorities provide a year for which they have complete data if possible. However, if you do not have data for the entirety of your reporting year, your public authority may extrapolate your data to cover the entire reporting year.
Scope 1 emissions data
(PA6.5) What were your public authority's gross global Scope 1 emissions in metric tons CO2e?
Rationale
Reporting emissions is best practice and a prerequisite to understanding and reducing negative environmental impacts. CDP asks this question to ensure companies are measuring their carbon footprints from direct emissions.
Connection to other frameworks
TCFD
Metrics & Targets recommended disclosure b) Disclose Scope 1, Scope 2, and, if appropriate, Scope 3 greenhouse gas (GHG) emissions, and the related risks.
SDG
Goal 13: Climate action
Response options
Please complete the following table:
| Gross global Scope 1 emissions (metric tons CO2e) | Comment |
|---|---|
| Numerical field [enter a range of 0-999,999,999,999 using a maximum of 3 decimal places and no commas] | Text field [maximum 2,400 characters] |
Requested content
General
- Emissions must be reported in gross, not net figures. Therefore, negative numbers are not allowed.
- Putting in zero suggests that you have measured your emissions and that they are equal to zero.
- Gross emissions are requested so that data users can account for GHG emissions from sources owned or controlled by your public authority before any reductions for offsets are made, as per the GHG Protocol Corporate Standard. This transparency is meant to provide users with the most accurate portrayal of the emissions created within your organization's boundary.
- Scope 1 emissions should be reported in metric tons of CO2e. Common conversion factors are included in the Technical Note "Units of Measure Conversions".
- Special requirements for carbon sequestration, captured & stored and transferred CO2, transfer in – transfer out, and enhanced oil recovery are explained in the Technical Note "Special conditions for reporting Scope 1 emissions".
- Emissions estimates are acceptable, as long as there is transparency with regards to the estimation approach (what is estimated and how) and the data used for the analysis is adequate to support the objectives of the inventory. If applicable to your public authority's reporting of Scope 1 emissions, please outline this in the comment column.
Note for first-time responders
- If you are a first-time responder, please provide gross global Scope 1 emissions data for the current reporting year and the three years prior to the current reporting year.
- Please input the gross global Scope 1 emissions data for the current reporting year in the first row and work backwards from the current reporting year.
- Please ensure that the reporting period represents only one full year that has already passed. Reporting periods should not be in the future. This information is important for others to understand the time dimension of your disclosure.
- Use the comment column to report relevant information regarding your public authority's past Scope 1 emissions data.
Scope 2 emissions reporting
(PA6.6) Describe your public authority's approach to reporting Scope 2 emissions.
Rationale
The purpose of this question is to allow companies to disclose their approach to calculating their Scope 2 emissions. This is particularly relevant when considering market-based Scope 2 emissions, as it is important to differentiate between companies that have not reported a market-based figure as they do not have operations where there are those contractual instruments, and those companies that do have operations where there are contractual instruments but have chosen not to disclose a market-based figure. CDP asks this question to enable accurate comparability across companies.
Connection to other frameworks
SDG
Goal 13: Climate action
Response options
Please complete the following table:
| Scope 2, location-based | Scope 2, market-based | Comment |
|---|---|---|
|
Select from:
|
Select from:
|
Text field [maximum 2,400 characters] |
Requested content
General
- The GHG Protocol Scope 2 Guidance was published in January 2015. Part of the requirements of the guidance is that companies shall account for their Scope 2 emissions using two methodologies: a location-based method and a market-based method. The market-based method is for those companies who have any operations in markets providing product- or supplier-specific data in the form of contractual instruments. If this is not applicable to your public authority, you only need to provide one location-based figure.
- Per the GHG Protocol Corporate Standard, a contractual instrument is “any type of contract between two parties for the sale and purchase of energy bundled with attributes about the energy generation, or for unbundled attribute claims.” Different markets will have different contractual instruments, which can include energy attribute certificates, direct contracts such as PPAs, and supplier-specific emission rates.
- It is important to consider the definition of contractual instruments when determining whether your public authority needs to calculate a market-based figure. If your public authority can access emissions factors from your energy supplier for any of your operations, you are required to calculate and report a market-based figure. Therefore, when responding to this question, if you do have operations where there are contracts such as RECs and Guarantees of Origin, supplier specific emissions factors, or a residual emissions factor such as in the US and Europe – regardless of whether or not you purchase them – then you should not select “We have no operations where we are able to access electricity supplier emissions factors or residual emissions factors and are unable to report a Scope 2, market-based figure”. For full details please view the GHG Protocol Scope 2 Guidance. You can also reference CDP's Technical Note on Accounting of Scope 2 emissions
- For the purpose of CDP reporting, to claim the use of renewable electricity for market-based figures, companies must source renewable electricity from within the boundary of the market in which they are consuming the electricity (i.e. comply with the market boundary criteria). Based on current knowledge, the market boundary is defined for most countries as their geographical boundary, except the following: 1) European countries which are AIB members and 2) United States of America and Canada. Please refer to CDP’s Technical Note on Accounting of Scope 2 emissions for further information.
Scope 2 emissions data
(PA6.7) What were your public authority's gross global Scope 2 emissions in metric tons CO2e?
Rationale
Reporting emissions is best practice and a pre-requisite to understanding and reducing negative environmental impacts. CDP asks this question to ensure public authorities are measuring emissions from purchased or acquired electricity, steam, heat, and cooling.
Connection to other frameworks
TCFD
Metrics & Targets recommended disclosure b) Disclose Scope 1, Scope 2, and, if appropriate, Scope 3 greenhouse gas (GHG) emissions, and the related risks.
Response options
Please complete the following table:
| Scope 2 emissions, location-based | Scope 2 emissions, market-based (if applicable) | Comment |
|---|---|---|
| Numerical field [enter a range of 0-99,999,999,999 using a maximum of 3 decimal places and no commas] | Numerical field [enter a range of 0-99,999,999,999 using a maximum of 3 decimal places and no commas] | Text field [maximum 2,400 characters] |
Requested content
General
- Negative numbers are not allowed as reporting needs to be gross, not net figures
- Putting in zero would suggest that you have measured your emissions and that they are equal to zero.
- Emissions estimates are acceptable, as long as there is transparency with regards to the estimation approach (what is estimated and how) and the data used for the analysis is adequate to support the objectives of the inventory.
- For more information about CDP’s current recommendations on what emission factor to use for electricity accounting, where you can find emission factors and the different types there are, please check the Technical Note “Accounting of Scope 2 emissions.” Please also note that electricity produced by either CH4 or N2O is to be included in the emission factor.
- For further information, please also see GHG Protocol Scope 2 Guidance.
- For more detailed information beyond what is provided in this guidance and technical annexes, consult your electricity suppliers, carbon advisor, or verifier/assurer.
Note for first-time responders
- If you are a first-time responder, please provide gross global Scope 2 emissions data for the current reporting year and the three years prior to the current reporting year.
- Please input the gross global Scope 2 emissions data for the current reporting year in the first row and work backwards from the current reporting year.
- Please ensure that the reporting period represents only one full year that has already passed. Reporting periods should not be in the future. This information is important for others to understand the time dimension of your disclosure.
- Use the comment column to report relevant information regarding your public authority's past Scope 2 emissions data.
Explanation of terms
- Electricity: In line with GHG Protocol, this term is used as shorthand for electricity, steam, and heating/cooling. Purchased electricity is defined as electricity that is purchased or otherwise brought into the organizational boundary of the public authority. Scope 2 emissions physically occur at the facility where electricity is generated.
Additional information
- Scope 2 emissions: In many industries, indirect GHG emissions mostly occur from the generation of purchased electricity (and purchased heat, steam and cooling) consumed by the public authority, as per the GHG Protocol Corporate Standard. Non-energy-intensive public authorities are likely to have significantly higher Scope 2 figures than Scope 1 figures. The GHG Protocol highlights that “accounting for Scope 2 emissions allows companies to assess the risks and opportunities associated with changing electricity and GHG emissions cost.”
Scope 3 emissions data
(PA6.8) Account for your public authority's gross global Scope 3 emissions, disclosing and explaining any exclusions.
Rationale
For most companies, the majority of emissions occur in the value chain. CDP asks this question to gauge the thoroughness of companies’ accounting processes and to understand how companies are analyzing their emissions footprints.
Connection to other frameworks
TCFD
Metrics & Targets recommended disclosure b) Disclose Scope 1, Scope 2, and, if appropriate, Scope 3 greenhouse gas (GHG) emissions, and the related risks.
SDG
Goal 12: Responsible consumption and production
Goal 13: Climate action
Response options
Please complete the following table:
| Scope 3 category | Evaluation status | Emissions in reporting year (metric tons CO2e) | Emissions calculation methodology | Percentage of emissions calculated using data obtained from suppliers or value chain partners | Please explain |
|---|---|---|---|---|---|
|
Purchased goods and services |
Select from:
|
Numerical field [enter a number from 0-999,999,999,999 using a maximum of 3 decimal places and no commas] |
Select all that apply:
|
Numerical field [enter a number from 0-100 using a maximum of 2 decimal places and no commas] |
Text field [maximum 2,400 characters] |
|
Capital goods |
|||||
|
Fuel-and-energy-related activities (not included in Scope 1 or 2) |
|||||
|
Upstream transportation and distribution |
|||||
|
Waste generated in operations |
|||||
|
Business travel |
|||||
|
Employee commuting |
|||||
|
Upstream leased assets |
|||||
|
Downstream transportation and distribution |
|||||
|
Processing of sold products |
|||||
|
Use of sold products |
|||||
|
End of life treatment of sold products |
|||||
|
Downstream leased assets |
|||||
|
Franchises |
|||||
|
Investments |
|||||
|
Other (upstream) |
|||||
|
Other (downstream) |
Requested content
General
- According to the GHG Protocol’s Corporate Value Chain (Scope 3) Accounting and Reporting Standard (page 107): “Any estimates of avoided emissions must be reported separately from a public authority's Scope 1, Scope 2, and Scope 3 emissions, rather than included or deducted from the Scope 3 inventory”. In the context of your CDP response, you can provide information on actions you take to reduce your Scope 3 emissions in question PA4.1a or PA4.1b on emissions reduction initiatives.
- You should complete every row of the table (with the exception of the last two rows “Other (upstream)” and “Other (downstream)” which are optional), but not necessarily all columns.
- The columns that you need to complete in response to question C6.5 will depend on your selection made in the “Evaluation status” column and are summarized in the guidance below for column 2 “Evaluation status”.
Scope 3 category (column 1)
- This column is already completed in the ORS and all categories will appear. The categories of Scope 3 emissions have been taken from the Greenhouse Gas Protocol’s Corporate Value Chain (Scope 3) Accounting and Reporting Standard, published in September 2011. Public authorities should refer to the standard for information on the emissions sources that each category comprises and additional information on how to calculate these emissions.
Evaluation status (column 2)
- This column should be completed for all Scope 3 categories, with the exception of “Other (upstream)” and “Other (downstream)” – these two rows should only be used if companies have a source of Scope 3 emissions that is not provided in the categories above. The evaluation status includes two components: whether a Scope 3 category is relevant to your business and whether you have calculated the emissions in that category. Relevance should be determined with reference to the GHG Protocol Scope 3 standard – see Additional Information for the Scope 3 relevance criteria. Select from:
- Relevant, calculated - Select this option if the Scope 3 category is relevant to your business and you have calculated the emissions associated with at least part of it.
- Relevant, not yet calculated - Select this option if you are aware that the Scope 3 category is relevant to your business but you have not yet calculated the emissions associated with it.
- Not relevant, calculated - Select this option if you know that this Scope 3 category is not one of the most important for your business but as part of your Scope 3 work, you have been able to calculate the emissions associated with it.
- Not relevant, explanation provided - Select this option if you have investigated this Scope 3 category and have been able to determine that it is not relevant. This could be based on quantitative or qualitative investigations.
- Not evaluated - Select this option if you have not yet investigated this Scope 3 category and therefore do not know whether it is relevant for your business.
Emissions in reporting year (metric tons CO2e) (column 3)
- This column is only presented if “Relevant, calculated” or “Not relevant, calculated” is selected in column 2 “Evaluation status”.
- Enter the emissions appropriate to each Scope 3 category identified in metric tons CO2e, entering numbers only up to 99,999,999,999 without commas and up to two decimal places. Negative numbers are not allowed as reporting needs to be gross, not net figures. Emission figures should be for the reporting year only.
- Entering 0 implies that you have calculated the emissions associated with this category and they are equal to zero.
Emissions calculation methodology (column 4)
- This column is only presented if “Relevant, calculated” or “Not relevant, calculated” is selected in column 2 “Evaluation status”.
- Select the calculation methodology(ies) used to calculate the emissions associated with this Scope 3 category.
- You should consult the GHG Protocol’s Technical Guidance for Calculating Scope 3 Emissions for details of which emissions calculations methodologies are relevant to each Scope 3 category.
Percentage of emissions calculated using data obtained from suppliers or value chain partners (column 5)
- This column is only presented if “Relevant, calculated” or “Not relevant, calculated” is selected in column 2 “Evaluation status”.
- Such data obtained from suppliers or value chain partners may take the form of primary activity data, or emissions data calculated by suppliers that are specific to suppliers’ activities. More information on this can be found in Chapter 7, Collecting Data, of the GHG Protocol’s Corporate Value Chain (Scope 3) Accounting and Reporting Standard.
Please explain (column 6)
- For all Scope 3 categories that you have identified as “Relevant, calculated” or “Not relevant, calculated” in the “Evaluation status” column, provide a short description of the types and sources of data used to calculate emissions (e.g. activity data, emission factors and GWP values), and any further details of the emissions calculation methodology(ies) selected in column 5 such the assumptions and allocation methods used and any exclusions within the category.
- For all Scope 3 categories that you have identified as “Not relevant, explanation provided” in the “Evaluation status” column, provide details of how you have reached the conclusion that the source is not relevant and include any qualitative or quantitative reasoning.
- If you wish to provide additional context to any of the rows in the table, such as to explain why emissions have decreased or increased, you can also do that in this column.
Additional information
- Relevance criteria for Scope 3 emissions sources: Public authorities should not exclude any activity that would compromise the relevance of the reported inventory. The table below from the Corporate Value Chain (Scope 3) Accounting and Reporting Standard provides a list of criteria for determining relevance.
Emissions intensities
(PA6.9) Describe your combined Scope 1 and 2 gross emissions for the reporting year in metric tons CO2e per an intensity metric(s) most appropriate for your public authority's operations.
Rationale
Intensity measures describe a public authority’s CO2e emissions in the context of another business metric. In this way, the emissions are normalized to account for growth etc. Many companies and investors have historically tracked environmental performance with intensity ratios.
Connection to other frameworks
SDG
Goal 13: Climate action
Response options
Please complete the following table. It is requested that you first report your emissions intensity figure per unit of currency total revenue. You are able to add rows by using the “Add Row” button at the bottom of the table.
| Intensity figure | Metric numerator (Gross global combined Scope 1 and 2 emissions, metric tons CO2e) | Metric denominator | Metric denominator: Unit total | Scope 2 figure used | % change from previous year | Direction of change | Reason for change |
|---|---|---|---|---|---|---|---|
|
Numerical field [enter a number from 0- 999,999,999,999 using a maximum of 10 decimal places and no commas] |
Numerical field [enter a number from 0-999,999,999,999 using a maximum of 2 decimal places and no commas] |
Select from:
|
Numerical field [enter a number from 0-999,999,999,999,999 using a maximum of 2 decimal places and no commas] |
Select from:
|
Numerical field [enter a number from 0-999 using a maximum of 2 decimal places] |
Select from:
|
Text field [maximum 2,400 characters] |
[Add Row]
Requested content
General
- It is requested that you first report your emissions intensity figure per unit of currency total revenue and if applicable provide any additional intensity metrics that are appropriate to your business operations. The currency reported here should be in your country’s local currency. Emissions intensity per unit of revenue is one of the most common and easy means to calculate emissions intensity, which is why it is requested that you provide this figure. However, this is not necessarily always the most appropriate to individual businesses and therefore you can also report an additional intensity or normalized metric that is most appropriate to your public authority's operations.
- If you did not disclose to CDP last year, or did not use this data point, please use last year’s inventory and financial data to provide a calculation of percentage change. If you did not measure your emissions last year, complete column 1 and explain why you do not have the data available in column 8.
- If your change in emissions intensity is attributed to a decline or an increase in your business output (products or services) due to the COVID-19 pandemic, please state this in the column “Reason for change” and state how your output was affected.
Intensity figure (column 1)
- Intensity ratios express GHG impact per unit of physical activity or unit of economic output.
- Your intensity figure per unit of currency total revenue is calculated by dividing total Scope 1 and 2 emissions by unit revenue, making sure that the revenue figure used applies to the same organizational boundary as your emissions data.
- Important points to remember when calculating intensity are:
- Intensity = Emissions (metric tons CO2e) (Numerator) / Business metric (e.g. revenue) (Denominator)
- Numerator units: the intensity metrics requested in question PA6.9 should have emissions in metric tons CO2e as the numerator. They should include Scope 1 and Scope 2 emissions combined. This figure can be obtained by summing the figures given in answer to questions PA6.5 and PA6.7.
- Denominator units: When calculating your intensity, you should ensure that the units of your data match those specified in the intensity metric. For example, question PA6.9 requests for intensity in metric tons CO2e per unit currency revenue. This means that your revenue figure (the denominator) should be in the local currency, i.e. if your revenue is 5 Million US$ your unit revenue is 5000000. Another example would be metric tons CO2e per MWh – if your data is in kWh you must convert it to MWh before using it in the calculation.
- Boundary and Exclusions: You should ensure that the organizational boundary and any exclusions specified for your numerator is the same as for your denominator. For example, when entering your emissions per FTE employee you should ensure that you only include those FTE employees that are within the sections of the public authority covered by the organizational boundary of your emissions and take into account any exclusions (as specified in question PA6.1a).
Metric numerator (column 2)
- This column is fixed and specifies that the emissions should be in metric tons CO2e, derived from your gross global Scope 1 emissions figure (question PA6.5) plus your gross global Scope 2 emissions figure (question PA6.7).
Metric denominator (column 3)
- To report your public authority’s emissions intensity per unit currency total revenue, select "unit total revenue" in column 3 (metric denominator) for this figure.
- Please note that the denominator in the selection “unit total revenue” is per single unit (1) of the currency specified in question C0.4. Please do not report your revenue emissions intensity based on multiples of your selected currency (e.g. do not report in multiples of USD). It is understood that this will likely result in your intensity figure being quite small (less than 0.01).
- If you select “Other, please specify,” provide a label for the metric denominator.
Metric denominator: Unit total (column 4)
- Ensure that the metric denominator figure provided in this column is the same unit that was chosen in column 3.
- For example, if your chosen metric in the previous column was FTE, you should input here how many FTE you had during the reporting year.
Scope 2 figure used (column 5)
- Indicate which Scope 2 figure has been used in your metric numerator.
% change from previous year (column 6)
- If you have experienced no change, please enter 0 (zero) in this column.
- If the previous year’s figure has been reported but recalculated since, please use the recalculated figure for the calculation of percentage change and note this in the last column (8). The previous year compared should apply to the 12-month period directly prior to the reporting period, even if it does not completely overlap with the period previously reported to CDP.
Direction of change (column 7)
- A declining intensity ratio reflects a positive performance (improvement), while an increasing intensity ratio reflects a negative performance (decline).
- If the percentage change from last year is 0 (zero) select "No change."
Reason for change (column 8)
- Describe why your emissions intensity has changed. Explain the primary reasons behind the change and the degree to which different factors have influenced the figures.
- Specify if this change is due to emission reduction initiatives, including those reported in PA4.1a.
Note for electric utility sector companies:
- Electric utility sector organizations are requested to provide an emissions intensity figure per unit of currency total revenue and in addition, report your organization’s gross global combined Scope 1 and 2 emissions intensity per MWh of gross power generated and/or per MWh of power transmitted – make sure to select megawatt hour generated (MWh) and/or megawatt hour transmitted (MWh).
Verification
(PA6.10) Indicate the verification/assurance status that applies to your reported emissions.
Response options
Please complete the following table:
| Scope | Verification/assurance status |
|---|---|
|
Scope 1 |
Select from:
|
|
Scope 2 (location-based or market-based) |
Select from:
|
|
Scope 3 |
Select from:
|
Requested content
General
- Please provide the verification/assurance status that applies to your Scope 1, Scope 2, and Scope 3 emissions. If you have had a proportion of your Scope 1, 2, and/or 3 emissions verified, please select the option that applies to these emissions; you will be given an opportunity to provide further details in the following questions.
- If verification/assurance is underway, or part of a biennial or triennial process: It is recognized that for some companies, the verification/assurance schedule is out of synchronization with the CDP disclosure process and therefore it is difficult to complete the verification/assurance process before the CDP deadline. In addition, verification/assurance processes may occur every two years (biennial verification) or every three years (triennial verification). Where this is the case, you should select “Verification or assurance process in place” and provide further information in the following questions.
- In the following questions you will be asked to provide evidence of any third-party verification that you have reported in this question. Companies are advised to verify that their evidence can demonstrate all of the requirements set by CDP before answering this question (e.g. by consulting with their verifier/assurer). If certain information requirements set by CDP are not met in the standard assurance statement provided by your verifier, CDP has produced a template that can be used in conjunction with the original assurance statement.
Scope 2
- If you operate in a region where you need to calculate both a location-based and a market-based figure to meet Scope 2 requirements, at this stage CDP recommends you to verify one of these figures. However, in the interest of transparency, you are asked to disclose which of the two figures you have verified. If you are verifying your market-based Scope 2 emissions figure, and your verification engagements cover >70% of your Scope 2 activity (energy purchased or acquired and consumed by the reporting public authority (MWh)), but less than 70% of your Scope 2 emissions, this will be acceptable for full points provided you attach the relevant statement.
Additional information
Annual, biennial and triennial processes: If in the year the verification is completed (for example, Year 3), the data for all sources during the full cycle is verified (for example year 1, 2, and 3) the company can report 100% verification and should attach the verification statements that cover the emissions for all three years. This would be considered a triennial process. Graph of this situation is provided for clarity below (Figure 1).
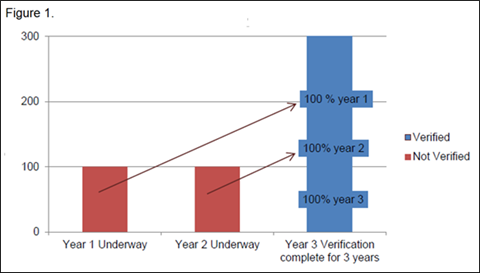
Annual processes: Not all processes taking place over three years will be considered a triennial process. The graphs below illustrate annual processes, which should not be confused with triennial.
Figure 2 shows an annual process, where in the year the verification is completed (for example, Year 3) only the data for that year is verified.
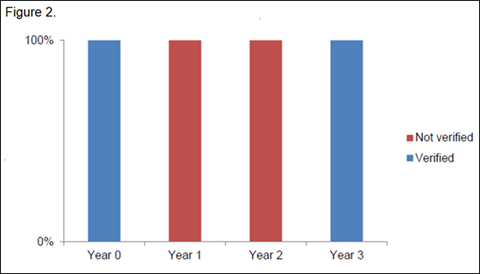
Another example of a yearly process is when one third of the sources is verified every year (Figure 3). Under this scenario, in Year 3 only 1/3 of the sources are verified, with the second third verified in Year 2, and the remaining third in Year 1. The public authority should report this as a yearly process where 33% of the sources are verified.
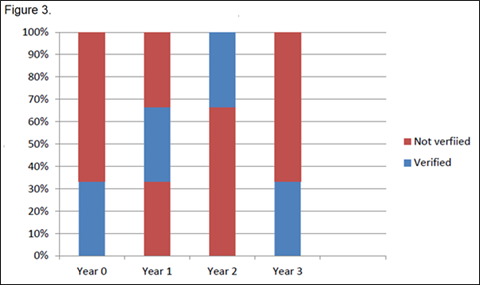
Likewise, where a public authority has 1/3 of their emissions verified every year this is an annual process (Figure 4):
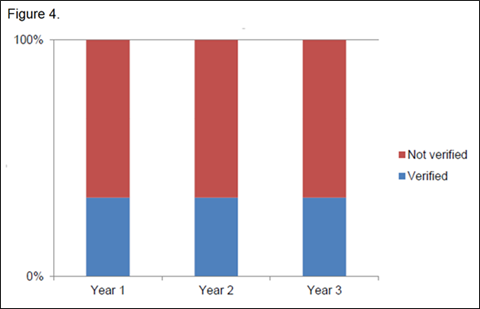
CDP regards verification/assurance as a process undertaken by an independent third party accredited to perform verification/assurance of the GHG emissions data. Please only state that you have had or are having verification/assurance carried out if it is by an independent third party accredited to perform verification/assurance of GHG data. CDP does not prescribe companies’ choice of specific verification/assurance providers. However, companies searching for a provider may want to consult our list of accredited verification partners: Learn more about CDP solution providers offering third party verification services here.
(PA6.10a) Provide further details of the verification/assurance undertaken for your Scope 1, 2 and/or 3 emissions and attach the relevant statements.
Rationale
CDP supports verification and assurance as good practice in environmental reporting. This question gives data users further confidence in the accuracy of the data reported.
Response options
Please complete the following table. You are able to add rows by using the “Add Row” button at the bottom of the table.
| Scope | Verification or assurance cycle in place | Status in the current reporting year | Type of verification or assurance |
|---|---|---|---|
Select all that apply:
|
Select from:
|
Select from:
|
Select from:
|
| Attach the statement | Page/section reference | Relevant standard | Proportion of reported emissions verified (%) |
|---|---|---|---|
|
Attach your document here |
Text field [maximum 500 characters] |
Select from drop-down options below |
Numerical field [enter a number from 0-100 using no decimals or commas] |
[Add Row]
Relevant standard drop-down options:
- AA1000AS
- Alberta Technology Innovation and Emissions Reduction (TIER)
- ASAE3000
- Attestation standards established by AICPA (AT105)
- Australian National GHG emission regulation (NGER)
- California Mandatory GHG Reporting Regulations (CARB)
- Canadian Institute of Chartered Accountants (CICA) Handbook: Assurance Section 5025
- Certified emissions measurement and reduction scheme (CEMARS)
- Chicago Climate Exchange (CCX) verification standard
- Corporate GHG verification guidelines from ERT
- Earthcheck Certification
- ERM GHG Performance Data Assurance Methodology
- ISAE3000
- ISAE 3410
- ISO14064-3
- SGS Sustainability Report Assurance
- The Climate Registry's General Verification Protocol
- Other, please specify
Requested content
General
- If you are reporting third party verification or assurance underway, your entries into the table should reflect the emissions that are being subject to verification/assurance for the current reporting year, with the exception of the attached statement, which will relate to a previous year.
- CDP understands that you may seek verification for reasons other than reporting to CDP and that confidential information may be included within your detailed verification statement. In this case, it is sufficient for your verifier/assurer to attest to the Scope and level of assurance/verification through correspondence such as an abbreviated statement as long as this covers the data points outlined below (see guidance for column 5 ‘Attach your statement here’).
Scope (column 1)
- Select all applicable Scopes with third party verification/assurance for the current reporting year.
Verification or assurance cycle in place (column 2)
- A biennial verification/assurance process is where emissions are verified once every two years and a triennial verification/assurance process is where emissions are verified once every three years.
- You may refer to the additional information provided on annual, biennial and triennial processes in PA6.10 for further information.
Status in the current reporting year (column 3)
- Please select the option that is most appropriate to your public authority.
Type of verification or assurance (column 4)
- This column relates to the type of verification or assurance that has been awarded.
- The option that is relevant will depend on the verification standard to which the verification process has been completed and the level of assurance agreed between the verifier and the public authority.
- Public authorities can select from the following options:
- Not applicable - In very few cases, usually in program-based compliance, the verification standard does not include a level of assurance; in this case select this option.
- Limited assurance - This is one of the most common levels of assurance and, for e.g., is appropriate to verification undertaken in accordance with ISO14064-3, ISAE3000, ASAE3000 and The Climate Registry.
- Moderate assurance - For example, this level of assurance is appropriate to verification undertaken in accordance with AA1000 and AT105.
- Reasonable assurance - For example, this is appropriate to verification undertaken under ISO14064-3, ISAE3000, ASAE3000 and The Climate Registry; all verification undertaken for EU ETS compliance is to a level of “reasonable assurance” (according to the requirements of EA-6/03).
- High assurance - For example, this is appropriate to verification undertaken in accordance with AA1000 and AT105.
- Third party verification/assurance underway - Select this option if verification/assurance is underway and you do not yet know the level of assurance that you are intending to achieve.
Attach the statement (column 5)
- Note the requirements for the statement detailed below and the option to use the CDP template.
- All public authorities should attach a verification statement here unless they have selected “No verification or assurance of current reporting year” or “Underway but not complete for current reporting year – first year it has taken place” in column 2 ‘Status in the current reporting year’. The statement should:
- Clearly state that GHG emissions have been verified or assured as part of the process. If the statement refers to other documents that have been verified (such as Sustainability Report, Financial Report, GRI etc.) where items verified are specified, please attach those to the question as well;
- Relate to the relevant Scope;
- Clearly state the opinion and type of verification/assurance that has been given and the verification standard used. Assurers/verifiers must define the finding in their opinion, simply stating “limited assurance” is not sufficient to fulfill this criterion. These should match the selections made in columns 1 and 3; and- Covers the current reporting year or covers the 12-months prior for annual processes, 12-24 months prior for biennial processes, or 12-36 months prior for triennial processes if “Underway but not complete for reporting year – previous statement of process attached” is selected in “Status in the current reporting year” column.
Page/section reference (column 6)
- Please identify the page and the section that contains details of your verification/assurance of Scope emissions.
Relevant standard (column 7)
- This column captures the verification standard against which the verification process has been undertaken.
- It does not refer to the reporting or calculation standard. CDP has produced criteria for what constitutes an acceptable verification standard. All accepted verification standards, and exceptions to their use, are listed here. If you are using a verification standard that is not listed in the “accepted standards” nor the “non-verification standards,” please contact your regional CDP office to have your verification standard reviewed. If you do not have your standard reviewed by contacting us and your response is submitted before the official CDP deadline, CDP will then review the standard used and add it to the website under “accepted” or “not accepted” depending on the outcome of the standard review. If the response is submitted after the official deadline, CDP cannot commit to review the standard.
- Select from the accepted standards listed or use “Other, please specify” if the standard you are using is not included.
- If you select “Other, please specify”, provide a label for the Relevant standard.
- The verification standard should be stated on the verification statement.
Proportion of reported emissions verified (%) (column 8)
- It may be the case that only a sub-section of your emissions has been verified/assured due to, for e.g., regulatory requirements.
- Please identify what proportion of your total reported emissions for the Scope has been subject to the verification/assurance process described.
PA7 Additional Metrics
Energy
(PA7.1) Report the following information on the energy consumed and generated by your public authority.
Rationale
Given the importance of energy consumption in emissions accounting, this question attempts to provide transparency to data users on the consumption of energy by the public authority. The question provides the opportunity for public authorities to disclose their total energy consumption and distinguish renewable and non-renewable forms of energy.
Connection to other frameworks
TCFD
Metrics & Targets recommended disclosure a) Disclose the metrics used by the organization to assess climate-related risks and opportunities in line with its strategy and risk management process.
SDG
Goal 11: Sustainable Cities and Communities
Goal 13: Climate Action
Response options
Please complete the following table.
| Total purchased energy in reporting year that was consumed (MWh) | Percentage of total purchased energy from renewable sources | Total self-generated energy in reporting year that was consumed (MWh) | Percentage of total self-generated energy from renewable sources | Comment |
|---|---|---|---|---|
| Numeric field | Percentage field | Numeric field | Percentage field | Text field |
Requested content
Total purchased energy in reporting year that was consumed (MWh) (column 1)
- You should include consumption from purchased/acquired energy in this question. Energy that is purchased but not physically consumed (e.g. traded power, financial instruments).
- Energy consumption figures should be for the reporting year only.
- If your data is in a unit that is not MWh, please convert it to MWh. This will enable data comparability. Should you require guidance on converting the value to MWh please see the CDP Technical Note: Conversion of fuel data to MWh.
Percentage of total purchased energy from renewable sources (column 2)
- Where data is unavailable the field can be left blank and where no energy is consumed from that source, please enter 0 in the field.
Total self-generated energy in reporting year that was consumed (MWh) (column 3)
- If your public authority produces renewable energy that is not based on fuel (such as solar, wind, hydro, geothermal, marine), then any consumption of this energy should be entered here.
- All forms of non-fuel renewable energy - electricity, heat, steam, or cooling – shall be included.
- Energy consumption figures should be for the reporting year only.
- If your data is in a unit that is not MWh, please convert it to MWh. This will enable data comparability. Should you require guidance on converting the value to MWh please see the CDP Technical Note: Conversion of fuel data to MWh.
Percentage of total self-generated energy from renewable sources (column 4)
- Where data is unavailable the field can be left blank and where no energy is consumed from that source, please enter 0 in the field.
Comment (column 5)
- If available, please provide a link to a webpage or report where this data can be accessed in the field ‘Comment’ at the bottom of the table.
Additional information
- Further information on the development of renewable energy across jurisdictions, using the most up-to-date information and data available, can be found in REN21’s Renewables in Cities Global Status Report.
Other climate-related metrics
(PA7.2) Provide any additional climate-related metrics relevant to your public authority.
Rationale
CDP data users seek to understand in which areas, beyond GHG emissions, companies are trying to reduce their environmental impacts.
Connection to other frameworks
TCFD
Metrics & Targets recommended disclosure a) Disclose the metrics used by the organization to assess climate-related risks and opportunities in line with its strategy and risk management process.
Response options
Please complete the following table. You are able to add rows by using the “Add Row” button at the bottom of the table.
| Description | Metric value | Metric numerator | Metric denominator (intensity metric only) | % change from previous year | Direction of change | Please explain |
|---|---|---|---|---|---|---|
|
Select from:
|
Numerical field [enter a number from 0 to 99,999,999,999 using up to 2 decimal places] |
Text field [maximum 50 characters] | Text field [maximum 50 characters] |
Numerical field [enter a number from 0 to 999 using up to 2 decimal places] |
Select from:
|
Text field [maximum 2,400 characters] |
[Add Row]
Requested content
General
- Complete the table to report any additional climate-related metrics your business tracks beyond emissions reductions and renewable energy-related activities.
- If you track more than one additional climate-related metric, describe them each in a separate row.
Description (column 1)
- Select the type of metric applicable to your business. If none of the listed dropdowns apply, select “Other, please specify” and provide a label for the “Description.”
Metric value (column 2)
- Enter the quantity of the unit tracked and reported in column 3. E.g. if your public authority tracks kilograms of waste, enter the kilograms measured during the reporting year.
- When providing an intensity metric, provide the value of the intensity. E.g. if your companies tracks kilograms of waste per FTE, enter the kilograms measured during the reporting year normalized to the number of FTE in the reporting year.
Metric numerator (column 3)
- Enter the unit of the metric that your public authority tracks. This unit corresponds to the value entered in column 2.
Metric denominator (column 4)
- This column is only applicable for companies tracking an intensity metric (e.g., kilograms of waste per FTE). If you do not track an intensity metric, leave this column blank.
% Change from previous year (column 5)
- If you have experienced no change, please enter 0 (zero) in this column.
- The previous year compared should apply to the 12-month period directly prior to the reporting period, even if it does not completely overlap with the period previously reported to CDP. It is understood that this metric has not been reported to CDP before and thus the reporting year for this metric may not directly overlap with other metrics reported to CDP.
- Leave the column blank if this is the first year you have tracked this metric.
Direction of change (column 6)
- Use this column to outline the direction of change from the previous year.
- A declining intensity ratio reflects a positive direction of change. E.g. your waste last reporting year was 10 metric tons/FTE and this year it is 5 metric tons/FTE. This indicates a 50% decrease compared to the previous year.
- If the percentage change from last year is 0 (zero) then select “no change.”
Please explain (column 7)
- Use this column to provide any additional context relevant to the metric you are reporting and to the direction of change. Additional information could include projects or initiatives implemented to achieve progress on this metric, or any timeframes included in these goals.
Explanation of terms
- Land use: Land use is based on the functional dimension of land for different human purposes or economic activities. Typical categories for land use are dwellings, industrial use, transport, recreational use or nature protection areas. Additional land use metrics can relate to the climate-related arrangements, activities, and inputs regarding these categories that public authorities engage in and can include land use change and land use management metrics.
Project-based carbon credits
(PA7.3) Has your public authority originated or purchased any project-based carbon credits within the reporting period?
Rationale
Carbon credits are used by public authorities for the purposes of compliance or as voluntary carbon offsets and can support the transition to a low carbon future. Data users are interested in learning about public authorities who have utilized carbon credits either by originating or purchasing.
Connection to other frameworks
SDG
Goal 11: Sustainable cities and communities
Goal 13: Climate action
Response options
Select one of the following options:
- Yes
- No
Requested content
General
- This question only applies to companies that have originated carbon credits or who have purchased them for the purposes of compliance or as voluntary carbon offsets.
(PA7.3a) Provide details of the project-based carbon credits originated or purchased by your public authority in the reporting period.
Rationale
Carbon credits can be originated from a variety of projects and are verified to a number of standards, data users are interested in learning about the scope of project types that are contributing to credit origination and purchase. Data users are also requesting information on the objectives of public authorities who have originated or purchased carbon credits and the extent to which they are used to achieve these objectives.
Connection to other frameworks
SDG
Goal 13: Climate action
Response options
Please complete the following table. The table is displayed over several rows for readability. You are able to add rows by using the “Add Row” button at the bottom of the table.
| Credit origination or credit purchase | Project type | Project identification | Verified to which standard |
|---|---|---|---|
|
Select from:
|
Select from:
|
Text field [maximum 2,400 characters] |
Select from:
|
| Number of credits (metric tons CO2e) | Number of credits (metric tons CO2e): Risk adjusted volume | Credits cancelled | Purpose, e.g. compliance |
|---|---|---|---|
Numerical field [enter a number from 0-99,999,999,999 using a maximum of 2 decimal places and no commas] | Numerical field [enter a number from 0-99,999,999,999 using a maximum of 2 decimal places and no commas] | Select from:
| Select from:
|
[Add Row]
Requested content
General
- If you select “Other, please specify”, provide a label for the Project type, Verified to which standard or Purpose, e.g. compliance.
Project-based carbon credit types
- Credits can be originated by a variety of projects and for several markets, which configures several project-based carbon credit types.
- Examples of project-based carbon credits include:
- Certified Emission Reductions (CERs) generated by activities under the Clean Development Mechanism (CDM);
- Emission Reduction Units (ERUs) generated by activities under the Joint Implementation mechanism; and
- Voluntary Emission Reductions (VERs) generated by activities that reduce emissions, but do not result in the creation of compliance-grade carbon units.
Credit origination or credit purchase (column 1)
- Credit origination - Select this option if you are the organization to which the credits are originally issued (e.g. you are one of the participating entities of a Clean Development Mechanism (CDM) project and you are entitled to a share of the credits issued by the CDM registry).
- Credit purchase - Select this option if you purchased the credits from another organization.
Number of credits (metric tons CO2e) (column 5)
- Enter the total number of annual credits that you have originated or purchased in metric tons CO2e based on the figures supplied in the agreements.
- The number of credits reported should be the credits that were originated in the reporting period, irrespective of whether you have already sold them and of whether they have been canceled or not.
Number of credits (metric tons CO2e): Risk-adjusted volume (column 6)
- Credits are sold at different stages in the life cycle of a project and therefore the volume of credits predicted will be adjusted according to different criteria, such as sector of project, stage of project, etc.
- Use this column to enter the number of annual credits that you are originating (in the pipeline), or, when you have purchased projects/credits that are still in the pipeline, provide a risk-adjusted figure (in metric tons CO2e) according to the level of risk.
- For the most part, this column applies to CDM projects that are in the pipeline and are not yet approved. Often the actual GHG reductions from a project are lower than initially forecasted, largely due to the materialization of risks associated with the project. This uncertainty means that these credits can usually be purchased at a significantly lower price than credits pertaining to more advanced stages of a project. Credits that are not yet produced in the CDM register, or in other words those that pertain to a project that is in its initial stages, are adjusted according to the risk factors and measured in “risk-adjusted volume.” If companies have no risks associated with their credit portfolio, then risk-adjusted volume can be equal to “number of credits.”
Credits canceled (column 7)
- “Canceled” means that the certificate cannot be used again.
- For further information, please check the Technical Note “Retirement vs. cancellation of instruments.”
PA8 Engagement
(PA8.1) Does your public authority engage with its supply and/or value chain on climate-related issues?
Rationale
The majority of most public authorities’ emissions occur outside their direct operations. In order to truly reduce global emissions, public authorities must engage with their value chain on climate-related issues. This question seeks to ascertain which companies are engaging in the best practice of working with upstream and downstream partners to reduce negative environmental impacts.
Connection to other frameworks
SDG
Goal 12: Responsible consumption and production
Response options
Please complete the following table. You are able to add rows by using the “Add Row” button at the bottom of the table.
| Stakeholder | Please explain |
|---|---|
Select all that apply:
|
Text field |
[Add Row]
Requested content
General
- Select all that apply for the reporting year, however if you select “No, we do not engage” do not select any of the other options.
- Select yes, only if you have engagements that cover GHG emissions and/or climate-related strategies (i.e. target setting, renewable energy procurement, etc.).
- Other partners in the value chain are any companies that you work with in your up- or downstream activities that are not your suppliers or customers. For example, you could select this option if you engage with your franchisees on GHG emissions and climate change strategies.
- Note that employees can be treated as value chain partners if they are making their own decisions on, for example, how they commute to work. However, if employees are under the direction of their manager for business travel, then they should not be treated as external to the public authority; in this instance, the value chain partner is the provider of the business travel, not the employee.
(PA8.2) Do your suppliers have to meet climate-related requirements as part of your public authority’s purchasing process?
Rationale
Setting climate-related requirements for suppliers increases their awareness of climate-related issues and drives climate action across the supply chain. This question indicates to data users the extent to which an organization is committed to driving action through its supply chain.
Connection to other frameworks
SDG
Goal 12: Responsible consumption and production
Response options
Select one of the following options:
- Yes, climate-related requirements are included in our supplier contracts
- Yes, suppliers have to meet climate-related requirements, but they are not included in our supplier contracts
- No, but we plan to introduce climate-related requirements within the next two years
- No, and we do not plan to introduce climate-related requirements within the next two years
Requested content
General
- Select “Yes, climate-related requirements are included in our supplier contracts” if your suppliers are obliged, as outlined in their contract with your public authority, to adhere to specific climate-related requirements set by your organization.
- Select “Yes, suppliers have to meet climate-related requirements, but they are not included in our supplier contracts” if your suppliers must meet climate-related requirements as part of your public authority’s purchasing process, but the requirements are not formally written as a contractual obligation. For example, your public authority may have a non-contractual supplier code of conduct featuring climate-related requirements, or climate-related requirements may be included in your public authority’s supplier selection process.
- Climate-related requirements can be either pre-requisites to establishing a purchasing relationship or be specified as metrics to achieve once onboarding is completed.
Explanation of terms
- Purchasing process: The formal process of buying goods and services. The term is broader than “procurement process” as it also includes supply chain management.
(PA8.3) Report your public authority’s most significant examples of collaboration with stakeholders on climate-related issues.
Response Options
Please complete the following table. You are able to add rows by using the “Add Row” button at the bottom of the table.
(*Column appearance is dependent on selections in this question.)
| Primary entity collaborated with | Mechanisms used to collaborate* | Areas collaboration focused on* | Description of collaboration* | Other entities collaborated with* |
|---|---|---|---|---|
| Select from: Government
Business
No significant examples of collaboration to report
| Select all that apply: Informational/Engagement
| Select all that apply:
| [Text field] | Select all that apply: Government
Civil society
|
Requested content
General
- In order to truly reduce global emissions, public authorities must collaborate with their stakeholders on climate-related issues. This question examines how public authorities are working with governments, businesses, and civil society. If your public authority is collaborating with other stakeholders on climate-related issues, use the drop-down list to select all those entities your public authority has been collaborating with. If you have engaged with different stakeholders on different areas or in different ways, use the “Add row” function in the table to reflect this.
- If your public authority has not yet collaborated with other stakeholders on climate-related issues, select an option under the group of “No significant examples of collaboration to report.”
- If you select an option from the “No significant examples of collaboration to report” group of options, you will not be presented with the subsequent columns as indicated by the * symbol.
- You are requested to report examples of your jurisdiction’s most significant examples of collaboration with governments, businesses, and/or civil society on climate-related issues. If you wish to provide further examples, you can do so by adding additional rows.
- According to the UN, "a successful sustainable development agenda requires partnerships between governments, the private sector and civil society. These inclusive partnerships built upon principles and values, a shared vision, and shared goals that place people and the planet at the centre, are needed at the global, regional, national and local level." (SDG Tracker)
- With respect to the example being reported, please select the primary entity for which your jurisdiction has been collaborating with on climate-related issues.
- If you have engaged with different entities for the specific example being reported, you will be able to report these in the column “Other entities collaborated with.”
- If you select the option “Not intending to collaborate” please briefly explain why in the text box that is presented and what the barriers are to collaborating with your jurisdiction’s stakeholders.
PA9 Further Information and Signoff
Further information
(PA-FI) Use this field to provide any additional information or context that you feel is relevant to your public authorities response. Please note that this field is optional.
Response options
This is an open text question with a limit of 9,999 characters.
Please note that when copying from another document into the ORS, formatting is not retained.
(PA9.1) Provide details for the person that has signed off (approved) your CDP Public Authorities Questionnaire response.
Rationale
CDP asks companies to identify the job title and corresponding job category of the person signing off (approving) the CDP response. This information signals to investors where in the corporate structure direct responsibility is being taken for the response and the information contained therein.
Response options
Please complete the following table:
| Job title | Corresponding job category |
|---|---|
|
Text field [maximum 200 characters] |
Select from:
|
Terms for responding to the CDP Public Authorities Questionnaire 2022
These terms apply if you are submitting a response to the CDP Public Authorities Questionnaire 2022.
1.DEFINITIONS
Affiliate(s): means any entity that controls, is controlled by, or is under common control with a party. For the purposes of this definition, “control” of an entity means the ownership, directly or indirectly, of more than fifty percent of the outstanding voting securities or capital stock of such entity, or the legal power to direct or cause the direction of the general management and policies of such entity.
Billing Company: means the organization determined in accordance with the table at the end of these terms.
CDP: means CDP Worldwide, a charitable company registered with the Charity Commission of England and Wales (registered charity no. 1122330 and company number 05013650). References to “we”, “our” and “us” in these terms are references to CDP.
Deadline: means 19 October 2022.
Fee: means the fee set out in the table at the end of these terms, which is exclusive of any applicable taxes.
Personal Data: means data which relates to an individual who can be identified from the data, such as a person’s name and job title.
Questionnaire: means the Public Authorities Questionnaire 2022.
Responding Organization: means the organization responding to the Questionnaire. References to “you” and “your” in these terms are references to the Responding Organization.
2.PARTIES
The parties to these terms shall be CDP, the Billing Company (where a Fee is payable and the Billing Company is not CDP) and the Responding Organization.
3.THESE TERMS
These are the terms that apply when you submit a response to our Questionnaire. If you do not agree to these terms, please contact us at [email protected].
4.RESPONDING TO OUR QUESTIONNAIRE
4.1 General. When responding to our Questionnaire, you will be given a choice as to whether your response can be made public or whether your response is non-public. We strongly encourage you to make your response public.
4.2 Deadline for responding. You must submit your response to us using our online response system by the Deadline for your response to be eligible for inclusion in reports. If you submit your response after the Deadline but on or before 7 December 2022 (the date our online response system will close in 2022), it may not be included in any report, data product or analysis.
4.3 Responding
Public responses. If you agree that your response can be made public, we may use and make it available as soon as it is received by CDP for all purposes that we decide (whether for a fee or otherwise), including, for example, making your response available on our website and to third parties.
Non-public responses. If your response is non-public, we may use it only as follows:
by making it available as soon as it is received by CDP to our Affiliates, companies we license to operate using the CDP name and brand (for example, CDP North America, Inc and CDP Europe AISBL), our country partners, research partners and report writers (each from time to time) for any use within their organizations but not for publication unless any data from your response has been anonymized or aggregated in such manner that it has the effect of being anonymized.
4.4 Amending your response. You may amend a response you have submitted at any time before 7 December 2022, but please note that any changes you make to your response after the Deadline may not be reflected in any CDP publication.
4.5 Future Questionnaires. Your submission of your response for the current year also constitutes your request to us to invite you and to remind you to respond in future years but you acknowledge that any future responses will be made upon the then-current version of these terms which you will need to accept at that time.
5.FEE
Fee. We are a not-for-profit organization and charge certain disclosing organizations an annual administrative fee to enable us to maintain the disclosure system. Unless you are exempt from paying the Fee, as set out below, or you are listed, incorporated or headquartered in a country/region that is listed in the next paragraph, you are required to pay the Fee plus any applicable taxes to the Billing Company. Please note that you may be charged an additional fee if you want to amend your response after the Deadline.
Countries/regions where the Fee applies. A Responding Organization will be required to pay the Fee plus any applicable taxes to the Billing Company unless it is listed, incorporated or headquartered in one of the following countries:
Albania, Belarus, Bulgaria, Croatia, the Czech Republic, Estonia, Hungary, Latvia, Lithuania, Poland, Romania, Russia, the Slovak Republic, Slovenia and Ukraine.
Exemptions from the Fee. Responding Organizations unable to pay the fee for any reason may contact CDP at [email protected] to request consideration for a one-year exemption. Exemptions will be granted at CDP’s sole discretion.
Please note we will decide in our absolute discretion as to whether the Fee is payable to the Billing Company or not and we will notify you before you submit your response.
Payment of the Fee. You must pay the Fee to the Billing Company by credit or debit card or request an invoice via CDP’s online corporate dashboard, which must be paid within such time as set out in the invoice. Please note that you will not be able to submit your response unless you have paid the Fee, you have requested an invoice or you are exempt from paying the Fee.
6.RIGHTS IN THE RESPONSES
Ownership. All intellectual property rights in your response will be owned by you or your licensors.
License. You grant to us, or shall procure for us, a perpetual, irrevocable, non-exclusive, assignable, sub-licensable, royalty-free and global license to use your response and any intellectual property rights including copyright and database rights in your response for the uses set out in these terms.
7.IMPORTANT REPRESENTATIONS
You confirm that:
(a) the person submitting the response to us is authorized by you to submit the response;
(b) you have obtained all necessary consents and permissions to submit the response to us;
(c) you are a legal entity and not a sole trader, partnership or natural person or persons; and
(d) the response that you submit:
(i) does not infringe the rights of any third party (including privacy, publicity or intellectual property rights);
(ii) does not defame any third party; and
(iii) does not include any Personal Data.
8.LIABILITY
We do not exclude or limit in any way our liability to you where it would be unlawful to do so. This includes liability for death or personal injury caused by our negligence or the negligence of our employees, agents or subcontractors, or for fraud or fraudulent misrepresentation.
We are not liable for financial losses. Subject to these terms, each of CDP and the Billing Company have no liability to you in any circumstances for any loss of revenue, loss of profit, loss of business, business interruption, loss of business opportunity, loss of goodwill, loss of reputation, loss of, damage to or corruption of data or software.
We are not liable for consequential losses. Subject to these terms, each of CDP and the Billing Company have no liability to you in any circumstances for any indirect or consequential loss or damage of any nature whatsoever.
Exclusion of liability. Subject to these terms, each of CDP and the Billing Company have no liability to you in any circumstances arising from the content or submission of your response to us, our use of your response and/or the use of or any reliance placed upon your response by you or by any third parties.
Limitation of liability. Subject to these terms, CDP and the Billing Company’s total liability to you in all circumstances shall be limited to an amount equivalent to the Fee or to USD 1,055 if you are not required to pay the Fee.
9. DATA PROTECTION
Each party acknowledges that during the course of their relationship CDP may process Personal Data including Personal Data which may be provided to it by or on behalf of the Responding Organization including the Personal Data of its registered users of the CDP dashboard and other contacts. CDP will only process such Personal Data for purposes related to its relationship with the Responding Organization including inviting and assisting the Responding Organization to complete the reporting process. You shall ensure that any relevant data subjects receive a fair processing notice which includes the above information and includes a reference to CDP’s privacy notice available at https://www.cdp.net/en/info/privacy-policy and shall otherwise ensure that CDP is able to process all Personal Data provided to it by or on behalf of the Responding Organization for the above purposes in compliance with applicable data protection legislation including the Data Protection Act 2018 as amended by the Data Protection, Privacy and Electronic Communications (Amendments etc.) (EU Exit) Regulations 2019 which merge the previous requirements of that Act with the requirements of the General Data Protection Regulation ((EU) 2016/679) (“UK GDPR”).
10. GENERAL
We may transfer our rights to someone else. We may transfer our rights and obligations under these terms to another organization.
Nobody else has any rights under these terms. These terms are between you and us. The Billing Company may enforce these terms for its own benefit but otherwise no other person shall have any rights to enforce any of its terms.
Entire agreement. These terms constitute the entire agreement between you and us in relation to your response to the Questionnaire.
Variation. CDP reserves the right to change these terms at any time. The consent of the Billing Company is not needed and any such changes shall be effective immediately or such other time as CDP elects. In the event of any materially adverse changes, you may request to withdraw your response within 30 days of us notifying you of the change.
If a court finds part of these terms illegal, the rest will continue in force. Each of the paragraphs of these terms operates separately. If any court or relevant authority decides that any of them are unlawful, the remaining paragraphs will remain in full force and effect.
Governing law and jurisdiction. These terms are governed by English law and you and us both submit to the exclusive jurisdiction of the English courts to resolve any dispute or claim arising out of or in connection with these terms or their subject matter or formation.
Language. If these terms are translated into any language other than English, the English language version will prevail.
11.AMOUNT OF FEE
| Location of Responding Organization | Fee (exclusive of any applicable taxes) |
|---|---|
| Brazil | BRL 6,060 |
| China | CN¥ 7,800 |
| Europe (excluding UK) | EUR 1,000 |
| India | INR 86,400 |
| Japan | JPY 105,300 |
| UK | GBP 848 |
| US, Canada and all other countries | USD 1,055 |
12.BILLING COMPANY
| Billing Company | Location of Responding Organization |
|---|---|
| CDP Worldwide | All countries/regions not listed elsewhere in this table |
| CDP Worldwide (Europe) gGmbH | Austria, Belgium, Denmark, Finland, France, Germany, Iceland, Italy, Luxembourg, Netherlands, Norway, Portugal, Spain, Sweden, Switzerland |
| CDP North America, Inc | Canada, USA |
| Carbon Disclosure Project (Latin America) | Antigua and Barbuda, Argentina, Aruba, Bahamas, Barbados, Belize, Bolivia, Brazil, Chile, Colombia, Costa Rica, Cuba, Dominica, Dominican Republic, Ecuador, El Salvador, Grenada, Guatemala, Guyana, Haiti, Honduras, Jamaica, Mexico, Nicaragua, Panama, Paraguay, Peru, Saint Kitts and Nevis, Saint Lucia, Saint Vincent and the Grenadines, Suriname, Trinidad and Tobago, Uruguay, Venezuela |
| Beijing Carbon Disclosure Project Environment Consulting Co., Ltd. (北京诚度普 环境咨询有限公司) | China |
| CDP Operations India Private Limited | India |
| 一般社団法人 CDP Worldwide-Japan |
Japan |